当前位置:网站首页>Flexible and easy-to-use sql monitoring script part7
Flexible and easy-to-use sql monitoring script part7
2022-08-09 07:06:00 【Dreamer DBA】
81.Script: locked_objects_internal.sql
-- Description : Lists all locks on the specific object.
[[email protected] monitoring]$ cat locked_objects_internal.sql
-- -----------------------------------------------------------------------------------
-- File Name    : /monitoring/locked_objects_internal.sql
-- Author       : Maxwell
-- Description  : Lists all locks on the specific object.
-- Requirements : Access to the DBA views.
-- Call Syntax  : @locked_objects_internal (object-name)
-- Last Modified: 08-AUG-2022
-- -----------------------------------------------------------------------------------
SET LINESIZE 1000 VERIFY OFF

COLUMN lock_type FORMAT A20
COLUMN mode_held FORMAT A10
COLUMN mode_requested FORMAT A10
COLUMN lock_id1 FORMAT A50
COLUMN lock_id2 FORMAT A30

SELECT li.session_id AS sid,
       s.serial#,
       li.lock_type,
       li.mode_held,
       li.mode_requested,
       li.lock_id1,
       li.lock_id2
FROM   dba_lock_internal li
       JOIN v$session s ON li.session_id = s.sid
WHERE  UPPER(lock_id1) LIKE UPPER('%&1%');

SET VERIFY ON
[[email protected] monitoring]$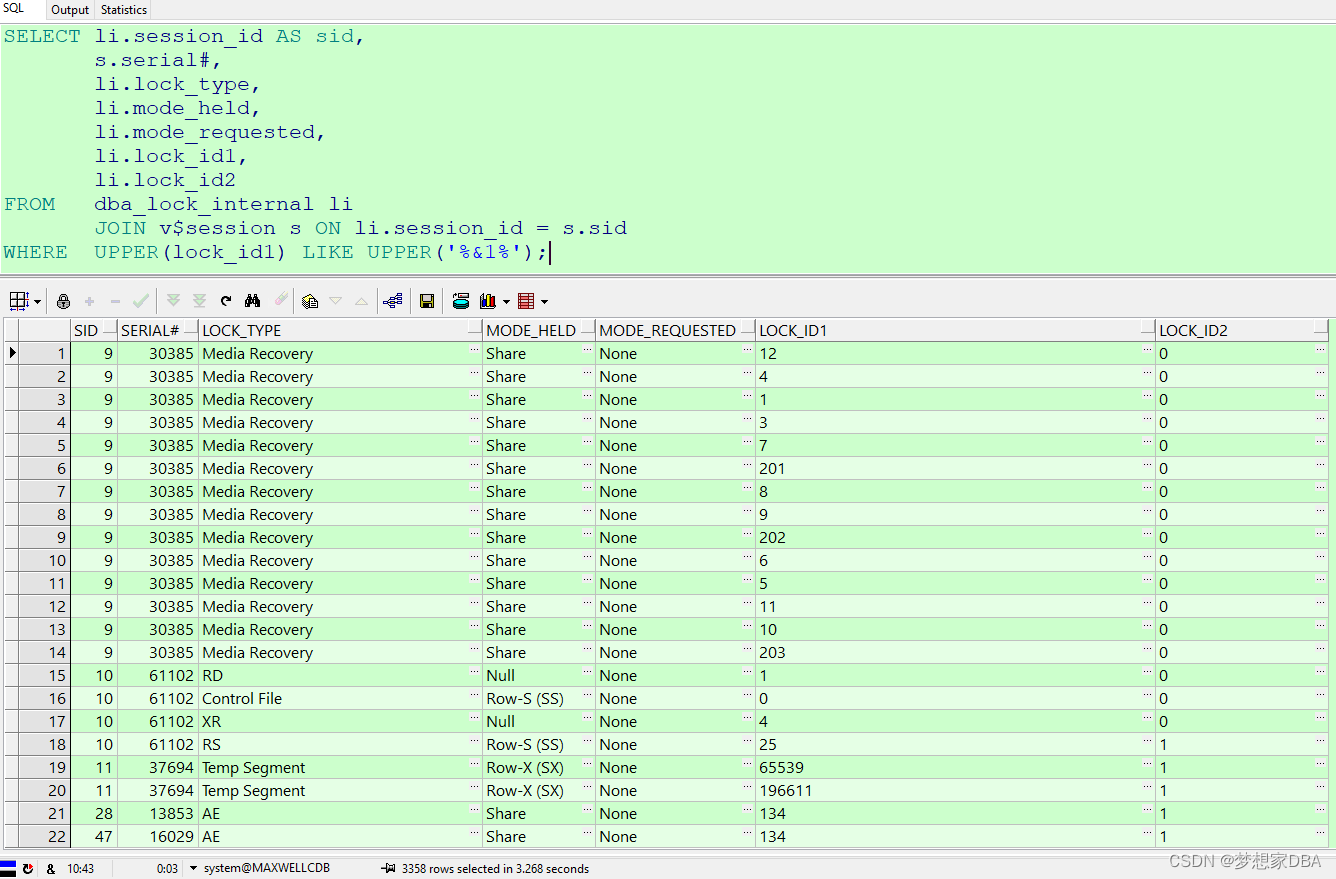
82.Script: logfiles.sql
-- Description : Displays information about redo log files.
[[email protected] monitoring]$ cat logfiles.sql
-- -----------------------------------------------------------------------------------
-- File Name    : /monitoring/logfiles.sql
-- Author       : Maxwell
-- Description  : Displays information about redo log files.
-- Requirements : Access to the V$ views.
-- Call Syntax  : @logfiles
-- Last Modified: 08-AUG-2022
-- -----------------------------------------------------------------------------------

SET LINESIZE 200
COLUMN member FORMAT A50
COLUMN first_change# FORMAT 99999999999999999999
COLUMN next_change# FORMAT 99999999999999999999

SELECT l.thread#,
       lf.group#,
       lf.member,
       TRUNC(l.bytes/1024/1024) AS size_mb,
       l.status,
       l.archived,
       lf.type,
       lf.is_recovery_dest_file AS rdf,
       l.sequence#,
       l.first_change#,
       l.next_change#
FROM   v$logfile lf
       JOIN v$log l ON l.group# = lf.group#
ORDER BY l.thread#,lf.group#, lf.member;

SET LINESIZE 80
[[email protected] monitoring]$ 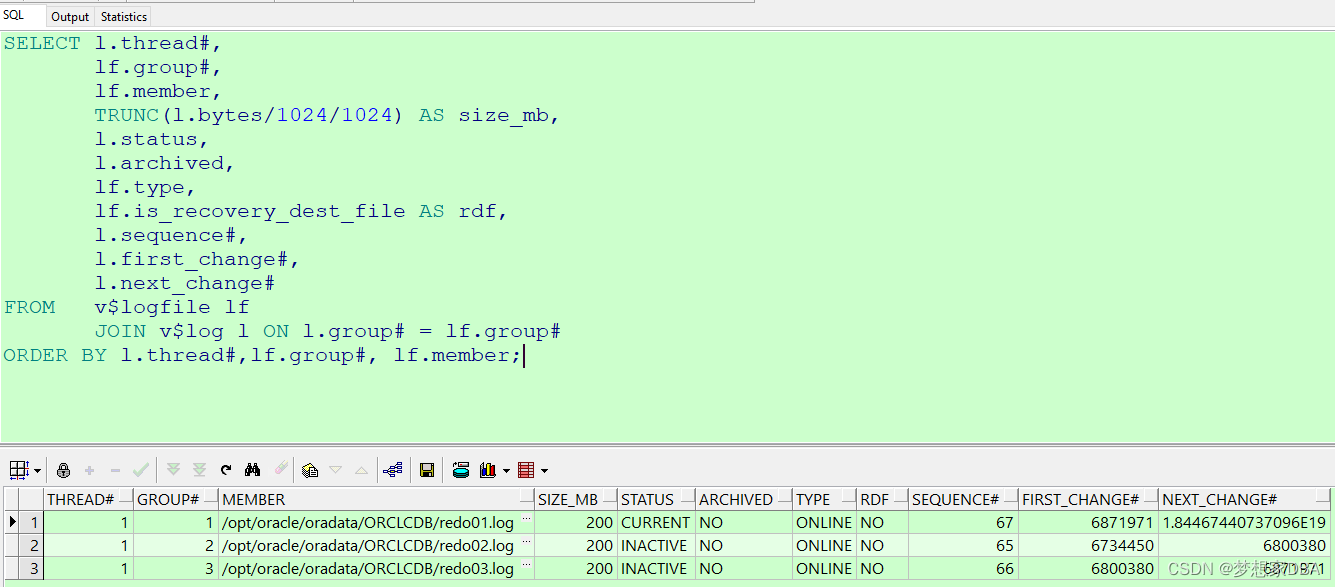
83.Script: longops.sql
-- Description : Displays information on all long operations.
[[email protected] monitoring]$ cat longops.sql
-- -----------------------------------------------------------------------------------
-- File Name    : /monitoring/longops.sql
-- Author       : Maxwell
-- Description  : Displays information on all long operations.
-- Requirements : Access to the V$ views.
-- Call Syntax  : @longops
-- Last Modified: 08-AUG-2022
-- -----------------------------------------------------------------------------------

COLUMN sid FORMAT 999
COLUMN serial# FORMAT 9999999
COLUMN machine FORMAT A30
COLUMN progress_pct FORMAT 99999999.00
COLUMN elapsed FORMAT A10
COLUMN remaining FORMAT A10

SELECT s.sid,
       s.serial#,
       s.machine,
       ROUND(sl.elapsed_seconds/60) || ':' || MOD(sl.elapsed_seconds,60) elapsed,
       ROUND(sl.time_remaining/60) || ':' || MOD(sl.time_remaining,60) remaining,
       ROUND(sl.sofar/sl.totalwork*100, 2) progress_pct
FROM   v$session s,
       v$session_longops sl
WHERE  s.sid     = sl.sid
AND    s.serial# = sl.serial#;
[[email protected] monitoring]$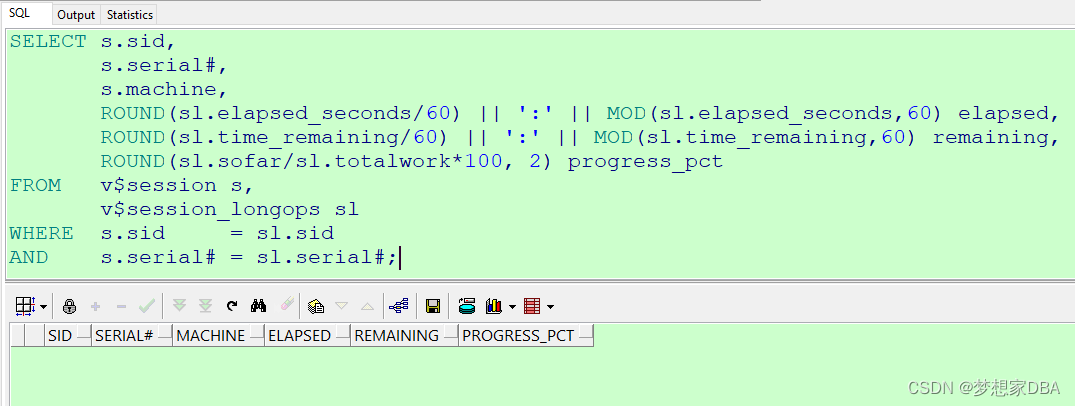
84.Script: lru_latch_ratio.sql
-- Description : Displays current LRU latch ratios.
[[email protected] monitoring]$ cat lru_latch_ratio.sql
-- -----------------------------------------------------------------------------------
-- File Name    : /monitoring/lru_latch_ratio.sql
-- Author       : Maxwell
-- Description  : Displays current LRU latch ratios.
-- Requirements : Access to the V$ views.
-- Call Syntax  : @lru_latch_hit_ratio
-- Last Modified: 08-AUG-2022
-- -----------------------------------------------------------------------------------
SET LINESIZE 500
SET PAGESIZE 1000
COLUMN "Ratio %" FORMAT 990.00

PROMPT
PROMPT Values greater than 3% indicate contention.

SELECT a.child#,
       (a.SLEEPS / a.GETS) * 100 "Ratio %"
FROM   v$latch_children a
WHERE  a.name      = 'cache buffers lru chain'
ORDER BY 1;


SET PAGESIZE 14
[[email protected] monitoring]$
85.Script: max_extents.sql
-- Description : Displays all tables and indexes nearing their MAX_EXTENTS setting.
[[email protected] monitoring]$ cat max_extents.sql
-- -----------------------------------------------------------------------------------
-- File Name    : /monitoring/max_extents.sql
-- Author       : Maxwell
-- Description  : Displays all tables and indexes nearing their MAX_EXTENTS setting.
-- Requirements : Access to the DBA views.
-- Call Syntax  : @max_extents
-- Last Modified: 08-AUG-2022
-- -----------------------------------------------------------------------------------
SET LINESIZE 500
SET PAGESIZE 1000
SET VERIFY OFF

PROMPT
PROMPT Tables and Indexes nearing MAX_EXTENTS
PROMPT **************************************
SELECT e.owner,
       e.segment_type,
       Substr(e.segment_name, 1, 30) segment_name,
       Trunc(s.initial_extent/1024) "INITIAL K",
       Trunc(s.next_extent/1024) "NEXT K",
       s.max_extents,
       Count(*) as extents
FROM   dba_extents e,
       dba_segments s
WHERE  e.owner        = s.owner
AND    e.segment_name = s.segment_name
AND    e.owner        NOT IN ('SYS', 'SYSTEM')
GROUP BY e.owner, e.segment_type, e.segment_name, s.initial_extent, s.next_extent, s.max_extents
HAVING Count(*) > s.max_extents - 10
ORDER BY e.owner, e.segment_type, Count(*) DESC;
[[email protected] monitoring]$ 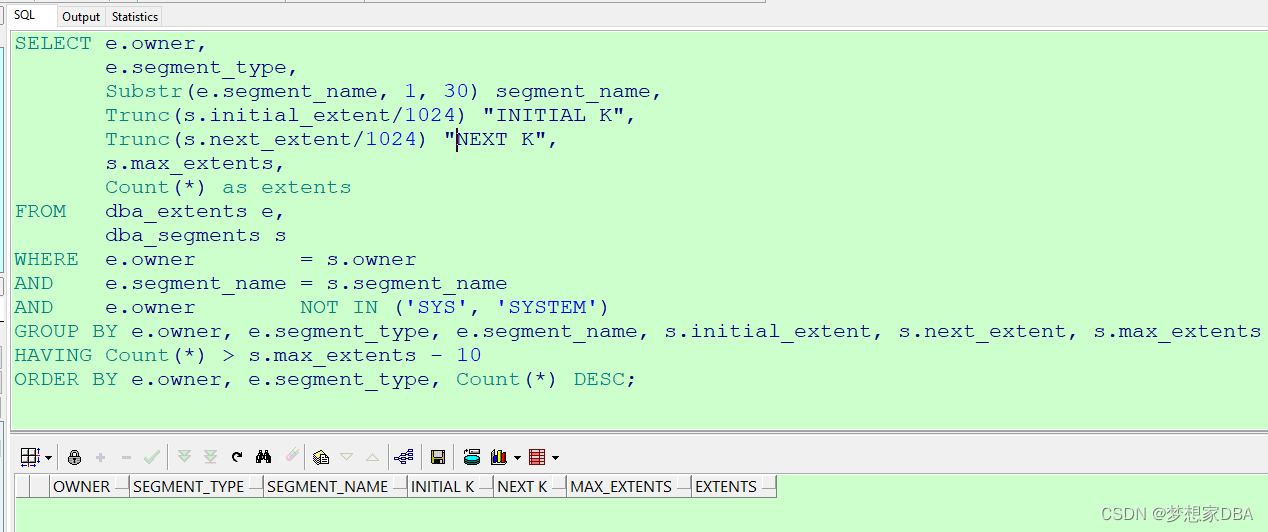
86.Script: min_datafile_size.sql
-- Description : Displays smallest size the datafiles can shrink to without a reorg.
[[email protected] monitoring]$ cat min_datafile_size.sql
-- -----------------------------------------------------------------------------------
-- File Name    : /monitoring/min_datafile_size.sql
-- Author       : Maxwell
-- Description  : Displays smallest size the datafiles can shrink to without a reorg.
-- Requirements : Access to the V$ and DBA views.
-- Call Syntax  : @min_datafile_size
-- Last Modified: 08-AUG-2022
-- -----------------------------------------------------------------------------------

COLUMN block_size NEW_VALUE v_block_size

SELECT TO_NUMBER(value) AS block_size
FROM   v$parameter
WHERE  name = 'db_block_size';

COLUMN tablespace_name FORMAT A20
COLUMN file_name FORMAT A50
COLUMN current_bytes FORMAT 999999999999999
COLUMN shrink_by_bytes FORMAT 999999999999999
COLUMN resize_to_bytes FORMAT 999999999999999
SET VERIFY OFF
SET LINESIZE 200

SELECT a.tablespace_name,
       a.file_name,
       a.bytes AS current_bytes,
       a.bytes - b.resize_to AS shrink_by_bytes,
       b.resize_to AS resize_to_bytes
FROM   dba_data_files a,
       (SELECT file_id, MAX((block_id+blocks-1)*&v_block_size) AS resize_to
                FROM   dba_extents
                        GROUP by file_id) b
                WHERE  a.file_id = b.file_id
                ORDER BY a.tablespace_name, a.file_name;
[[email protected] monitoring]$ 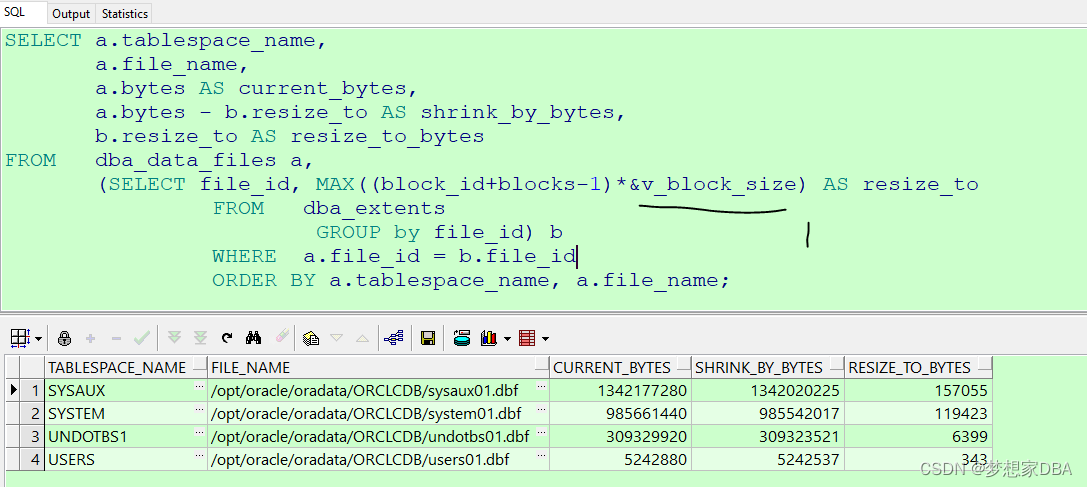
87.Script: part_tables.sql
-- Description : Displays information about all partitioned tables.
[[email protected] monitoring]$ cat part_tables.sql
-- -----------------------------------------------------------------------------------
-- File Name    : /monitoring/part_tables.sql
-- Author       : Maxwell
-- Description  : Displays information about all partitioned tables.
-- Requirements : Access to the DBA views.
-- Call Syntax  : @part_tables
-- Last Modified: 08-AUG-2022
-- -----------------------------------------------------------------------------------

SELECT owner, table_name, partitioning_type, partition_count
FROM   dba_part_tables
WHERE  owner NOT IN ('SYS', 'SYSTEM')
ORDER BY owner, table_name;
[[email protected] monitoring]$ 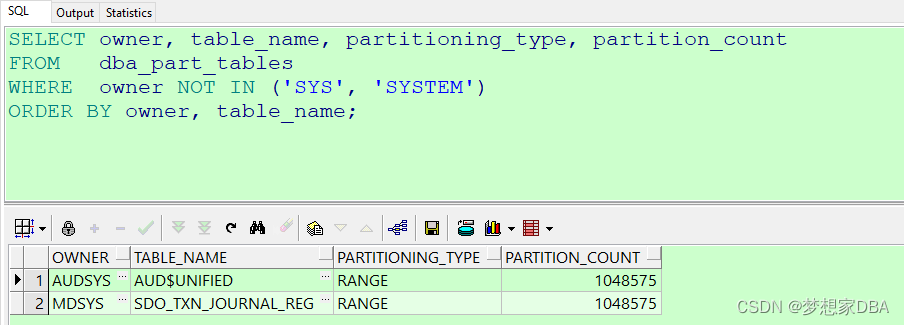
88.Script: page_target_advice.sql
-- Description : Predicts how changes to the PGA_AGGREGATE_TARGET will affect PGA usage.
[[email protected] monitoring]$ cat pga_target_advice.sql
-- -----------------------------------------------------------------------------------
-- File Name    : /monitoring/pga_target_advice.sql
-- Author       : Maxwell
-- Description  : Predicts how changes to the PGA_AGGREGATE_TARGET will affect PGA usage.
-- Requirements : Access to the V$ views.
-- Call Syntax  : @pga_target_advice
-- Last Modified: 08-AUG-2022
-- -----------------------------------------------------------------------------------

SELECT ROUND(pga_target_for_estimate/1024/1024) target_mb,
       estd_pga_cache_hit_percentage cache_hit_perc,
       estd_overalloc_count
FROM   v$pga_target_advice;
[[email protected] monitoring]$ 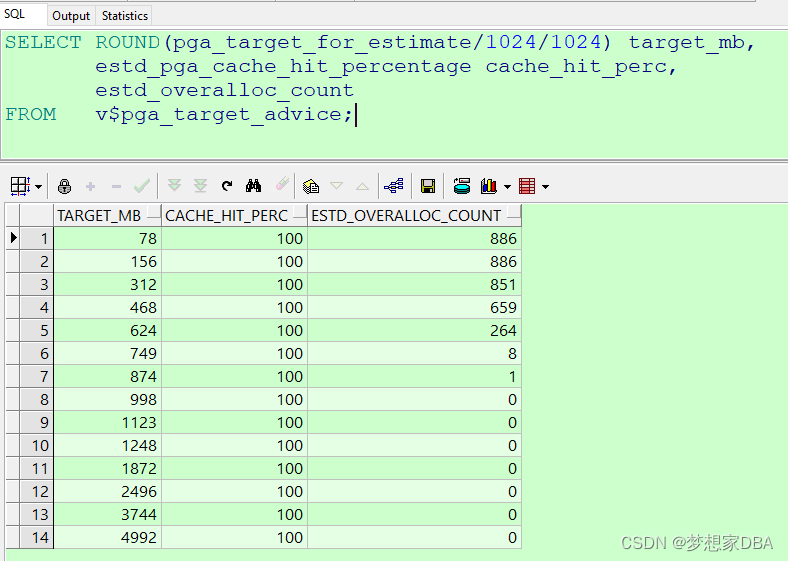
89.Script: pipes.sql
-- Description : Displays a list of all database pipes.
[[email protected] monitoring]$ cat pipes.sql
-- -----------------------------------------------------------------------------------
-- File Name    : /monitoring/pipes.sql
-- Author       : Maxwell
-- Description  : Displays a list of all database pipes.
-- Requirements : Access to the V$ views.
-- Call Syntax  : @pipes
-- Last Modified: 08-AUG-2022
-- -----------------------------------------------------------------------------------
SET LINESIZE 100

COLUMN name FORMAT A40

SELECT ownerid,
       name,
       type,
       pipe_size
FROM   v$db_pipes
ORDER BY 1,2;
[[email protected] monitoring]$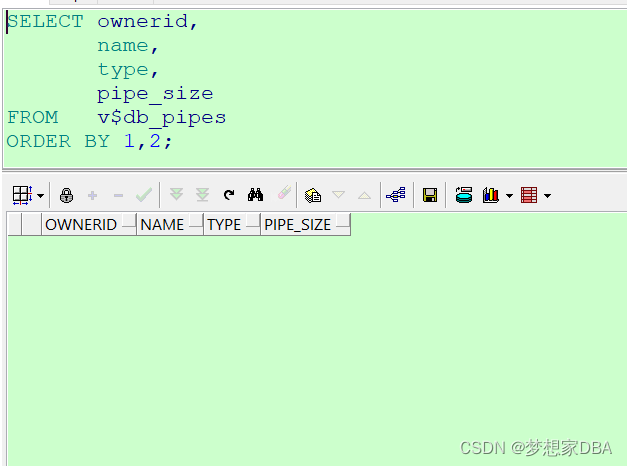
90.Script: profiler_run_details.sql
-- Description : Displays details of a specified profiler run.
[[email protected] monitoring]$ cat profiler_run_details.sql
-- -----------------------------------------------------------------------------------
-- File Name    : /monitoring/profiler_run_details.sql
-- Author       : Maxwell
-- Description  : Displays details of a specified profiler run.
-- Requirements : Access to the V$ views.
-- Call Syntax  : @profiler_run_details.sql (runid)
-- Last Modified: 08-AUG-2022
-- -----------------------------------------------------------------------------------
SET LINESIZE 200
SET VERIFY OFF

COLUMN runid FORMAT 99999
COLUMN unit_number FORMAT 99999
COLUMN unit_type FORMAT A20
COLUMN unit_owner FORMAT A20

SELECT u.runid,
       u.unit_number,
       u.unit_type,
       u.unit_owner,
       u.unit_name,
       d.line#,
       d.total_occur,
       ROUND(d.total_time/d.total_occur) as time_per_occur,
       d.total_time,
       d.min_time,
       d.max_time
FROM   plsql_profiler_units u
       JOIN plsql_profiler_data d ON u.runid = d.runid AND u.unit_number = d.unit_number
WHERE  u.runid = &1
AND    d.total_time > 0
AND    d.total_occur > 0
ORDER BY (d.total_time/d.total_occur) DESC, u.unit_number, d.line#;
[[email protected] monitoring]$ 边栏推荐
- Distributed id generator implementation
- 常见的分布式事务解决方案
- RK3568商显版开源鸿蒙板卡产品解决方案
- composer 内存不足够
- 子路由及路由出口配置
- HDU - 3183 A Magic Lamp Segment Tree
- 2022 年全球十大最佳自动化测试工具
- codeforces Valera and Elections (这思维题是做不明白了)
- 【模板】树链剖分 P3384
- Altium designer software commonly used the most complete package library, including schematic library, PCB library and 3D model library
猜你喜欢
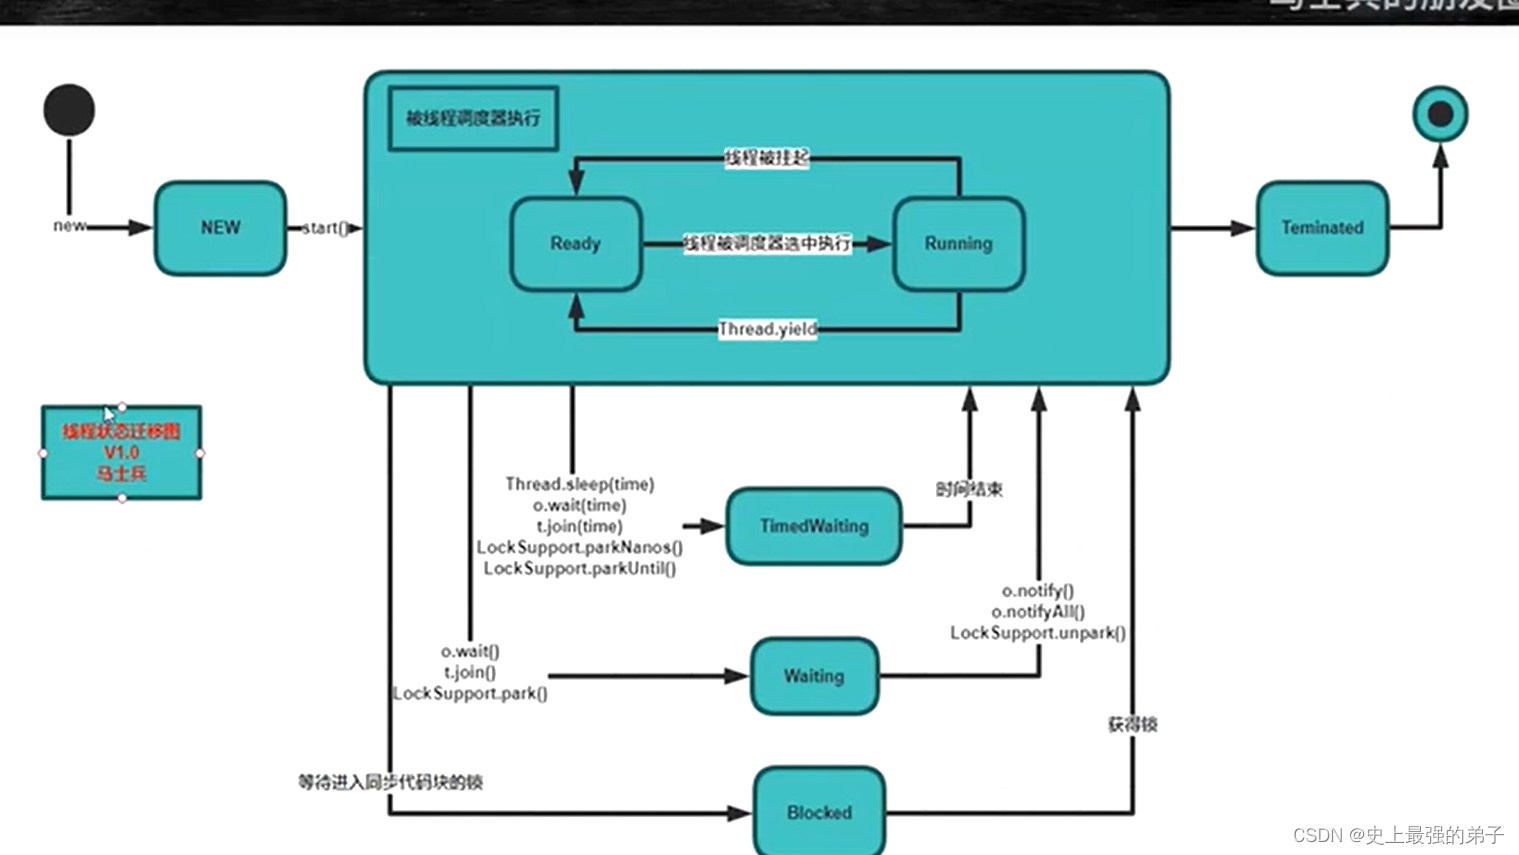
The JVM thread state
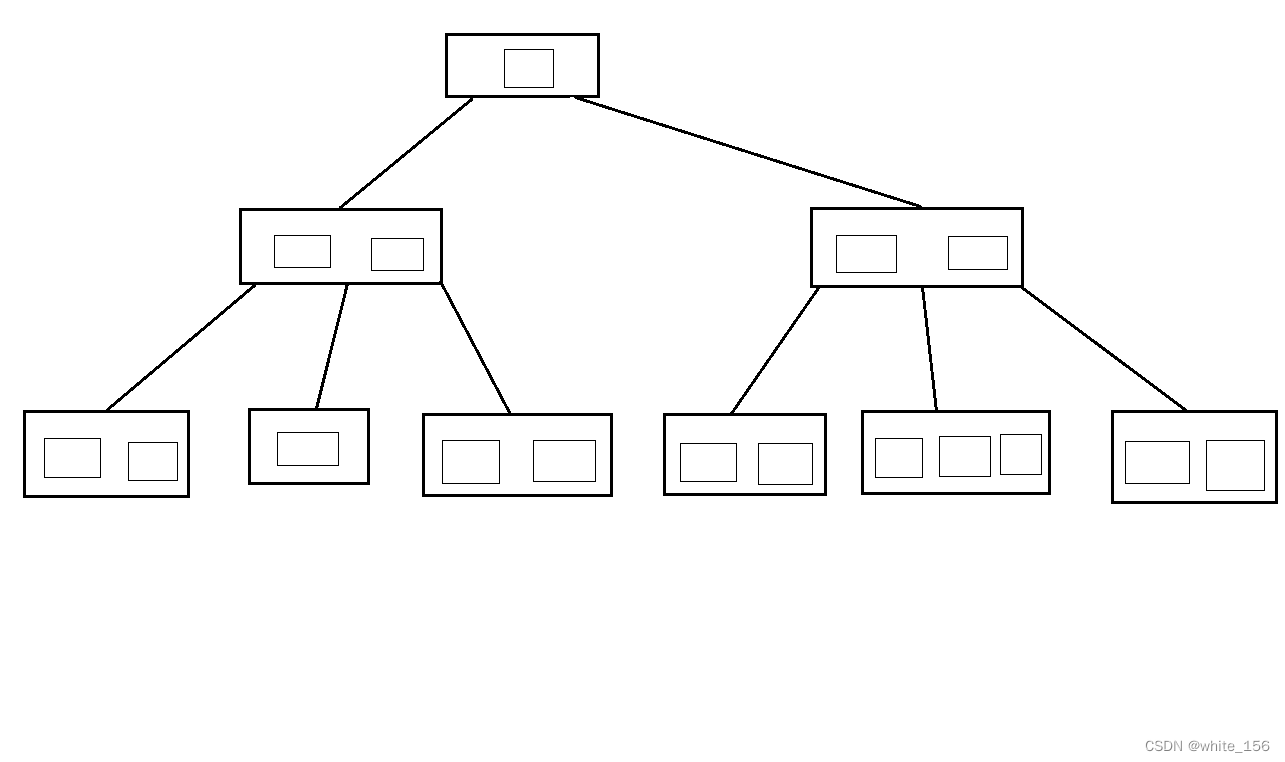
数据库索引原理
灵活好用的sql monitoring 脚本 part7
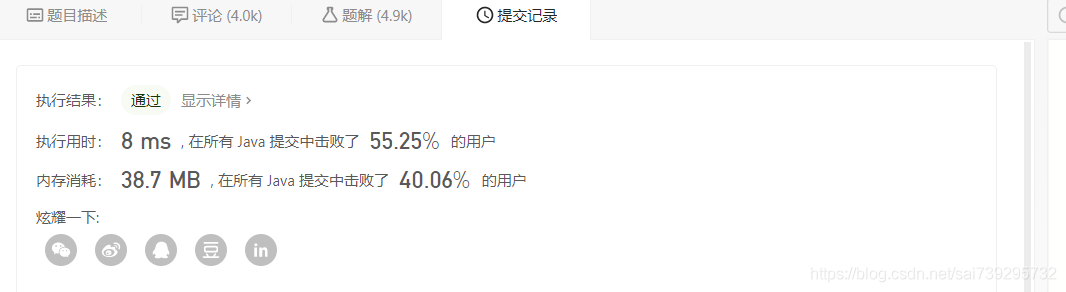
longest substring without repeating characters
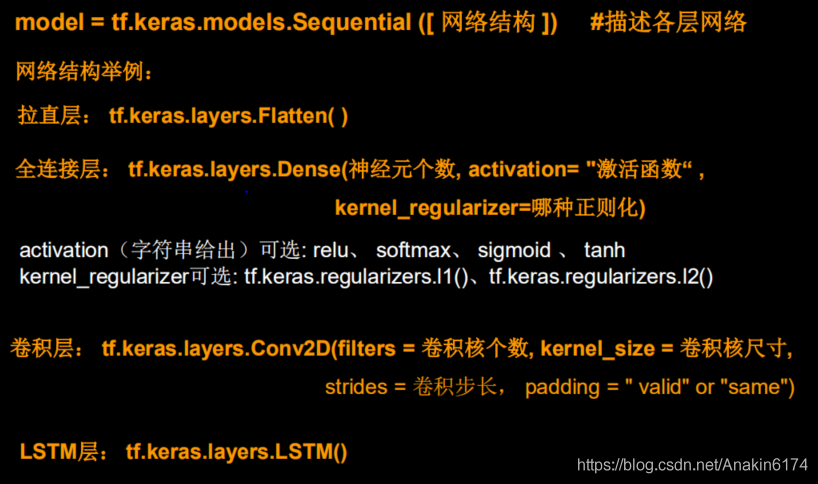
用tensorflow.keras模块化搭建神经网络模型

unity第一课

Altium designer software commonly used the most complete package library, including schematic library, PCB library and 3D model library
Mysql实操
DSP+ARM+FPGA高速PCIE/千兆网口信号仿真介绍
找不到和chrome浏览器版本不同的chromedriver的解决方法
随机推荐
DSP+ARM+FPGA高速PCIE/千兆网口信号仿真介绍
查看日志常用命令
eyb:Redis学习(2)
mysql summary
【MySQL】update mysql.user set authentication_string=password(“123456“) where User=‘root‘; 报错
Better Scroll Y上下滚动无法上拉滚动解决办法
Altium designer software commonly used the most complete package library, including schematic library, PCB library and 3D model library
差分约束-图论
HDU - 3183 A Magic Lamp 线段树
单例 DCL(double check lock) 饱汉模式和饿汉模式
Service
当酷雷曼VR直播遇上视频号,会摩擦出怎样的火花?
Unity first lesson
高项 01 信息化与信息系统
Lottie系列四:使用建议
way of thinking problem-solving skills
错误:为 repo ‘oracle_linux_repo‘ 下载元数据失败 : Cannot download repomd.xml: Cannot download repodata/repomd.
Mysql实操
【烂笔头】各厂商手机手动抓log
The AD in the library of library file suffix. Intlib. Schlib. Pcblib difference