当前位置:网站首页>Prometheus Operator 通过additional 添加target
Prometheus Operator 通过additional 添加target
2022-08-09 18:53:00 【叱咤少帅(少帅)】
前言
Proms Operator 添加自定义监控可以通过如下两种方式实现,本文是 additional 方式。
- additional 方式
- serviceMonitor方式
官网
安装参考这个专栏里以前的博文。
##
https://github.com/prometheus-operator/kube-prometheus#quickstart
按照官网的部署,这个方式部署起来的prometheus还有很多的缺陷,不能直接用于生产环境使用,具体问题点如下:
官网
##
https://github.com/prometheus-operator/prometheus-operator/blob/main/Documentation/additional-scrape-config.md
vim prometheus-prometheus.yaml
末尾添加:
  additionalScrapeConfigs:
    name: additional-scrape-configs
    key: prometheus-additional.yaml
vim prometheus-additional.yaml
- job_name: "base-linux"
  static_configs:
  - targets: ["192.168.0.36:9090","192.168.0.11:9090"]

- job_name: "kafka-explorer"
  static_configs:
  - targets: ["192.168.0.11:9000"]
添加secret
kubectl create secret generic additional-scrape-configs --from-file=prometheus-additional.yaml --dry-run=client -oyaml > additional-scrape-configs.yaml
Next, apply the generated kubernetes manifest
##
kubectl apply -f additional-scrape-configs.yaml -n monitoring
查看

边栏推荐
猜你喜欢

IS31FL3737B 通用12×12 LED驱动器 I2C 42mA 40QFN
IS31FL3737B general 12 x 12 LED drive 40 QFN I2C 42 ma

小满nestjs(第六章 nestjs cli 常用命令)

基于CC2530 E18-MS1-PCB Zigbee DIY作品(三)
![[免费专栏] Android安全之Android工程模式](/img/9e/373a513dd3cd4681ff969432c9dfd5.png)
[免费专栏] Android安全之Android工程模式

ebook下载 | 《 企业高管IT战略指南——企业为何要落地DevOps》
基于SSM实现手机销售商城系统

C#/VB.NET: Extract text and pictures from PowerPoint document

uniapp离线推送华为厂商申请流程
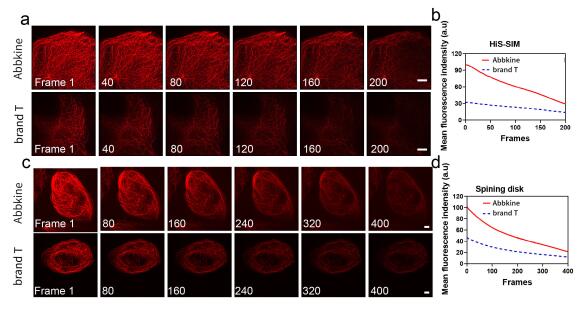
Abbkine TraKine Pro 活细胞微管染色试剂盒重要特色
随机推荐
[免费专栏] Android安全之Root检测和绕过(浅析)
NetCore路由的Endpoint模式
uniapp离线推送华为厂商申请流程
IS31FL3737B 通用12×12 LED驱动器 I2C 42mA 40QFN
ebook download | "Business executives' IT strategy guide - why enterprises should implement DevOps"
最新BEV感知基线 | 你确定需要激光雷达?(卡内基梅隆大学)
数学建模代码速成~赛前一个月~matlab~代码模板~吐血总结~三大模型代码(预测模型、优化模型、评价模型)
OpenSSL SSL_read: Connection was reset, errno 10054
AttributeError: module ‘click‘ has no attribute ‘get_os_args‘
基于CC2530 E18-MS1-PCB Zigbee DIY作品(二)
Openharmony Lightweight System Experiment--GPIO Lighting
获取一段程序运行的时间
poj 1182 食物链(带权并查集)
明明加了唯一索引,为什么还是产生重复数据?
源码编译安装与yum和rpm软件安装详解
Leetcode 739.每日温度 单调栈
pytest框架之mark标记功能详细介绍
Swift -- 数组高阶函数
MYSQL记录、自用
以技术创新加速国家“碳中和”建设进程,华为云创新中心助力欣冠精密实现云智控“气”