当前位置:网站首页>Flume (六) --------- Flume 数据流监控
Flume (六) --------- Flume 数据流监控
2022-08-09 18:13:00 【在森林中麋了鹿】
一、Ganglia 的安装与部署
Ganglia 由 gmond、gmetad 和 gweb 三部分组成。
gmond (Ganglia Monitoring Daemon) 是一种轻量级服务,安装在每台需要收集指标数据的节点主机上。使用 gmond,你可以很容易收集很多系统指标数据,如 CPU、内存、磁盘、网络和活跃进程的数据等。
gmetad (Ganglia Meta Daemon) 整合所有信息,并将其以 RRD 格式存储至磁盘的服务。
gweb(Ganglia Web)Ganglia 可视化工具,gweb 是一种利用浏览器显示 gmetad 所存储数据的 PHP 前端。在 Web 界面中以图表方式展现集群的运行状态下收集的多种不同指标数据。
安装 ganglia
A、规划
hadoop102: web gmetad gmod
hadoop103: gmod
hadoop104: gmod
B、在 102 103 104 分别安装 epel-release
[[email protected] flume]$ sudo yum -y install epel-release
C、在 102 安装
[[email protected] flume]$ sudo yum -y install ganglia-gmetad
[[email protected] flume]$ sudo yum -y install ganglia-web
[[email protected] flume]$ sudo yum -y install ganglia-gmond
D、在 103 和 104 安装
[[email protected] flume]$ sudo yum -y install ganglia-gmond
E、在 102 修改配置文件/etc/httpd/conf.d/ganglia.conf
[[email protected] flume]$ sudo vim
/etc/httpd/conf.d/ganglia.conf
# Ganglia monitoring system php web frontend
#
Alias /ganglia /usr/share/ganglia
<Location /ganglia>
	# Require local
	# 通过 windows 访问 ganglia,需要配置 Linux 对应的主机(windows)ip 地址
	Require ip 192.168.9.1
	# Require ip 10.1.2.3
	# Require host example.org
</Location>
F、在 102 修改配置文件 /etc/ganglia/gmetad.conf
[[email protected] flume]$ sudo vim /etc/ganglia/gmetad.conf
修改为: data_source “my cluster” hadoop102
G、在 102 103 104 修改配置文件 /etc/ganglia/gmond.conf
[[email protected] flume]$ sudo vim /etc/ganglia/gmond.conf
修改为:
cluster {

	name = "my cluster"
	owner = "unspecified"
	latlong = "unspecified"
	url = "unspecified"
}

udp_send_channel {

	#bind_hostname = yes # Highly recommended, soon to be default.
	# This option tells gmond to use a source
	address
	# that resolves to the machine's hostname.
	Without
	# this, the metrics may appear to come from
	any
	# interface and the DNS names associated with
	# those IPs will be used to create the RRDs.
	# mcast_join = 239.2.11.71
	# 数据发送给 hadoop102
	host = hadoop102
	port = 8649
	ttl = 1
}

udp_recv_channel {

	# mcast_join = 239.2.11.71
	port = 8649
	# 接收来自任意连接的数据
	bind = 0.0.0.0
	retry_bind = true
	# Size of the UDP buffer. If you are handling lots of metrics
	you really
	# should bump it up to e.g. 10MB or even higher.
	# buffer = 10485760
}
H、在 102 修改配置文件 /etc/selinux/config
[[email protected] flume]$ sudo vim /etc/selinux/config
修改为:
# This file controls the state of SELinux on the system.
# SELINUX= can take one of these three values:
# enforcing - SELinux security policy is enforced.
# permissive - SELinux prints warnings instead of enforcing.
# disabled - No SELinux policy is loaded.
SELINUX=disabled
# SELINUXTYPE= can take one of these two values:
# targeted - Targeted processes are protected,
# mls - Multi Level Security protection.
SELINUXTYPE=targeted
提示:selinux 生效需要重启,如果此时不想重启,可以临时生效之:
[[email protected] flume]$ sudo setenforce 0
I、启动 ganglia
在 102 103 104 启动
[[email protected] flume]$ sudo systemctl start gmond
J、在 102 启动
[[email protected] flume]$ sudo systemctl start httpd
[[email protected] flume]$ sudo systemctl start gmetad
K、打开网页浏览 ganglia 页面http://hadoop102/ganglia
提示:如果完成以上操作依然出现权限不足错误,请修改/var/lib/ganglia 目录的权限:
[[email protected] flume]$ sudo chmod -R 777 /var/lib/ganglia
二、操作 Flume 测试监控
启动 Flume 任务
[[email protected] flume]$ bin/flume-ng agent \
-c conf/ \
-n a1 \
-f job/flume-netcat-logger.conf \
-Dflume.root.logger=INFO,console \
-Dflume.monitoring.type=ganglia \
-Dflume.monitoring.hosts=hadoop102:8649
发送数据观察 ganglia 监测图
[[email protected] flume]$ nc localhost 44444
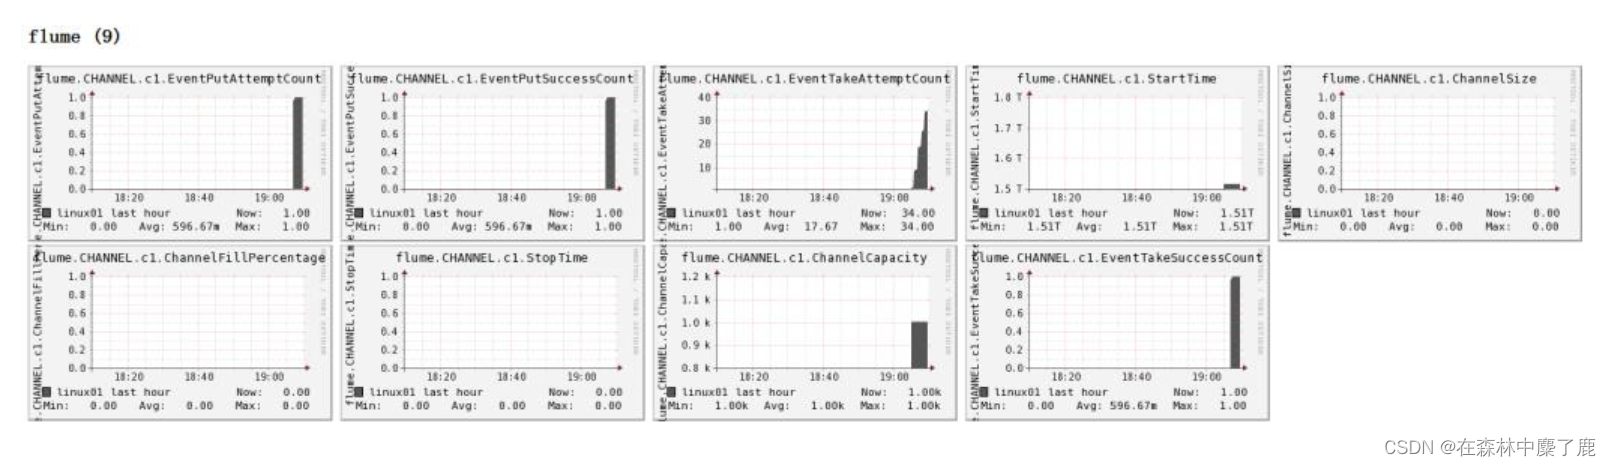
| 字段 (图表名称) | 字段含义 |
|---|---|
| EventPutAttemptCount | source 尝试写入 channel 的事件总数量 |
| EventPutSuccessCount | 成功写入 channel 且提交的事件总数量 |
| EventTakeAttemptCount | sink尝试从 channel 拉取事件的总数量。 |
| EventTakeSuccessCount | sink 成功读取的事件的总数量 |
| StartTime | channel 启动的时间(毫秒) |
| StopTime | channel 停止的时间(毫秒) |
| ChannelSize | 目前 channel 中事件的总数量 |
| ChannelFillPercentage | channel 占用百分比 |
| ChannelCapacity | channel 的容量 |
边栏推荐
猜你喜欢

Ng DevUI 周下载量突破1000啦!
![[免费专栏] Android安全之静态方式逆向APK应用浅析【手动注入smali+】+【IDA Pro静态分析so文件】+【IDA Pro基础使用讲解】](/img/05/61cf11d03cb3bd785bba1b12bc946e.png)
[免费专栏] Android安全之静态方式逆向APK应用浅析【手动注入smali+】+【IDA Pro静态分析so文件】+【IDA Pro基础使用讲解】

Flink运行架构

全自动化机器学习建模!效果吊打初级炼丹师!

对数学直观、感性的认知是理解数学、喜爱数学的必经之路,这本书做到了!
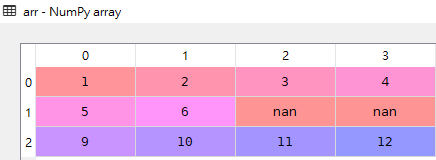
numpy中nan_to_num如何使用
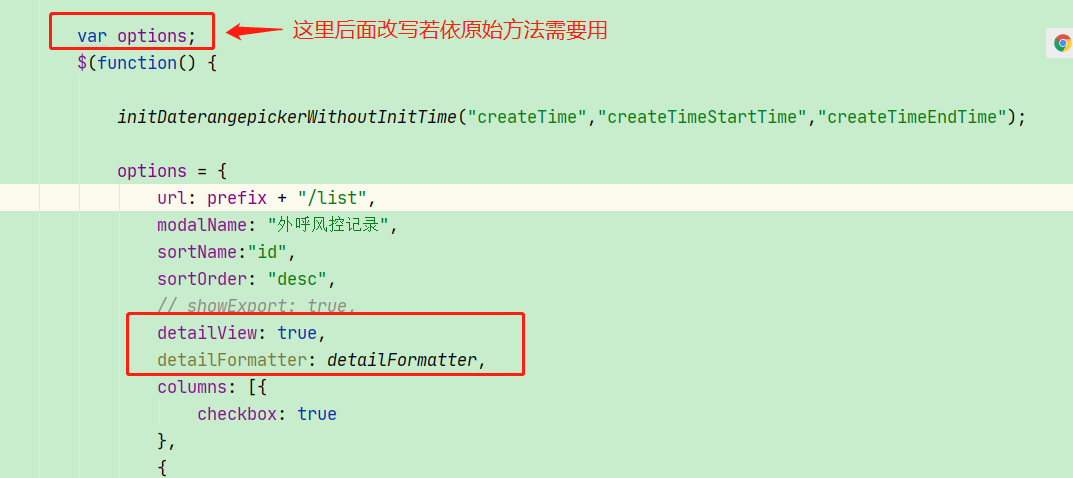
Open Source Summer | List Details Display Based on Ruoyi Architecture
释放数据价值的真正法宝,数据要素市场化开发迫在眉睫
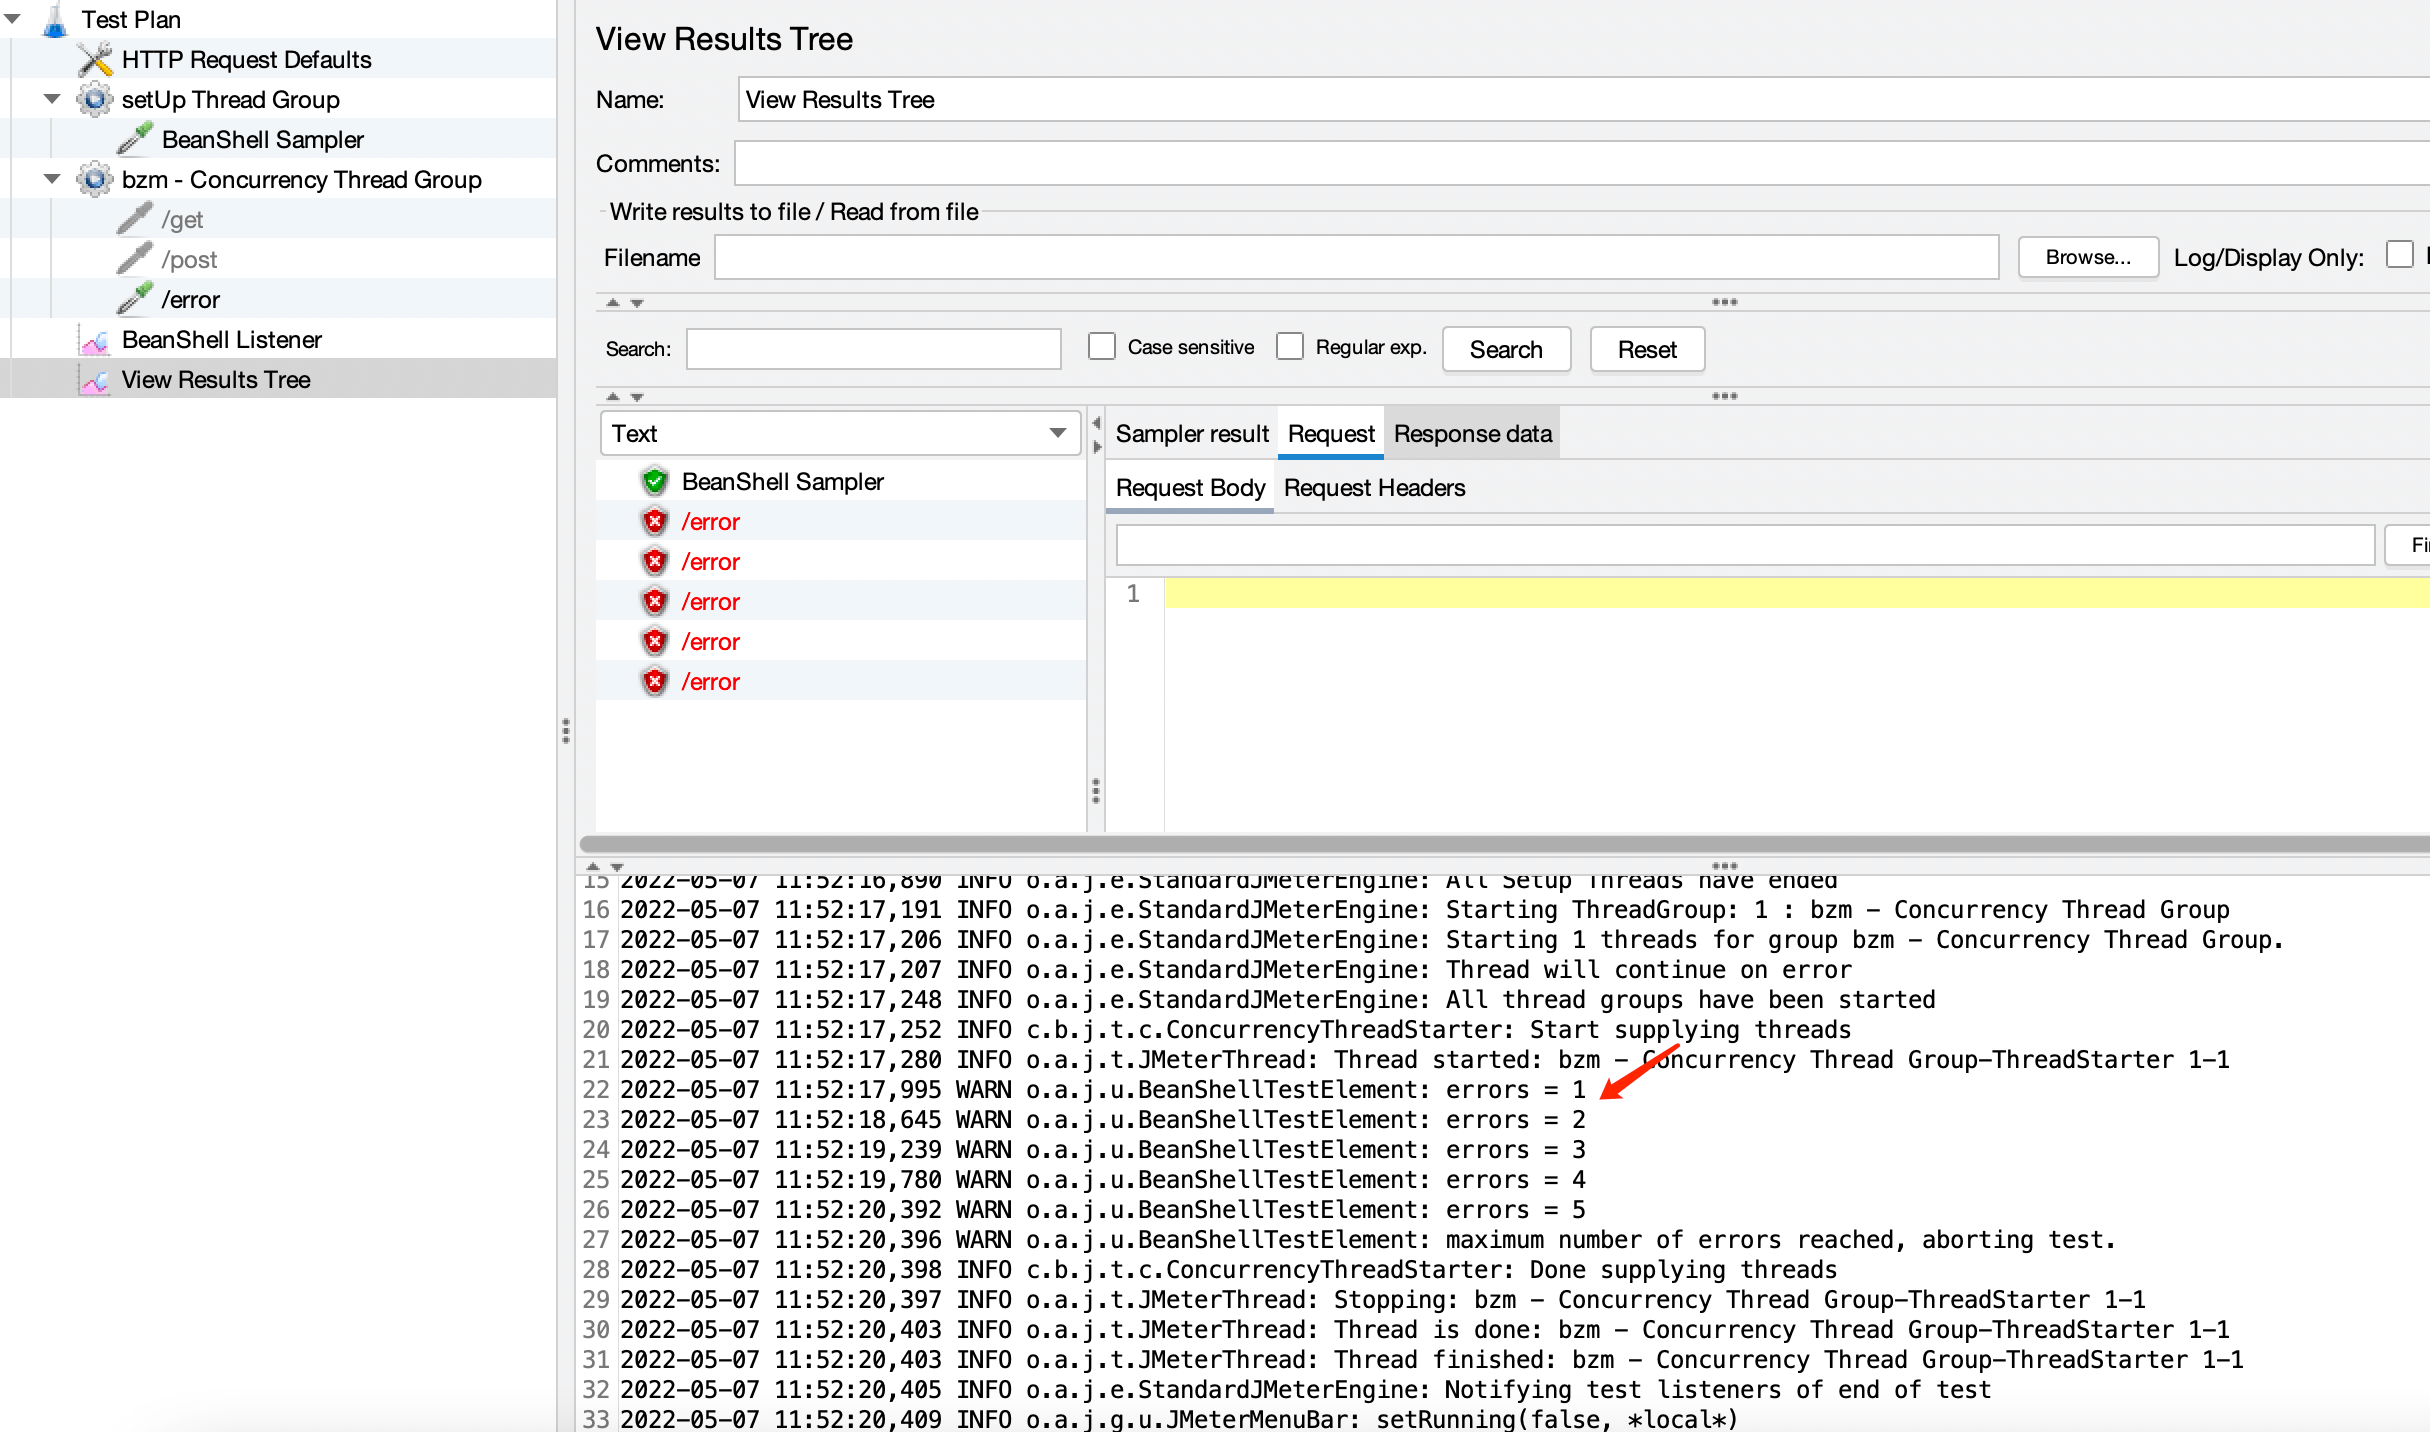
JMeter压测时如何在达到给定错误数量后停止测试
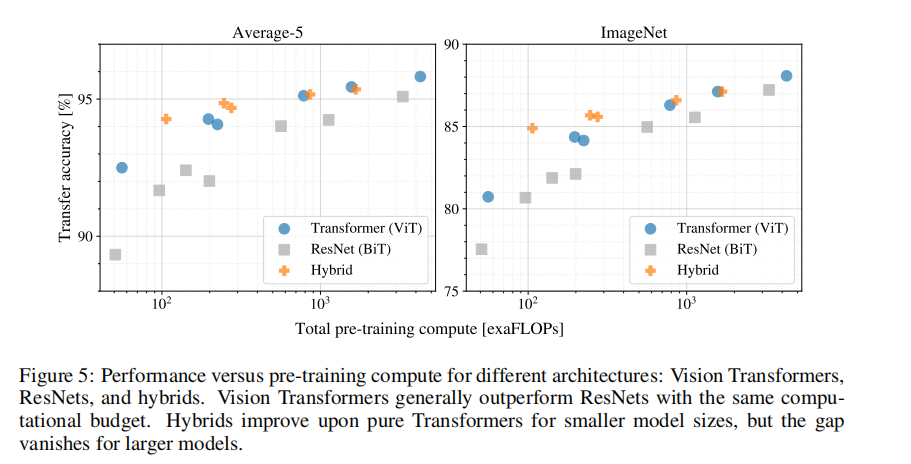
Intensive reading of the paper: VIT - AN IMAGE IS WORTH 16X16 WORDS: TRANSFORMERS FOR IMAGE RECOGNITION AT SCALE
随机推荐
字节二面,差点倒在了MySQL上面
LeetCode笔记:Weekly Contest 305
你应该试着独自做个游戏
五种常用的排序方法
VIT transformer详解
【知识点合辑】numpy常用函数+jupyter小用法
C#/VB.NET: Extract text and pictures from PowerPoint document
Redis很大的时候,key 要如何处理?
Sublime Text的安装过程记录
How to stop the test after reaching a given number of errors during stress testing in JMeter
日本著名设计师三宅一生去世:产品曾被国人高价抢 乔布斯也是粉丝
[免费专栏] Android安全之Android应用的汉化功能(修改so中的字符串内容)
图像处理部分详细目录
WPF 实现带蒙版的 MessageBox 消息提示框
qq机器人账号不能发送群消息,被风控
[免费专栏] Android安全之Xposed插件开发【从零手把手带】教程
MFC教程
Go-Excelize API源码阅读(五)—— Close()
有文章说明或者证明MYSQL 嵌套子查询不足之处吗?
YOLO v3源码详解