当前位置:网站首页>R语言:修改chart.Correlation()函数绘制相关性图——完美出图
R语言:修改chart.Correlation()函数绘制相关性图——完美出图
2022-08-10 05:29:00 【PyGata】
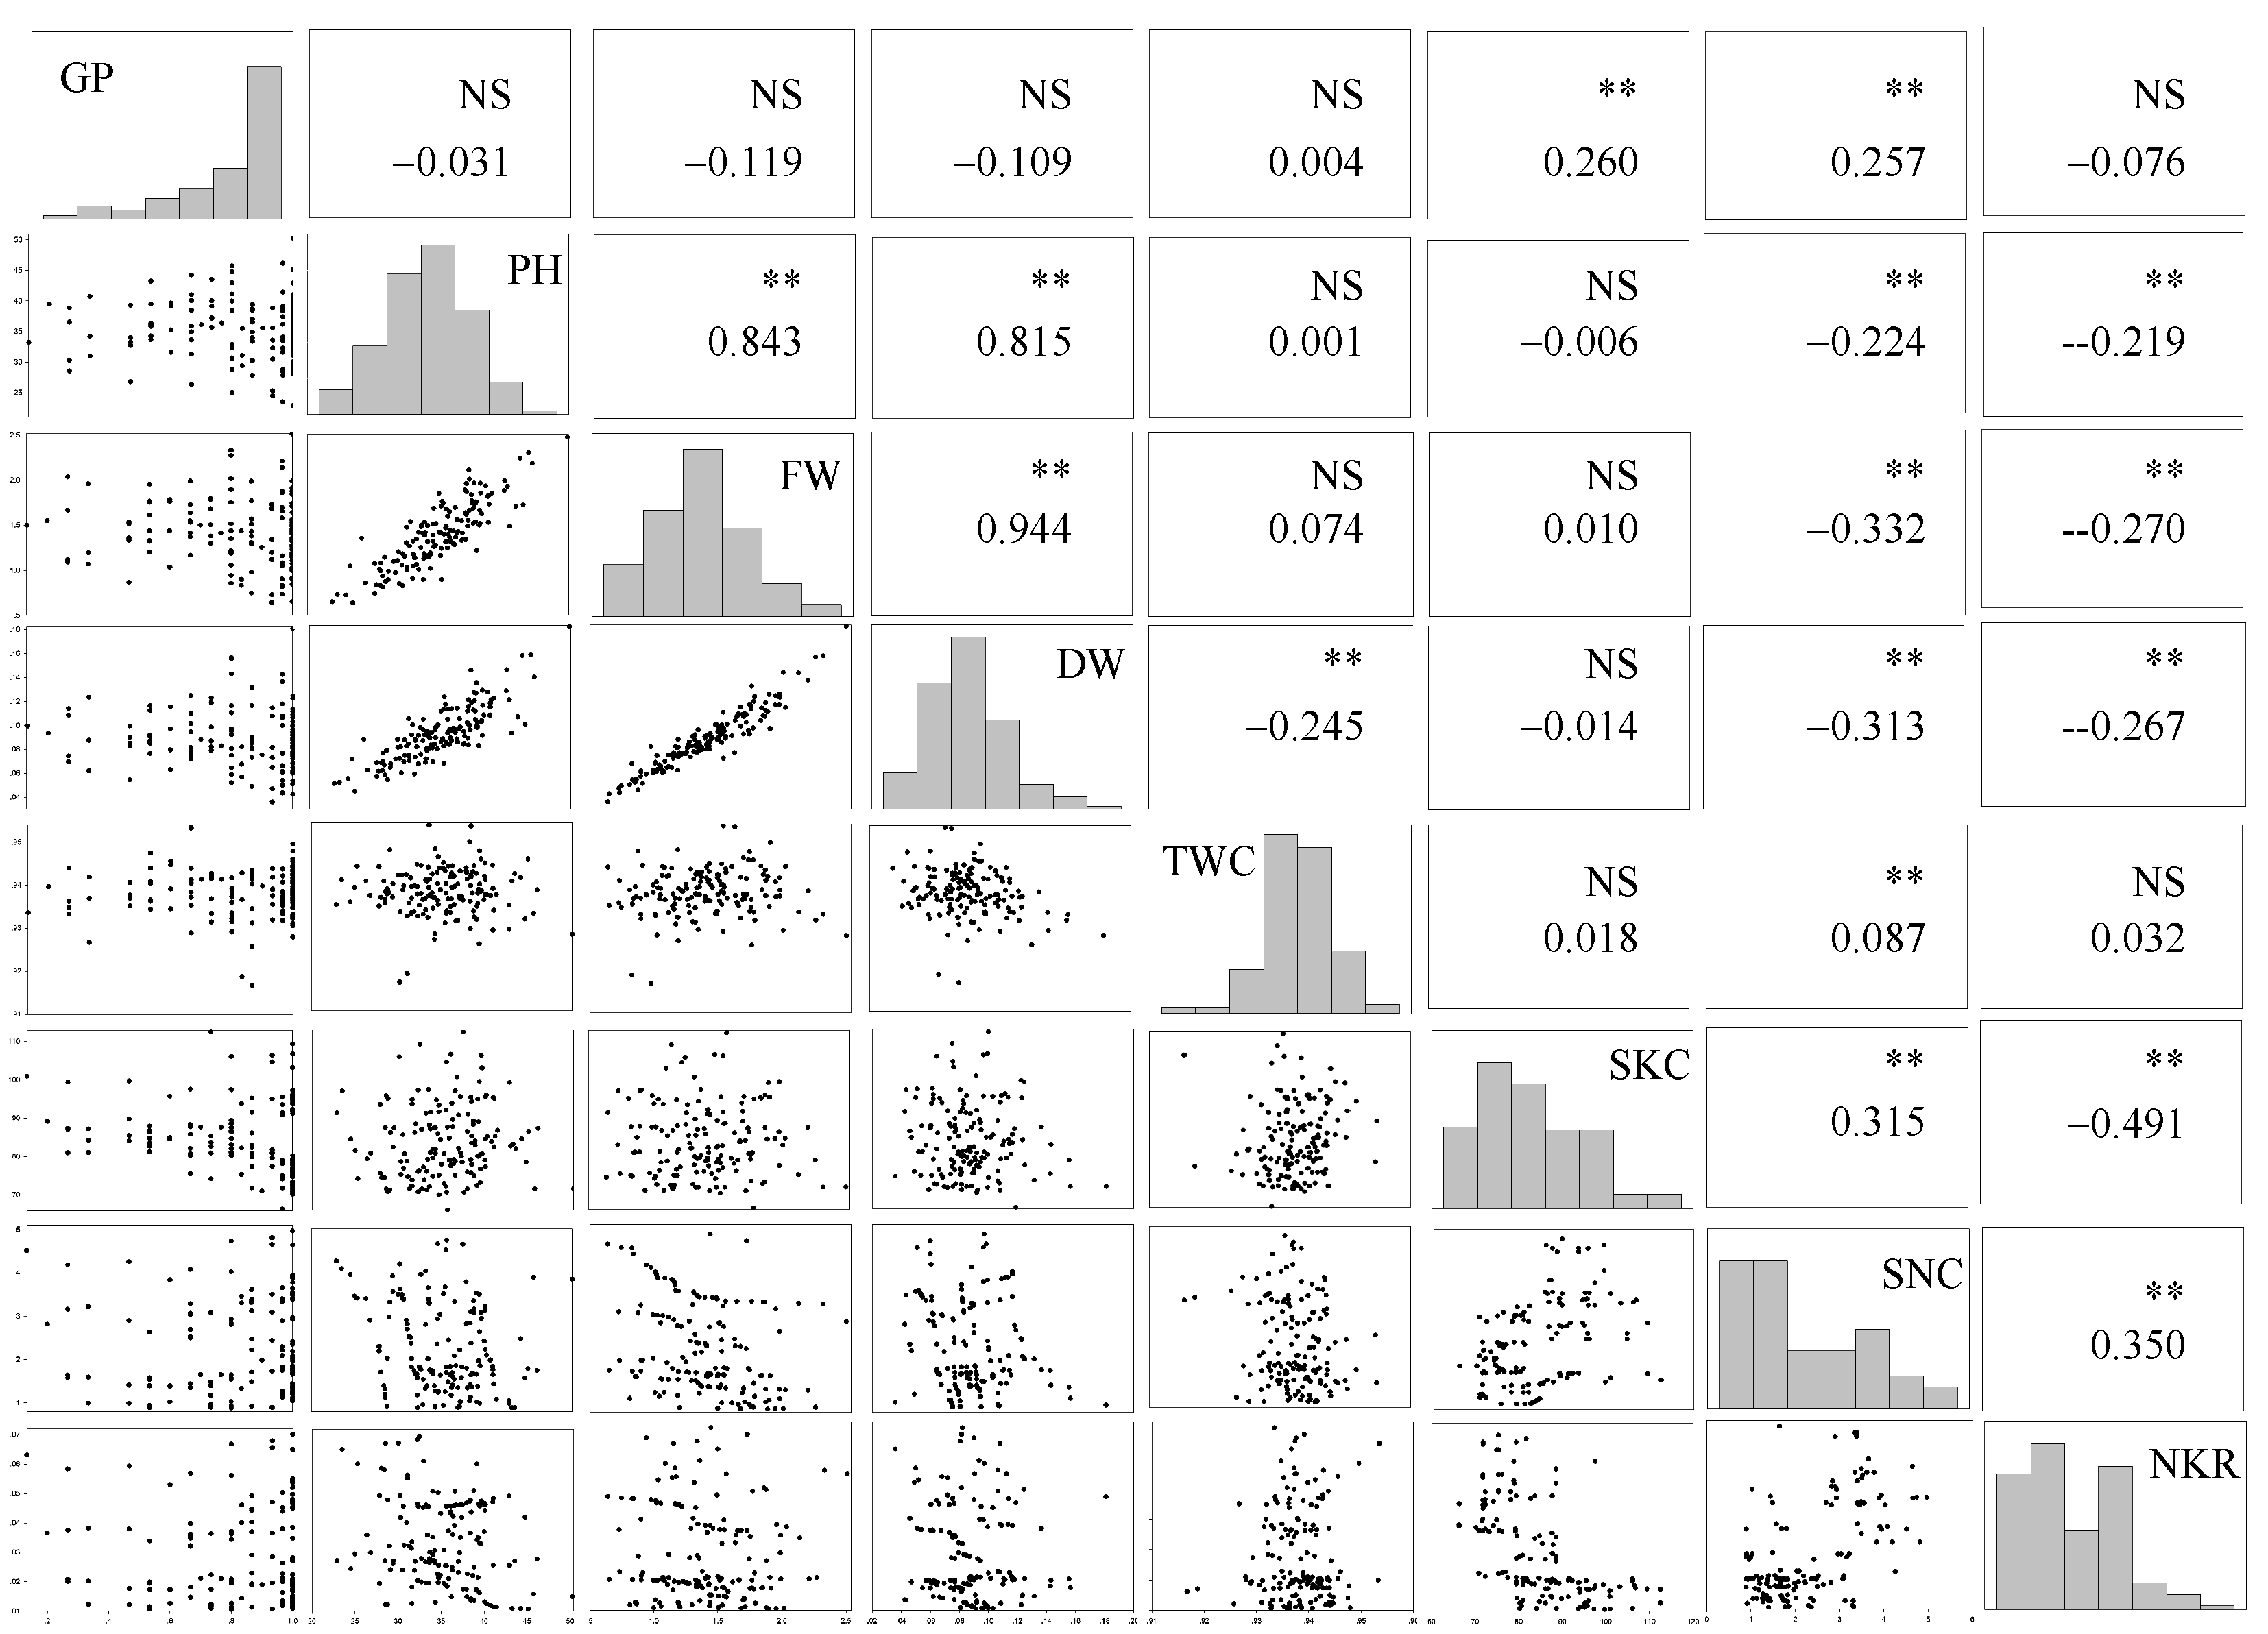
最近,需要对一组数据进行相关性分析,之前用R语言画过热图,但感觉还是不够直观。作为一个小白,干什么都不太成体系,所以就直接搜,搜现成的。于是,找到了这个:相关性分析 | R语言 -- 相关性矩阵及可视化(相关性分析 | R语言 -- 相关性矩阵及可视化 - 简书),感觉这个chart.Correlation()挺不错——直观、简洁,如下图所示。

但,这个函数画的图还是存在一些问题,上三角相关性大小非常自由,需要调整;这下三角散点图符号没有设置透明度,需要修改参数。
之后,又看到这篇文章,相关性分析及可视化R笔记(相关性分析及可视化R笔记 - 简书)
是我想要的效果,很漂亮是吧。
怎么改成这样呢,继续搜索。
那我又看到了这篇文章:六种方法查看R函数源代码,为啥第三种最惹人喜欢(六种方法查看R函数源代码,为啥第三种最惹人喜欢? - 简书)。
我需要上述连接的第三种方法,并进行chart.Correlation()函数的修改。
但是呢,我使用后变成了这个样子,emmm...

算了吧,直接复制粘贴过来改改,放到脚本里面吧,嚯嚯。
上边文章里修改了散点符号和相关系数大小,他的代码是这个样子的。

修改的效果不理想啊,出图还是有问题,但总之有了修改的思路,于是我仔细研读了上图代码,进行了大改。继续搜索呢,我还看到了这个:相关分析矩阵图——字体调整和显著性添加? - R语言论坛 - 经管之家(原人大经济论坛)
以上是2021年1月写的,当时画完图后,忘记继续写博客了,现在是2021年9月,下面补上修改后的代码和运行结果。
以上本质上是一个不懂R语言画图的小白慢慢摸索的过程。
library(PerformanceAnalytics)

mypanel.smooth <- function (x, y, col = par("col"), bg = NA, pch = par("pch"),
          cex = 1, col.smooth = "2", span = 2/3, iter = 3, ...)
  {
        #col=rgb(0, 0, 0, 40, maxColorValue=255) 黑色半透明
        points(x, y, pch = 16, col=rgb(0, 0, 0, 40, maxColorValue=255), bg = bg, cex = cex)
        ok <- is.finite(x) & is.finite(y)
        if (any(ok))
          lines(stats::lowess(x[ok], y[ok], f = span, iter = iter),lwd = 2,
                col = col.smooth, ...)
  }

mychart.Correlation <- function (R, histogram = TRUE, method = c("pearson",
                          "kendall","spearman"), ...)
    {
      x = checkData(R, method = "matrix")
      if (missing(method))
        method = method[1]
      cormeth <- method
      panel.cor <- function(x, y, digits = 2, prefix = "", use = "pairwise.complete.obs",
                            method = cormeth, cex.cor, ...) {
        usr <- par("usr")
        on.exit(par(usr))
        par(usr = c(0, 1, 0, 1))
        r <- cor(x, y, use = use, method = method)
        txt <- format(c(r, 0.123456789), digits = digits)[1]
        txt <- paste(prefix, txt, sep = "")
        if (missing(cex.cor))
          cex <- 4   #字体大小
        test <- cor.test(as.numeric(x), as.numeric(y), method = method)
        Signif <- symnum(test$p.value, corr = FALSE, na = FALSE,
                         cutpoints = c(0, 0.001, 0.01, 0.05, 0.1, 1), symbols = c("***",
                                                                                  "**", "*", ".", " "))
        text(0.5, 0.5, txt, cex = cex * 0.8)
        text(0.8, 0.8, Signif, cex = cex, col = 2)
      }
      f <- function(t) {
        dnorm(t, mean = mean(x), sd = sd.xts(x))
      }
      dotargs <- list(...)
      dotargs$method <- NULL
      rm(method)
      hist.panel = function(x, ... = NULL) {
        par(new = TRUE)
        hist(x, col = "light grey", probability = TRUE, axes = FALSE,
             main = "", breaks = "FD")   #绘制对角线柱状图底部x分布图
        lines(density(x, na.rm = TRUE), col = 2, lwd = 2)
        rug(x)  #rug()是在坐标轴上标出元素出现的频数
      }

      if (histogram)
        pairs(x, gap = 0, lower.panel = mypanel.smooth,  upper.panel = panel.cor,
              diag.panel = hist.panel)
        # pairs(x, gap = 0, lower.panel = mypanel.smooth,upper.panel = panel.cor)
      else pairs(x, gap = 0, lower.panel = mypanel.smooth, upper.panel = panel.cor)
    }
pairs.default <-
function (x, labels, panel = points, ..., horInd = 1:nc, verInd = 1:nc,
lower.panel = panel, upper.panel = panel, diag.panel = NULL,
text.panel = textPanel, label.pos = 0.5 + has.diag/3, line.main = 3,
cex.labels = NULL, font.labels = 1, row1attop = TRUE, gap = 1,
log = "", horOdd = !row1attop, verOdd = !row1attop)
{
if (doText <- missing(text.panel) || is.function(text.panel))
textPanel <- function(x = 0.5, y = 0.5, txt, cex, font)
text(x, y, txt, cex = cex, font = font)
localAxis <- function(side, x, y, xpd, bg, col = NULL, main,
oma, ...) {
xpd <- NA
if (side%%2L == 1L && xl[j])
xpd <- FALSE
if (side%%2L == 0L && yl[i])
xpd <- FALSE
if (side%%2L == 1L)
Axis(x, side = side, xpd = xpd, ...)
else Axis(y, side = side, xpd = xpd, ...)
}
localPlot <- function(..., main, oma, font.main, cex.main) plot(...)
localLowerPanel <- function(..., main, oma, font.main, cex.main) lower.panel(...)
localUpperPanel <- function(..., main, oma, font.main, cex.main) upper.panel(...)
localDiagPanel <- function(..., main, oma, font.main, cex.main) diag.panel(...)
dots <- list(...)
nmdots <- names(dots)
if (!is.matrix(x)) {
x <- as.data.frame(x)
for (i in seq_along(names(x))) {
if (is.factor(x[[i]]) || is.logical(x[[i]]))
x[[i]] <- as.numeric(x[[i]])
if (!is.numeric(unclass(x[[i]])))
stop("non-numeric argument to 'pairs'")
}
}
else if (!is.numeric(x))
stop("non-numeric argument to 'pairs'")
panel <- match.fun(panel)
if ((has.lower <- !is.null(lower.panel)) && !missing(lower.panel))
lower.panel <- match.fun(lower.panel)
if ((has.upper <- !is.null(upper.panel)) && !missing(upper.panel))
upper.panel <- match.fun(upper.panel)
if ((has.diag <- !is.null(diag.panel)) && !missing(diag.panel))
diag.panel <- match.fun(diag.panel)
if (row1attop) {
tmp <- lower.panel
lower.panel <- upper.panel
upper.panel <- tmp
tmp <- has.lower
has.lower <- has.upper
has.upper <- tmp
}
nc <- ncol(x)
if (nc < 2L)
stop("only one column in the argument to 'pairs'")
if (!all(1L <= horInd & horInd <= nc))
stop("invalid argument 'horInd'")
if (!all(1L <= verInd & verInd <= nc))
stop("invalid argument 'verInd'")
if (doText) {
if (missing(labels)) {
labels <- colnames(x)
if (is.null(labels))
labels <- paste("var", 1L:nc)
}
else if (is.null(labels))
doText <- FALSE
}
oma <- if ("oma" %in% nmdots)
dots$oma
main <- if ("main" %in% nmdots)
dots$main
if (is.null(oma))
oma <- c(4, 4, if (!is.null(main)) 6 else 4, 4)
opar <- par(mfcol = c(length(horInd), length(verInd)), mar = rep.int(gap/2,
4), oma = oma)
on.exit(par(opar))
dev.hold()
on.exit(dev.flush(), add = TRUE)
xl <- yl <- logical(nc)
if (is.numeric(log))
xl[log] <- yl[log] <- TRUE
else {
xl[] <- grepl("x", log)
yl[] <- grepl("y", log)
}
ni <- length(iSet <- if (row1attop) horInd else rev(horInd))
nj <- length(jSet <- verInd)
for (j in jSet) for (i in iSet) {
l <- paste0(if (xl[j])
"x"
else "", if (yl[i])
"y"
else "")
localPlot(x[, j], x[, i], xlab = "", ylab = "", axes = FALSE,
type = "n", ..., log = l)
if (i == j || (i < j && has.lower) || (i > j && has.upper)) {
box()
j.odd <- (match(j, jSet) + horOdd)%%2L
i.odd <- (match(i, iSet) + verOdd)%%2L
if (i == iSet[1L] && (!j.odd || !has.upper || !has.lower))
localAxis(3L, x[, j], x[, i], ...)
if (i == iSet[ni] && (j.odd || !has.upper || !has.lower))
localAxis(1L, x[, j], x[, i], ...)
if (j == jSet[1L] && (!i.odd || !has.upper || !has.lower))
localAxis(2L, x[, j], x[, i], ...)
if (j == jSet[nj] && (i.odd || !has.upper || !has.lower))
localAxis(4L, x[, j], x[, i], ...)
mfg <- par("mfg")
if (i == j) {
if (has.diag)
localDiagPanel(as.vector(x[, i]), ...)
if (doText) {
par(usr = c(0, 1, 0, 1))
if (is.null(cex.labels)) {
l.wid <- strwidth(labels, "user")
cex.labels <- max(0.8, min(2, 0.9/max(l.wid)))*1.5
}
xlp <- if (xl[i])
10^0.2
else 0.8
ylp <- if (yl[j])
10^label.pos
else label.pos
text.panel(xlp, ylp, labels[i], cex = cex.labels,
font = font.labels)
}
}
else if (i < j)
localLowerPanel(as.vector(x[, j]), as.vector(x[,
i]), ...)
else localUpperPanel(as.vector(x[, j]), as.vector(x[,
i]), ...)
if (any(par("mfg") != mfg))
stop("the 'panel' function made a new plot")
}
else par(new = FALSE)
}
if (!is.null(main)) {
font.main <- if ("font.main" %in% nmdots)
dots$font.main
else par("font.main")
cex.main <- if ("cex.main" %in% nmdots)
dots$cex.main
else par("cex.main")
mtext(main, 3, line.main, outer = TRUE, at = 0.5, cex = cex.main,
font = font.main)
}
invisible(NULL)
}
边栏推荐
- When oracle cdc, set the parallelism to 2 and the number of slots to 1, and the final task has only one tm. Is it because oracle does not support concurrency
- WSTP初体验
- FPGA工程师面试试题集锦11~20
- pytorch框架学习(3)torch.nn.functional模块和nn.Module模块
- 栈与队列 | 用栈实现队列 | 用队列实现栈 | 基础理论与代码原理
- MySql之json_extract函数处理json字段
- Pulsar中游标的工作原理
- [Thesis Notes] Prototypical Contrast Adaptation for Domain Adaptive Semantic Segmentation
- 论文精度 —— 2017 ACM《Globally and Locally Consistent Image Completion》
- MySQL simple tutorial
猜你喜欢

基于Qiskit——《量子计算编程实战》读书笔记(七)

strongest brain (1)

Order table delete, insert and search operations

基于Qiskit——《量子计算编程实战》读书笔记(三)

Get started with the OAuth protocol easily with a case

EasyGBS connects to mysql database and prompts "can't connect to mysql server", how to solve it?
基于Qiskit——《量子计算编程实战》读书笔记(一)

Pulsar中游标的工作原理

一文带你搞懂OAuth2.0

Qiskit官方文档选译之量子傅里叶变换(Quantum Fourier Transform, QFT)
随机推荐
基于Qiskit——《量子计算编程实战》读书笔记(一)
pytorch框架学习(5)torchvision模块&训练一个简单的自己的CNN (二)
mysql cdc (2.1.1)inital snapshot数据库的时候设置了5个并发度,se
GtkD开发之路
The time for flinkcdc to read pgsql is enlarged. Does anyone know what happened? gmt_create':1
pytorch learning
Concurrency tool class - introduction and use of CountDownLatch, CyclicBarrier, Semaphore, Exchanger
Interface documentation evolution illustration, some ancient interface documentation tools, you may not have used it
pytorch 学习
Matlab simulation of multi-factor house price prediction based on BP neural network
scikit-learn机器学习 读书笔记(一)
MongoDB 基础了解(一)
顺序表的删除,插入和查找操作
pytorch框架学习(2)使用GPU训练
Nexus_Warehouse Type
SQL Server query optimization
aliases节点分析
深度梳理:防止模型过拟合的方法汇总
反转链表中的第m至第n个节点---leetcode
AVL树的插入--旋转笔记