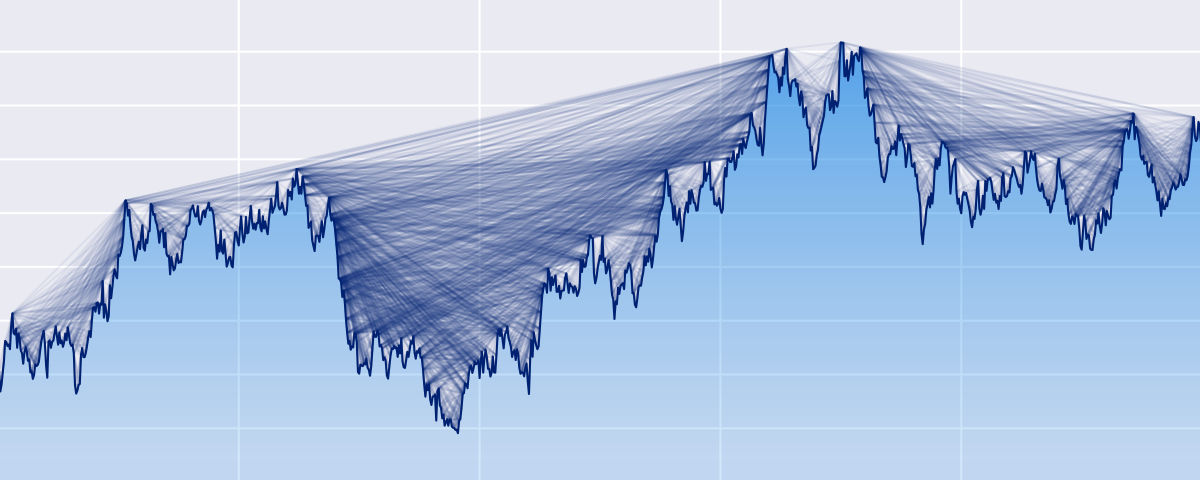
Python ts2vg package provides high-performance algorithm implementations to build visibility graphs from time series data.

Overview

ts2vg: Time series to visibility graphs

pypi pyversions wheel license

Example plot of a visibility graph


The Python ts2vg package provides high-performance algorithm implementations to build visibility graphs from time series data.

The visibility graphs and some of their properties (e.g. degree distributions) are computed quickly and efficiently, even for time series with millions of observations thanks to the use of NumPy and a custom C backend (via Cython) developed for the visibility algorithms.

The visibility graphs are provided according to the mathematical definitions described in:

  • Lucas Lacasa et al., "From time series to complex networks: The visibility graph", 2008.
  • Lucas Lacasa et al., "Horizontal visibility graphs: exact results for random time series", 2009.

An efficient divide-and-conquer algorithm is used to compute the graphs, as described in:

  • Xin Lan et al., "Fast transformation from time series to visibility graphs", 2015.

Installation

The latest released ts2vg version is available at the Python Package Index (PyPI) and can be easily installed by running:

pip install ts2vg

For other advanced uses, to build ts2vg from source Cython is required.

Basic usage

Visibility graph

Building visibility graphs from time series is very simple:

from ts2vg import NaturalVG

ts = [1.0, 0.5, 0.3, 0.7, 1.0, 0.5, 0.3, 0.8]

g = NaturalVG()
g.build(ts)

edges = g.edges

The time series passed can be a list, a tuple, or a numpy 1D array.

Horizontal visibility graph

We can also obtain horizontal visibility graphs in a very similar way:

from ts2vg import HorizontalVG

ts = [1.0, 0.5, 0.3, 0.7, 1.0, 0.5, 0.3, 0.8]

g = HorizontalVG()
g.build(ts)

edges = g.edges

Degree distribution

If we are only interested in the degree distribution of the visibility graph we can pass only_degrees=True to the build method. This will be more efficient in time and memory than computing the whole graph.

g = NaturalVG()
g.build(ts, only_degrees=True)

ks, ps = g.degree_distribution

Directed visibility graph

g = NaturalVG(directed='left_to_right')
g.build(ts)

Weighted visibility graph

g = NaturalVG(weighted='distance')
g.build(ts)

For more information and options see: Examples and API Reference.

Interoperability with other libraries

The graphs obtained can be easily converted to graph objects from other common Python graph libraries such as igraph, NetworkX and SNAP for further analysis.

The following methods are provided:

  • as_igraph()
  • as_networkx()
  • as_snap()

For example:

g = NaturalVG()
g.build(ts)

nx_g = g.as_networkx()

Command line interface

ts2vg can also be used as a command line program directly from the console:

ts2vg ./timeseries.txt -o out.edg

For more help and a list of options run:

ts2vg --help

Contributing

ts2vg can be found on GitHub. Pull requests and issue reports are welcome.

License

ts2vg is licensed under the terms of the MIT License.

You might also like...
The Spectral Diagram (SD) is a new tool for the comparison of time series in the frequency domain

The Spectral Diagram (SD) is a new tool for the comparison of time series in the frequency domain. The SD provides a novel way to display the coherence function, power, amplitude, phase, and skill score of discrete frequencies of two time series. Each SD summarises these quantities in a single plot for multiple targeted frequencies.

The windML framework provides an easy-to-use access to wind data sources within the Python world, building upon numpy, scipy, sklearn, and matplotlib. Renewable Wind Energy, Forecasting, Prediction

windml Build status : The importance of wind in smart grids with a large number of renewable energy resources is increasing. With the growing infrastr

Kglab - an abstraction layer in Python for building knowledge graphs

Graph Data Science: an abstraction layer in Python for building knowledge graphs, integrated with popular graph libraries – atop Pandas, RDFlib, pySHACL, RAPIDS, NetworkX, iGraph, PyVis, pslpython, pyarrow, etc.

Extensible, parallel implementations of t-SNE

openTSNE openTSNE is a modular Python implementation of t-Distributed Stochasitc Neighbor Embedding (t-SNE) [1], a popular dimensionality-reduction al

Extensible, parallel implementations of t-SNE

openTSNE openTSNE is a modular Python implementation of t-Distributed Stochasitc Neighbor Embedding (t-SNE) [1], a popular dimensionality-reduction al

Graphical display tools, to help students debug their class implementations in the Carcassonne family of projects

carcassonne_tools Graphical display tools, to help students debug their class implementations in the Carcassonne family of projects NOTE NOTE NOTE The

Draw interactive NetworkX graphs with Altair

nx_altair Draw NetworkX graphs with Altair nx_altair offers a similar draw API to NetworkX but returns Altair Charts instead. If you'd like to contrib

Draw interactive NetworkX graphs with Altair

nx_altair Draw NetworkX graphs with Altair nx_altair offers a similar draw API to NetworkX but returns Altair Charts instead. If you'd like to contrib

Generate graphs with NetworkX, natively visualize with D3.js and pywebview

webview_d3 This is some PoC code to render graphs created with NetworkX natively using D3.js and pywebview. The main benifit of this approac

Comments
  • help getting started

    help getting started

    I am playing around with ts2vg and I am having a hard time with the plotting using igraph. I try to compute the natural vg for a short time series, but when trying to plot it I get this error:

    Traceback (most recent call last):
      File "\anaconda3\envs\DK_01\lib\site-packages\IPython\core\interactiveshell.py", line 3398, in run_code
        exec(code_obj, self.user_global_ns, self.user_ns)
      File "<ipython-input-1-9a1fdcf342e8>", line 1, in <cell line: 1>
        ig.plot(nx_g, target='graph.pdf')
      File "\anaconda3\envs\DK_01\lib\site-packages\igraph\drawing\__init__.py", line 512, in plot
        result.save()
      File "\anaconda3\envs\DK_01\lib\site-packages\igraph\drawing\__init__.py", line 309, in save
        self._ctx.show_page()
    igraph.drawing.cairo.MemoryError: out of memory
    

    The file created is corrupted.

    Here is my code:

    import numpy as np
    from ts2vg import NaturalVG
    import igraph as ig
    
    import matplotlib.pyplot as plt
    
    # time domain
    t = np.linspace(1, 40)
    dt = np.diff(t)
    
    # build series
    x1 = np.sin(2*np.pi/10*t)
    x2 = np.sin(2*np.pi/15*t)
    
    y = x1 + x2
    
    plt.plot(t, y, '.-')
    plt.show()
    
    # build HVG
    g = NaturalVG()
    g.build(y)
    
    nx_g = g.as_igraph()
    
    # plotting
    ig.plot(nx_g, target='graph.pdf')
    

    I am using ts2vg 1.0.0, igraph 0.9.11, and pycairo 1.21.0

    opened by ACatAC 1
Releases(v1.0.0)
Quickly and accurately render even the largest data.

Turn even the largest data into images, accurately Build Status Coverage Latest dev release Latest release Docs Support What is it? Datashader is a da

HoloViz 2.9k Dec 28, 2022
Example Code Notebooks for Data Visualization in Python

This repository contains sample code scripts for creating awesome data visualizations from scratch using different python libraries (such as matplotli

Javed Ali 27 Jan 04, 2023
This is a place where I'm playing around with pandas to analyze data in a csv/excel file.

pandas-csv-excel-analysis This is a place where I'm playing around with pandas to analyze data in a csv/excel file. 0-start A very simple cheat sheet

Chuqin 3 Oct 05, 2022
Python & Julia port of codes in excellent R books

X4DS This repo is a collection of Python & Julia port of codes in the following excellent R books: An Introduction to Statistical Learning (ISLR) Stat

Gitony 5 Jun 21, 2022
Pydrawer: The Python package for visualizing curves and linear transformations in a super simple way

pydrawer 📐 The Python package for visualizing curves and linear transformations in a super simple way. ✏️ Installation Install pydrawer package with

Dylan Tintenfich 56 Dec 30, 2022
erdantic is a simple tool for drawing entity relationship diagrams (ERDs) for Python data model classes

erdantic is a simple tool for drawing entity relationship diagrams (ERDs) for Python data model classes. Diagrams are rendered using the venerable Graphviz library.

DrivenData 129 Jan 04, 2023
Generate a 3D Skyline in STL format and a OpenSCAD file from Gitlab contributions

Your Gitlab's contributions in a 3D Skyline gitlab-skyline is a Python command to generate a skyline figure from Gitlab contributions as Github did at

Félix Gómez 70 Dec 22, 2022
View part of your screen in grayscale or simulated color vision deficiency.

monolens View part of your screen in grayscale or filtered to simulate color vision deficiency. Watch the demo on YouTube. Install with pip install mo

Hans Dembinski 31 Oct 11, 2022
BrowZen correlates your emotional states with the web sites you visit to give you actionable insights about how you spend your time browsing the web.

BrowZen BrowZen correlates your emotional states with the web sites you visit to give you actionable insights about how you spend your time browsing t

Nick Bild 36 Sep 28, 2022
🐍PyNode Next allows you to easily create beautiful graph visualisations and animations

PyNode Next A complete rewrite of PyNode for the modern era. Up to five times faster than the original PyNode. PyNode Next allows you to easily create

ehne 3 Feb 12, 2022
a plottling library for python, based on D3

Hello August 2013 Hello! Maybe you're looking for a nice Python interface to build interactive, javascript based plots that look as nice as all those

Mike Dewar 1.4k Dec 28, 2022
Schema validation for Xarray objects

xarray-schema Schema validation for Xarray installation This package is in the early stages of development. Install it from source: pip install git+gi

carbonplan 22 Oct 31, 2022
649 Pokémon palettes as CSVs, with a Python lib to turn names/IDs into palettes, or MatPlotLib compatible ListedColormaps.

PokePalette 649 Pokémon, broken down into CSVs of their RGB colour palettes. Complete with a Python library to convert names or Pokédex IDs into eithe

11 Dec 05, 2022
1900-2016 Olympic Data Analysis in Python by plotting different graphs

🔥 Olympics Data Analysis 🔥 In Data Science field, there is a big topic before creating a model for future prediction is Data Analysis. We can find o

Sayan Roy 1 Feb 06, 2022
Data-FX is an addon for Blender (2.9) that allows for the visualization of data with different charts

Data-FX Data-FX is an addon for Blender (2.9) that allows for the visualization of data with different charts Currently, there are only 2 chart option

Landon Ferguson 20 Nov 21, 2022
The official colors of the FAU as matplotlib/seaborn colormaps

FAU - Colors The official colors of Friedrich-Alexander-Universität Erlangen-Nürnberg (FAU) as matplotlib / seaborn colormaps. We support the old colo

Machine Learning and Data Analytics Lab FAU 9 Sep 05, 2022
GUI for visualization and interactive editing of SMPL-family body models ie. SMPL, SMPL-X, MANO, FLAME.

Body Model Visualizer Introduction This is a simple Open3D-based GUI for SMPL-family body models. This GUI lets you play with the shape, expression, a

Muhammed Kocabas 207 Jan 01, 2023
Area-weighted venn-diagrams for Python/matplotlib

Venn diagram plotting routines for Python/Matplotlib Routines for plotting area-weighted two- and three-circle venn diagrams. Installation The simples

Konstantin Tretyakov 400 Dec 31, 2022
LabGraph is a a Python-first framework used to build sophisticated research systems with real-time streaming, graph API, and parallelism.

LabGraph is a a Python-first framework used to build sophisticated research systems with real-time streaming, graph API, and parallelism.

MLH Fellowship 7 Oct 05, 2022
Python package to Create, Read, Write, Edit, and Visualize GSFLOW models

pygsflow pyGSFLOW is a python package to Create, Read, Write, Edit, and Visualize GSFLOW models API Documentation pyGSFLOW API documentation can be fo

pyGSFLOW 21 Dec 14, 2022