YOPO is an interactive dashboard which generates various standard plots.

Overview

YOPO (You Only Plot Once)

Python Plotly Flask

You Only Plot Once

YOPO is an interactive dashboard which generates various standard plots.you can create various graphs and charts with a click of a button. This tool uses Dash and Flask in backend.

Table of contents

Installing YOPO

To install from PyPi:

pip install yopo

To install from source:

cd <your_project>
git clone https://github.com/chekoduadarsh/YOPO-You-Only-Plot-Once.git
# or download and unzip https://github.com/AutoViML/AutoViz/archive/master.zip
# if you dont have virtualenv install from here https://packaging.python.org/en/latest/guides/installing-using-pip-and-virtual-environments/
python3 -m venv env
source env/bin/activate
git clone https://github.com/chekoduadarsh/YOPO-You-Only-Plot-Once.git
# or download and unzip https://github.com/AutoViML/AutoViz/archive/master.zip
cd yopo
python3 -m pip install .

Usage

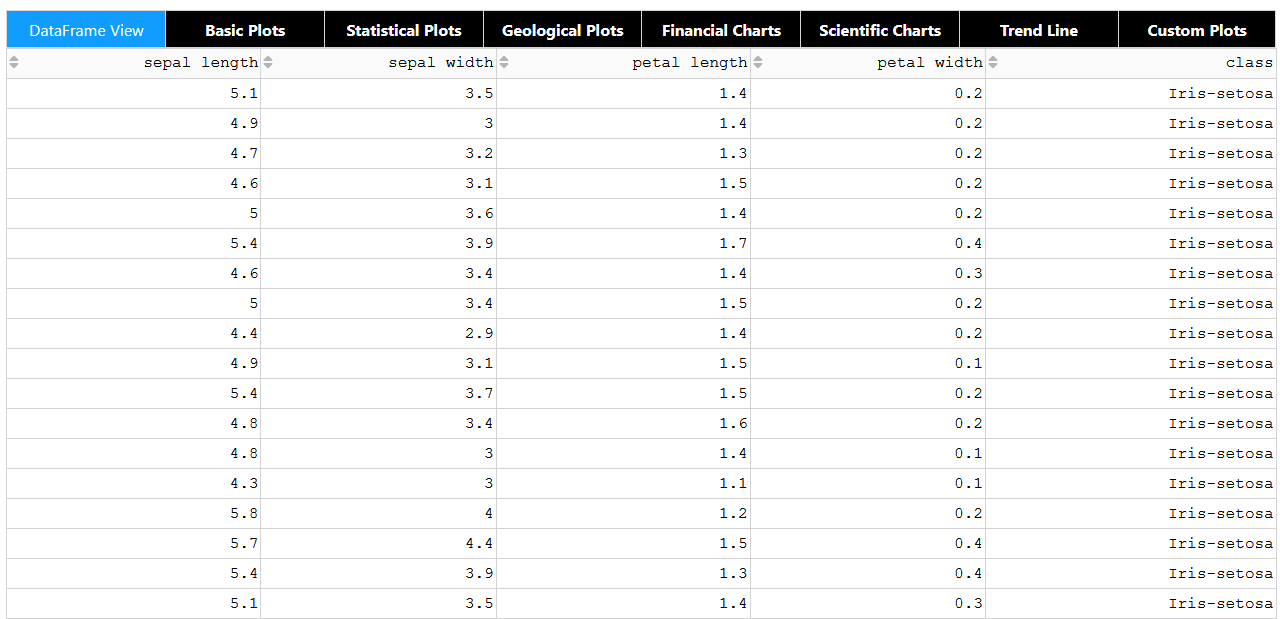
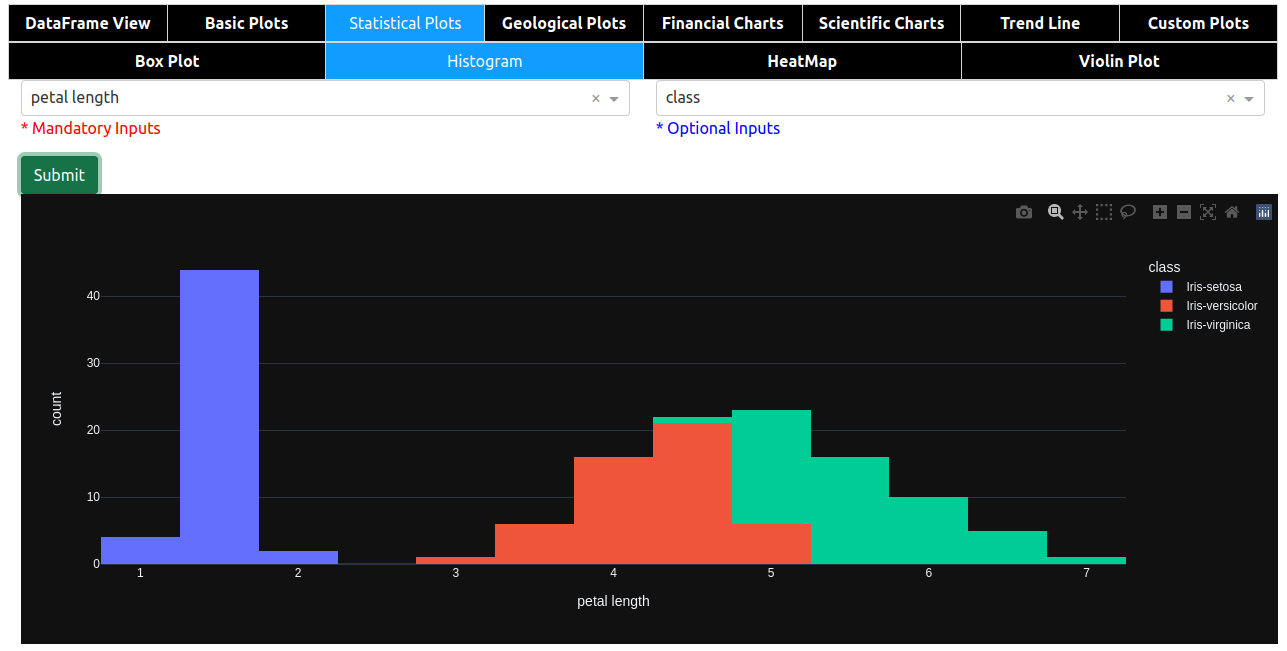
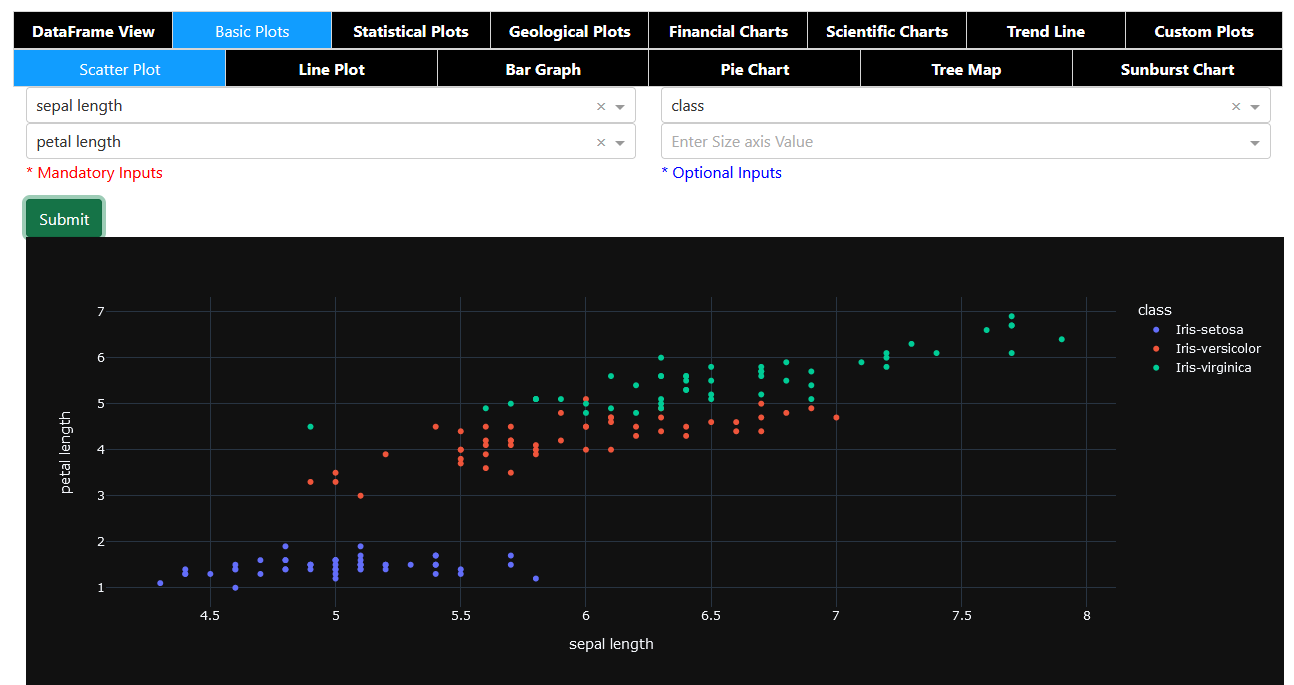
its very easy to use YOPO, u just need to pass the dataframe and it will generate the dashboard.

A code like this will generate multiple plots like given below.

Contribute

If you find any error or need support please raise a issue. If you think you can add a feature, or help solve a bug please raise a PR This repo welcomes any kind of contributions pray

Feel free to adapt it criticize it and support it the way you like!!

License

Apache License, Version 2.0

You might also like...
This package creates clean and beautiful matplotlib plots that work on light and dark backgrounds

This package creates clean and beautiful matplotlib plots that work on light and dark backgrounds. Inspired by the work of Edward Tufte.

Moscow DEG 2021 elections plots

Построение графиков на основе публичных данных о ДЭГ в Москве в 2021г. Описание Скрипты в данном репозитории позволяют собственноручно построить графи

This plugin plots the time you spent on a tag as a histogram.

This plugin plots the time you spent on a tag as a histogram.

A minimal Python package that produces slice plots through h5m DAGMC geometry files

A minimal Python package that produces slice plots through h5m DAGMC geometry files Installation pip install dagmc_geometry_slice_plotter Python API U

MPL Plotter is a Matplotlib based Python plotting library built with the goal of delivering publication-quality plots concisely.

MPL Plotter is a Matplotlib based Python plotting library built with the goal of delivering publication-quality plots concisely.

Generate
Generate "Jupiter" plots for circular genomes

jupiter Generate "Jupiter" plots for circular genomes Description Python scripts to generate plots from ViennaRNA output. Written in "pidgin" python w

A Python function that makes flower plots.

Flower plot A Python 3.9+ function that makes flower plots. Installation This package requires at least Python 3.9. pip install

Standardized plots and visualizations in Python

Standardized plots and visualizations in Python pltviz is a Python package for standardized visualization. Routine and novel plotting approaches are f

The plottify package is makes matplotlib plots more legible

plottify The plottify package is makes matplotlib plots more legible. It's a thin wrapper around matplotlib that automatically adjusts font sizes, sca

Comments
  • Add predefined palettes as dropdown.

    Add predefined palettes as dropdown.

    Is your feature request related to a problem? An enhancement: to give the possibility to choose a color palette from a dropdown menu.

    There are too many predefined palettes at [https://plotly.com/python/builtin-colorscales/](https://plotly.com/python/builtin-colorscales/, and the menu would become too long), so a dozen should be enough.

    As a palette list I would consider:

    • Viridis
    • Magma
    • Turbo
    • Bluered
    • Hot
    • RdBu
    • YlOrRd
    • Thermal
    • Agsunset
    • Balance
    • Portland
    • Edge

    If the dropdown menu shows the palette colors (each image can be downloaded from the page) together with the name, it becomes very intuitive.

    enhancement 
    opened by Nemecsek 4
  • Give the possibility to add extra parameters.

    Give the possibility to add extra parameters.

    Is your feature request related to a problem? I am using Histograms, but the number of bins is automatic and cannot be changed. Other plot types can be optimized by adding extra parameters (i.e. to change the size of scatterplots' markers).

    Describe the solution you'd like Of course it is not possible to add parameters according to every users' needs.

    The easiest solution is to give the possibility to enter extra params into an edit box such as: Screenshot_20220218_092905

    This string can be transformed into a dictionary with eval(f'dict({ edit_box_content })'), and the dictionary then added to the plots' parameters.

    enhancement 
    opened by Nemecsek 2
  • Dataframe's index is missing among the selectable fields in X axis

    Dataframe's index is missing among the selectable fields in X axis

    As for the title, it is not possible to directly select the (unnamed) index among the X axis fields. Index is the most obvious choice for Y axis in Scatter, Line, etc.

    opened by Nemecsek 0
  • Let multiple series to be visualized in a single plot.

    Let multiple series to be visualized in a single plot.

    In Scatter, Line, Bar (and possibly other plots) it would be nice to visualize multiple series on the same figure. This would mean to select not only a single Y axis value, but to allow multiple selections (at least one).

    To keep things simple, I would draw all of them on the same figure, avoiding at the moment to provide sub figures.

    enhancement 
    opened by Nemecsek 1
Releases(alpha)
  • alpha(Feb 15, 2022)

Owner
ADARSH C
Python | Machine Learning | Deep Learning | Flask | mongodb | Embedded systems
ADARSH C
Smoking Simulation is an app to simulate the spreading of smokers and non-smokers, their interactions and population during certain amount of time.

Smoking Simulation is an app to simulate the spreading of smokers and non-smokers, their interactions and population during certain

Bohdan Ruban 5 Nov 08, 2022
A tool to plot and execute Rossmos's Formula, that helps to catch serial criminals using mathematics

Rossmo Plotter A tool to plot and execute Rossmos's Formula using python, that helps to catch serial criminals using mathematics Author: Amlan Saha Ku

Amlan Saha Kundu 3 Aug 29, 2022
Python package for the analysis and visualisation of finite-difference fields.

discretisedfield Marijan Beg1,2, Martin Lang2, Samuel Holt3, Ryan A. Pepper4, Hans Fangohr2,5,6 1 Department of Earth Science and Engineering, Imperia

ubermag 12 Dec 14, 2022
1900-2016 Olympic Data Analysis in Python by plotting different graphs

🔥 Olympics Data Analysis 🔥 In Data Science field, there is a big topic before creating a model for future prediction is Data Analysis. We can find o

Sayan Roy 1 Feb 06, 2022
Tidy data structures, summaries, and visualisations for missing data

naniar naniar provides principled, tidy ways to summarise, visualise, and manipulate missing data with minimal deviations from the workflows in ggplot

Nicholas Tierney 611 Dec 22, 2022
Statistical data visualization using matplotlib

seaborn: statistical data visualization Seaborn is a Python visualization library based on matplotlib. It provides a high-level interface for drawing

Michael Waskom 10.2k Dec 30, 2022
Bioinformatics tool for exploring RNA-Protein interactions

Explore RNA-Protein interactions. RNPFind is a bioinformatics tool. It takes an RNA transcript as input and gives a list of RNA binding protein (RBP)

Nahin Khan 3 Jan 27, 2022
Calendar heatmaps from Pandas time series data

Note: See MarvinT/calmap for the maintained version of the project. That is also the version that gets published to PyPI and it has received several f

Martijn Vermaat 195 Dec 22, 2022
DrawBot lets you draw images taken from the internet on Skribbl.io, Gartic Phone and Paint

DrawBot You don't speak french? No worries, english translation is over here. C'est quoi ? DrawBot est un logiciel codé par V2F qui va prendre possess

V2F 205 Jan 01, 2023
Simple and lightweight Spotify Overlay written in Python.

Simple Spotify Overlay This is a simple yet powerful Spotify Overlay. About I have been looking for something like this ever since I got Spotify. I th

27 Sep 03, 2022
100 data puzzles for pandas, ranging from short and simple to super tricky (60% complete)

100 pandas puzzles Puzzles notebook Solutions notebook Inspired by 100 Numpy exerises, here are 100* short puzzles for testing your knowledge of panda

Alex Riley 1.9k Jan 08, 2023
Easily configurable, chart dashboards from any arbitrary API endpoint. JSON config only

Flask JSONDash Easily configurable, chart dashboards from any arbitrary API endpoint. JSON config only. Ready to go. This project is a flask blueprint

Chris Tabor 3.3k Dec 31, 2022
Python script for writing text on github contribution chart.

Github Contribution Drawer Python script for writing text on github contribution chart. Requirements Python 3.X Getting Started Create repository Put

Steven 0 May 27, 2022
A small script written in Python3 that generates a visual representation of the Mandelbrot set.

Mandelbrot Set Generator A small script written in Python3 that generates a visual representation of the Mandelbrot set. Abstract The colors in the ou

1 Dec 28, 2021
Simple implementation of Self Organizing Maps (SOMs) with rectangular and hexagonal grid topologies

py-self-organizing-map Simple implementation of Self Organizing Maps (SOMs) with rectangular and hexagonal grid topologies. A SOM is a simple unsuperv

Jonas Grebe 1 Feb 10, 2022
Open-questions - Open questions for Bellingcat technical contributors

Open questions for Bellingcat technical contributors These are difficult, long-term projects that would contribute to open source investigations at Be

Bellingcat 234 Dec 31, 2022
Ana's Portfolio

Ana's Portfolio ✌️ Welcome to my Portfolio! You will find here different Projects I have worked on (from scratch) 💪 Projects 💻 1️⃣ Hangman game (Mad

Ana Katherine Cortes Sobrino 9 Mar 15, 2022
Customizing Visual Styles in Plotly

Customizing Visual Styles in Plotly Code for a workshop originally developed for an Unconference session during the Outlier Conference hosted by Data

Data Design Dimension 9 Aug 03, 2022
A comprehensive tutorial for plotting focal mechanism

Focal_Mechanisms_Demo A comprehensive tutorial for plotting focal mechanism "beach-balls" using the PyGMT package for Python. (Resulting map of this d

3 Dec 13, 2022
Create charts with Python in a very similar way to creating charts using Chart.js

Create charts with Python in a very similar way to creating charts using Chart.js. The charts created are fully configurable, interactive and modular and are displayed directly in the output of the t

Nicolas H 68 Dec 08, 2022