🎨 Python3 binding for `@AntV/G2Plot` Plotting Library .

Overview

PyG2Plot

🎨 Python3 binding for @AntV/G2Plot which an interactive and responsive charting library. Based on the grammar of graphics, you can easily make superior statistical charts through a few lines of code. PyG2Plot is inspired by pyecharts.

Latest Stable Version build Status

Document中文说明文档 · Drawing statistical plots · In Jupyter Notebook · Principles

Installation

$ pip install pyg2plot

Usage

render HTML

from pyg2plot import Plot

line = Plot("Line")

line.set_options({
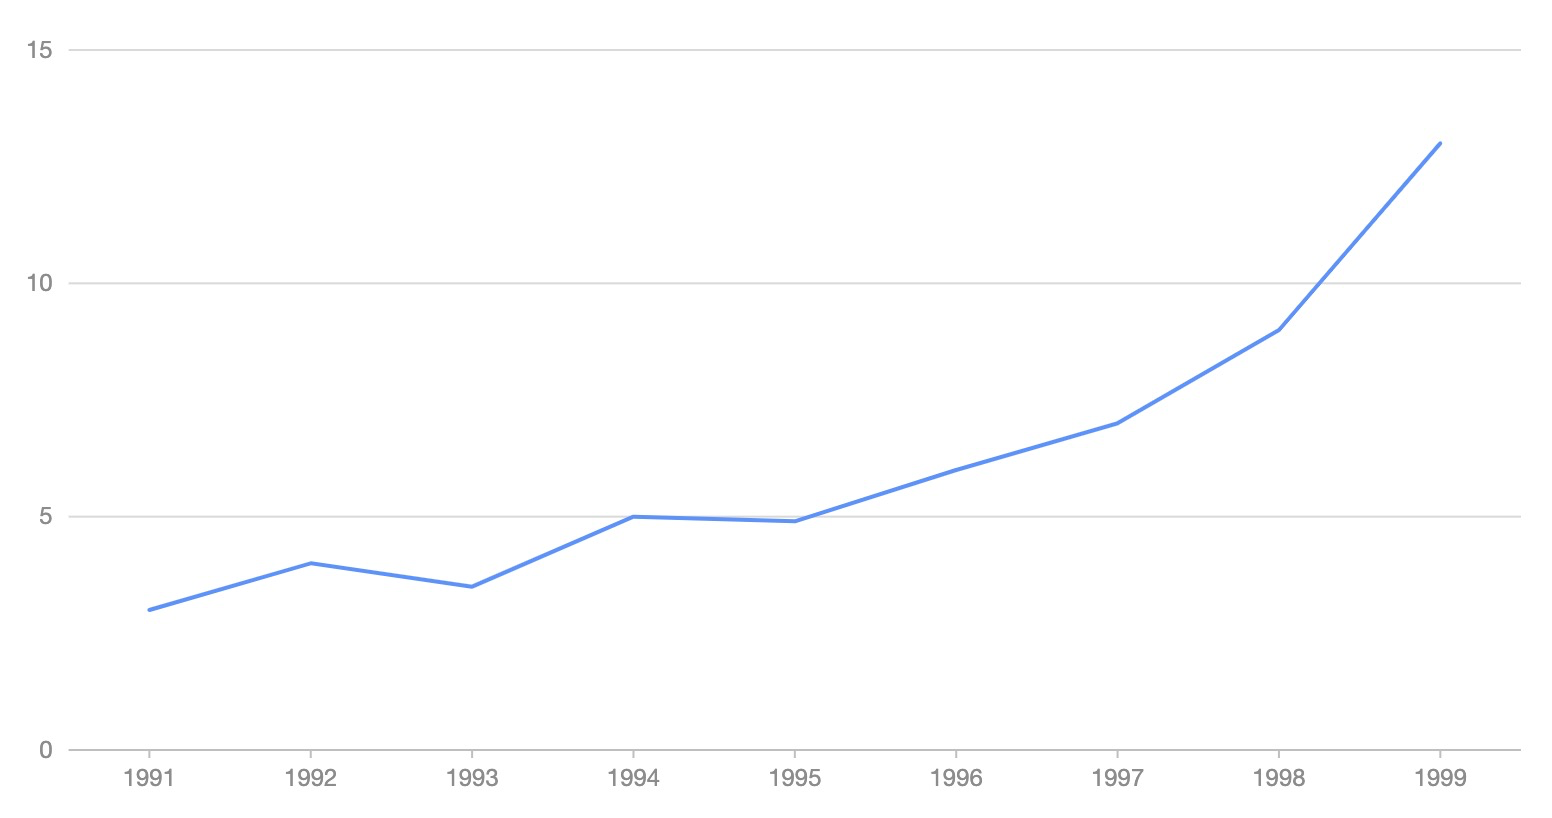
  "data": [
    { "year": "1991", "value": 3 },
    { "year": "1992", "value": 4 },
    { "year": "1993", "value": 3.5 },
    { "year": "1994", "value": 5 },
    { "year": "1995", "value": 4.9 },
    { "year": "1996", "value": 6 },
    { "year": "1997", "value": 7 },
    { "year": "1998", "value": 9 },
    { "year": "1999", "value": 13 },
  ],
  "xField": "year",
  "yField": "value",
})

# 1. render html file
line.render("plot.html")
# 2. render html string
line.render_html()

image

render Jupyter

from pyg2plot import Plot

line = Plot("Line")

line.set_options({
  "height": 400, # set a default height in jupyter preview
  "data": [
    { "year": "1991", "value": 3 },
    { "year": "1992", "value": 4 },
    { "year": "1993", "value": 3.5 },
    { "year": "1994", "value": 5 },
    { "year": "1995", "value": 4.9 },
    { "year": "1996", "value": 6 },
    { "year": "1997", "value": 7 },
    { "year": "1998", "value": 9 },
    { "year": "1999", "value": 13 },
  ],
  "xField": "year",
  "yField": "value",
})

# 1. render in notebook
line.render_notebook()

# 2. render in jupyter lab
line.render_jupyter_lab()

API

Now, only has one API of pyg2plot.

  • Plot
  1. Plot(plot_type: str): get an instance of Plot class.

  2. plot.set_options(options: object): set the options of G2Plot into instance.

  3. plot.render(path, env, **kwargs): render out html file by setting the path, jinja2 env and kwargs.

  4. plot.render_notebook(env, **kwargs): render plot on jupyter preview.

  5. plot.render_html(env, **kwargs): render out html string by setting jinja2 env and kwargs.

  6. plot.dump_js_options(env, **kwargs): dump js options by setting jinja2 env and kwargs, use it for HTTP request.

More apis is on the way.

License

MIT@hustcc.

Owner
hustcc
@alipay 内推,参入可视化开源项目,请加个人微信:AnyPlot。
hustcc
flask extension for integration with the awesome pydantic package

Flask-Pydantic Flask extension for integration of the awesome pydantic package with Flask. Installation python3 -m pip install Flask-Pydantic Basics v

249 Jan 06, 2023
The Python ensemble sampling toolkit for affine-invariant MCMC

emcee The Python ensemble sampling toolkit for affine-invariant MCMC emcee is a stable, well tested Python implementation of the affine-invariant ense

Dan Foreman-Mackey 1.3k Jan 04, 2023
The repository is my code for various types of data visualization cases based on the Matplotlib library.

ScienceGallery The repository is my code for various types of data visualization cases based on the Matplotlib library. It summarizes the code and cas

Warrick Xu 2 Apr 20, 2022
The interactive graphing library for Python (includes Plotly Express) :sparkles:

plotly.py Latest Release User forum PyPI Downloads License Data Science Workspaces Our recommended IDE for Plotly’s Python graphing library is Dash En

Plotly 12.7k Jan 05, 2023
This is Pygrr PolyArt, a program used for drawing custom Polygon models for your Pygrr project!

This is Pygrr PolyArt, a program used for drawing custom Polygon models for your Pygrr project!

Isaac 4 Dec 14, 2021
Exploratory analysis and data visualization of aircraft accidents and incidents in Brazil.

Exploring aircraft accidents in Brazil Occurrencies with aircraft in Brazil are investigated by the Center for Investigation and Prevention of Aircraf

Augusto Herrmann 5 Dec 14, 2021
Write python locally, execute SQL in your data warehouse

RasgoQL Write python locally, execute SQL in your data warehouse ≪ Read the Docs · Join Our Slack » RasgoQL is a Python package that enables you to ea

Rasgo 265 Nov 21, 2022
Painlessly create beautiful matplotlib plots.

Announcement Thank you to everyone who has used prettyplotlib and made it what it is today! Unfortunately, I no longer have the bandwidth to maintain

Olga Botvinnik 1.6k Jan 06, 2023
Advanced hot reloading for Python

The missing element of Python - Advanced Hot Reloading Details Reloadium adds hot reloading also called "edit and continue" functionality to any Pytho

Reloadware 1.9k Jan 04, 2023
Log visualizer for whirl-framework

Lumberjack Log visualizer for whirl-framework Установка pip install -r requirements.txt Как пользоваться python3 lumberjack.py -l путь до лога -o

Vladimir Malinovskii 2 Dec 19, 2022
Material for dataviz course at university of Bordeaux

Material for dataviz course at university of Bordeaux

Nicolas P. Rougier 50 Jul 17, 2022
A concise grammar of interactive graphics, built on Vega.

Vega-Lite Vega-Lite provides a higher-level grammar for visual analysis that generates complete Vega specifications. You can find more details, docume

Vega 4k Jan 08, 2023
This is my favourite function - the Rastrigin function.

This is my favourite function - the Rastrigin function. What sparked my curiosity and interest in the function was its complexity in terms of many local optimum points, which makes it particularly in

1 Dec 27, 2021
Realtime Web Apps and Dashboards for Python and R

H2O Wave Realtime Web Apps and Dashboards for Python and R New! R Language API Build and control Wave dashboards using R! New! Easily integrate AI/ML

H2O.ai 3.4k Jan 06, 2023
erdantic is a simple tool for drawing entity relationship diagrams (ERDs) for Python data model classes

erdantic is a simple tool for drawing entity relationship diagrams (ERDs) for Python data model classes. Diagrams are rendered using the venerable Graphviz library.

DrivenData 129 Jan 04, 2023
Scientific measurement library for instruments, experiments, and live-plotting

PyMeasure scientific package PyMeasure makes scientific measurements easy to set up and run. The package contains a repository of instrument classes a

PyMeasure 445 Jan 04, 2023
A python script to visualise explain plans as a graph using graphviz

README Needs to be improved Prerequisites Need to have graphiz installed on the machine. Refer to https://graphviz.readthedocs.io/en/stable/manual.htm

Edward Mallia 1 Sep 28, 2021
WhatsApp Chat Analyzer is a WebApp and it can be used by anyone to analyze their chat. 😄

WhatsApp-Chat-Analyzer You can view the working project here. WhatsApp chat Analyzer is a WebApp where anyone either tech or non-tech person can analy

Prem Chandra Singh 26 Nov 02, 2022
✅ Today I Learn

Today I Learn EDA numpy_100ex numpy_0~10 airline_satisfaction_prediction BERT_naver_movie_classification NLP_prepare NLP_Tweet_Emotion_Recognition tex

Yeonghoo_Ahn 3 Dec 15, 2022
Flexitext is a Python library that makes it easier to draw text with multiple styles in Matplotlib

Flexitext is a Python library that makes it easier to draw text with multiple styles in Matplotlib

Tomás Capretto 93 Dec 28, 2022