Complex heatmaps are efficient to visualize associations between different sources of data sets and reveal potential patterns.

Overview

Make Complex Heatmaps

R-CMD-check codecov bioc bioc

Complex heatmaps are efficient to visualize associations between different sources of data sets and reveal potential patterns. Here the ComplexHeatmap package provides a highly flexible way to arrange multiple heatmaps and supports various annotation graphics.

The InteractiveComplexHeatmap package can directly export static complex heatmaps into an interactive Shiny app. Have a try!

Citation

Zuguang Gu, et al., Complex heatmaps reveal patterns and correlations in multidimensional genomic data, Bioinformatics, 2016

Install

ComplexHeatmap is available on Bioconductor, you can install it by:

if (!requireNamespace("BiocManager", quietly=TRUE))
    install.packages("BiocManager")
BiocManager::install("ComplexHeatmap")

If you want the latest version, install it directly from GitHub:

library(devtools)
install_github("jokergoo/ComplexHeatmap")

Usage

Make a single heatmap:

Heatmap(mat, ...)

A single Heatmap with column annotations:

ha = HeatmapAnnotation(df = anno1, anno_fun = anno2, ...)
Heatmap(mat, ..., top_annotation = ha)

Make a list of heatmaps:

Heatmap(mat1, ...) + Heatmap(mat2, ...)

Make a list of heatmaps and row annotations:

ha = HeatmapAnnotation(df = anno1, anno_fun = anno2, ..., which = "row")
Heatmap(mat1, ...) + Heatmap(mat2, ...) + ha

Documentation

The full documentations are available at https://jokergoo.github.io/ComplexHeatmap-reference/book/ and the website is at https://jokergoo.github.io/ComplexHeatmap.

Blog posts

There are following blog posts focusing on specific topics:

Examples

Visualize Methylation Profile with Complex Annotations

complexheatmap_example4

Correlations between methylation, expression and other genomic features

complexheatmap_example3

Visualize Cell Heterogeneity from Single Cell RNASeq

complexheatmap_example2

Making Enhanced OncoPrint

complexheatmap_example1

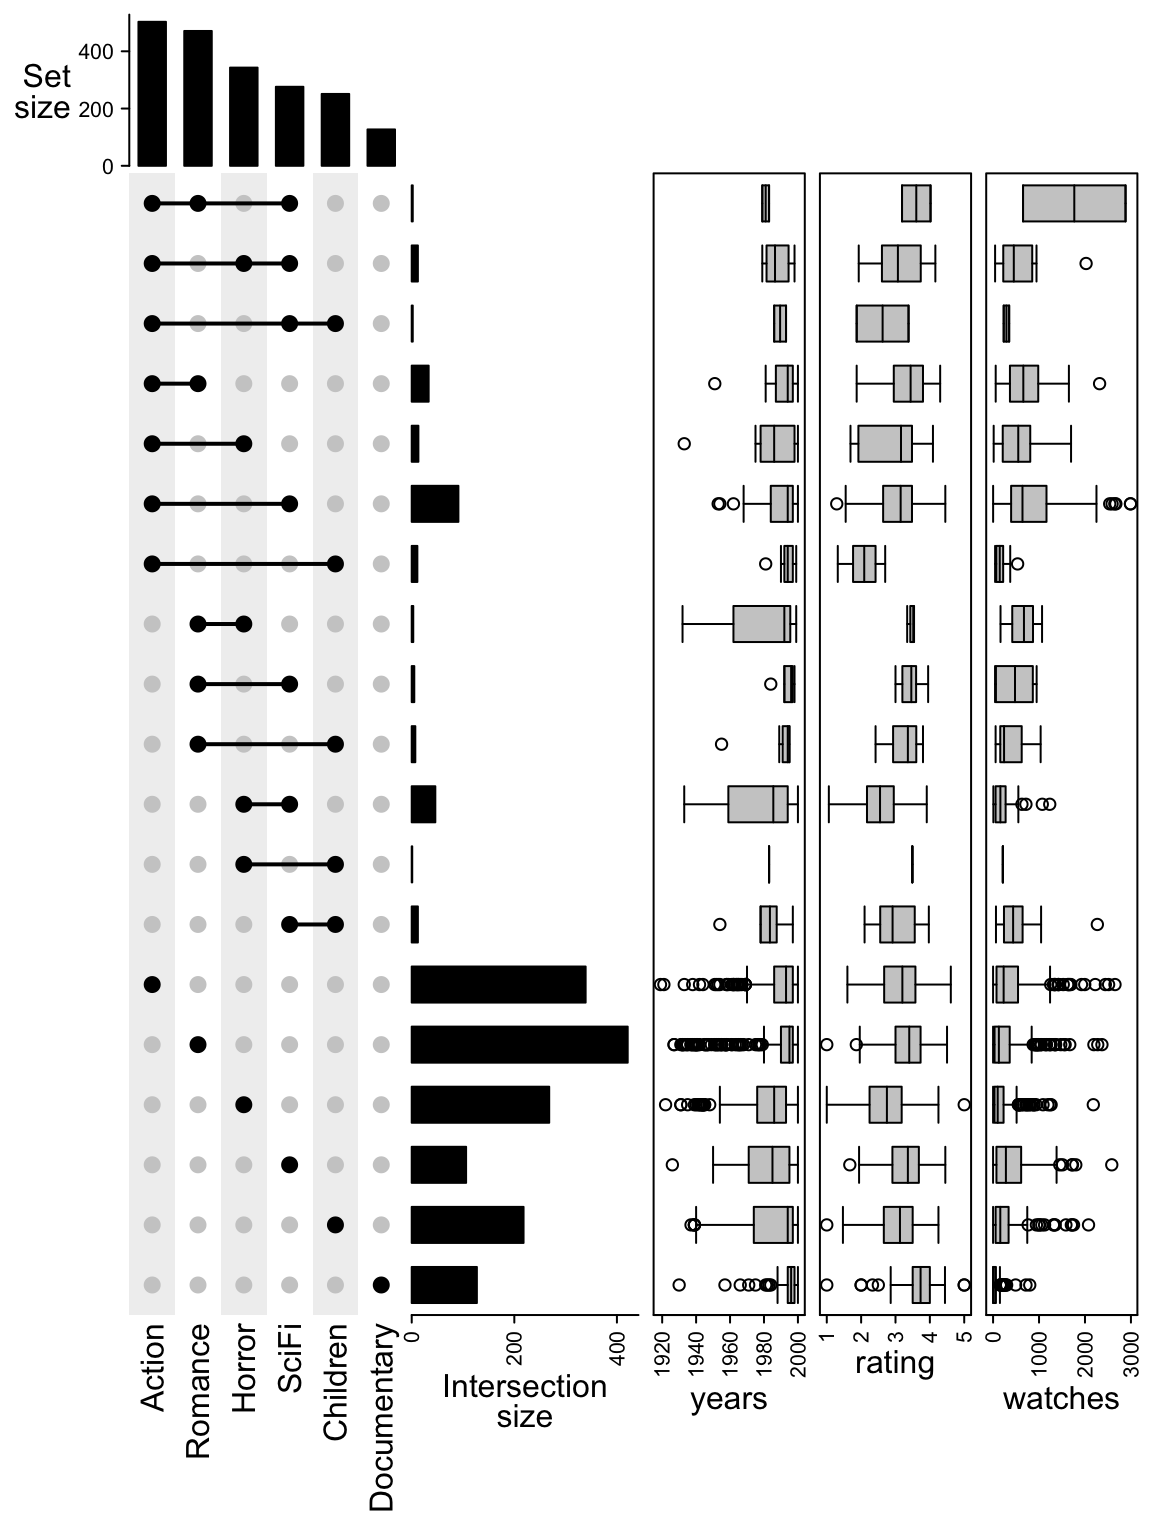
UpSet plot

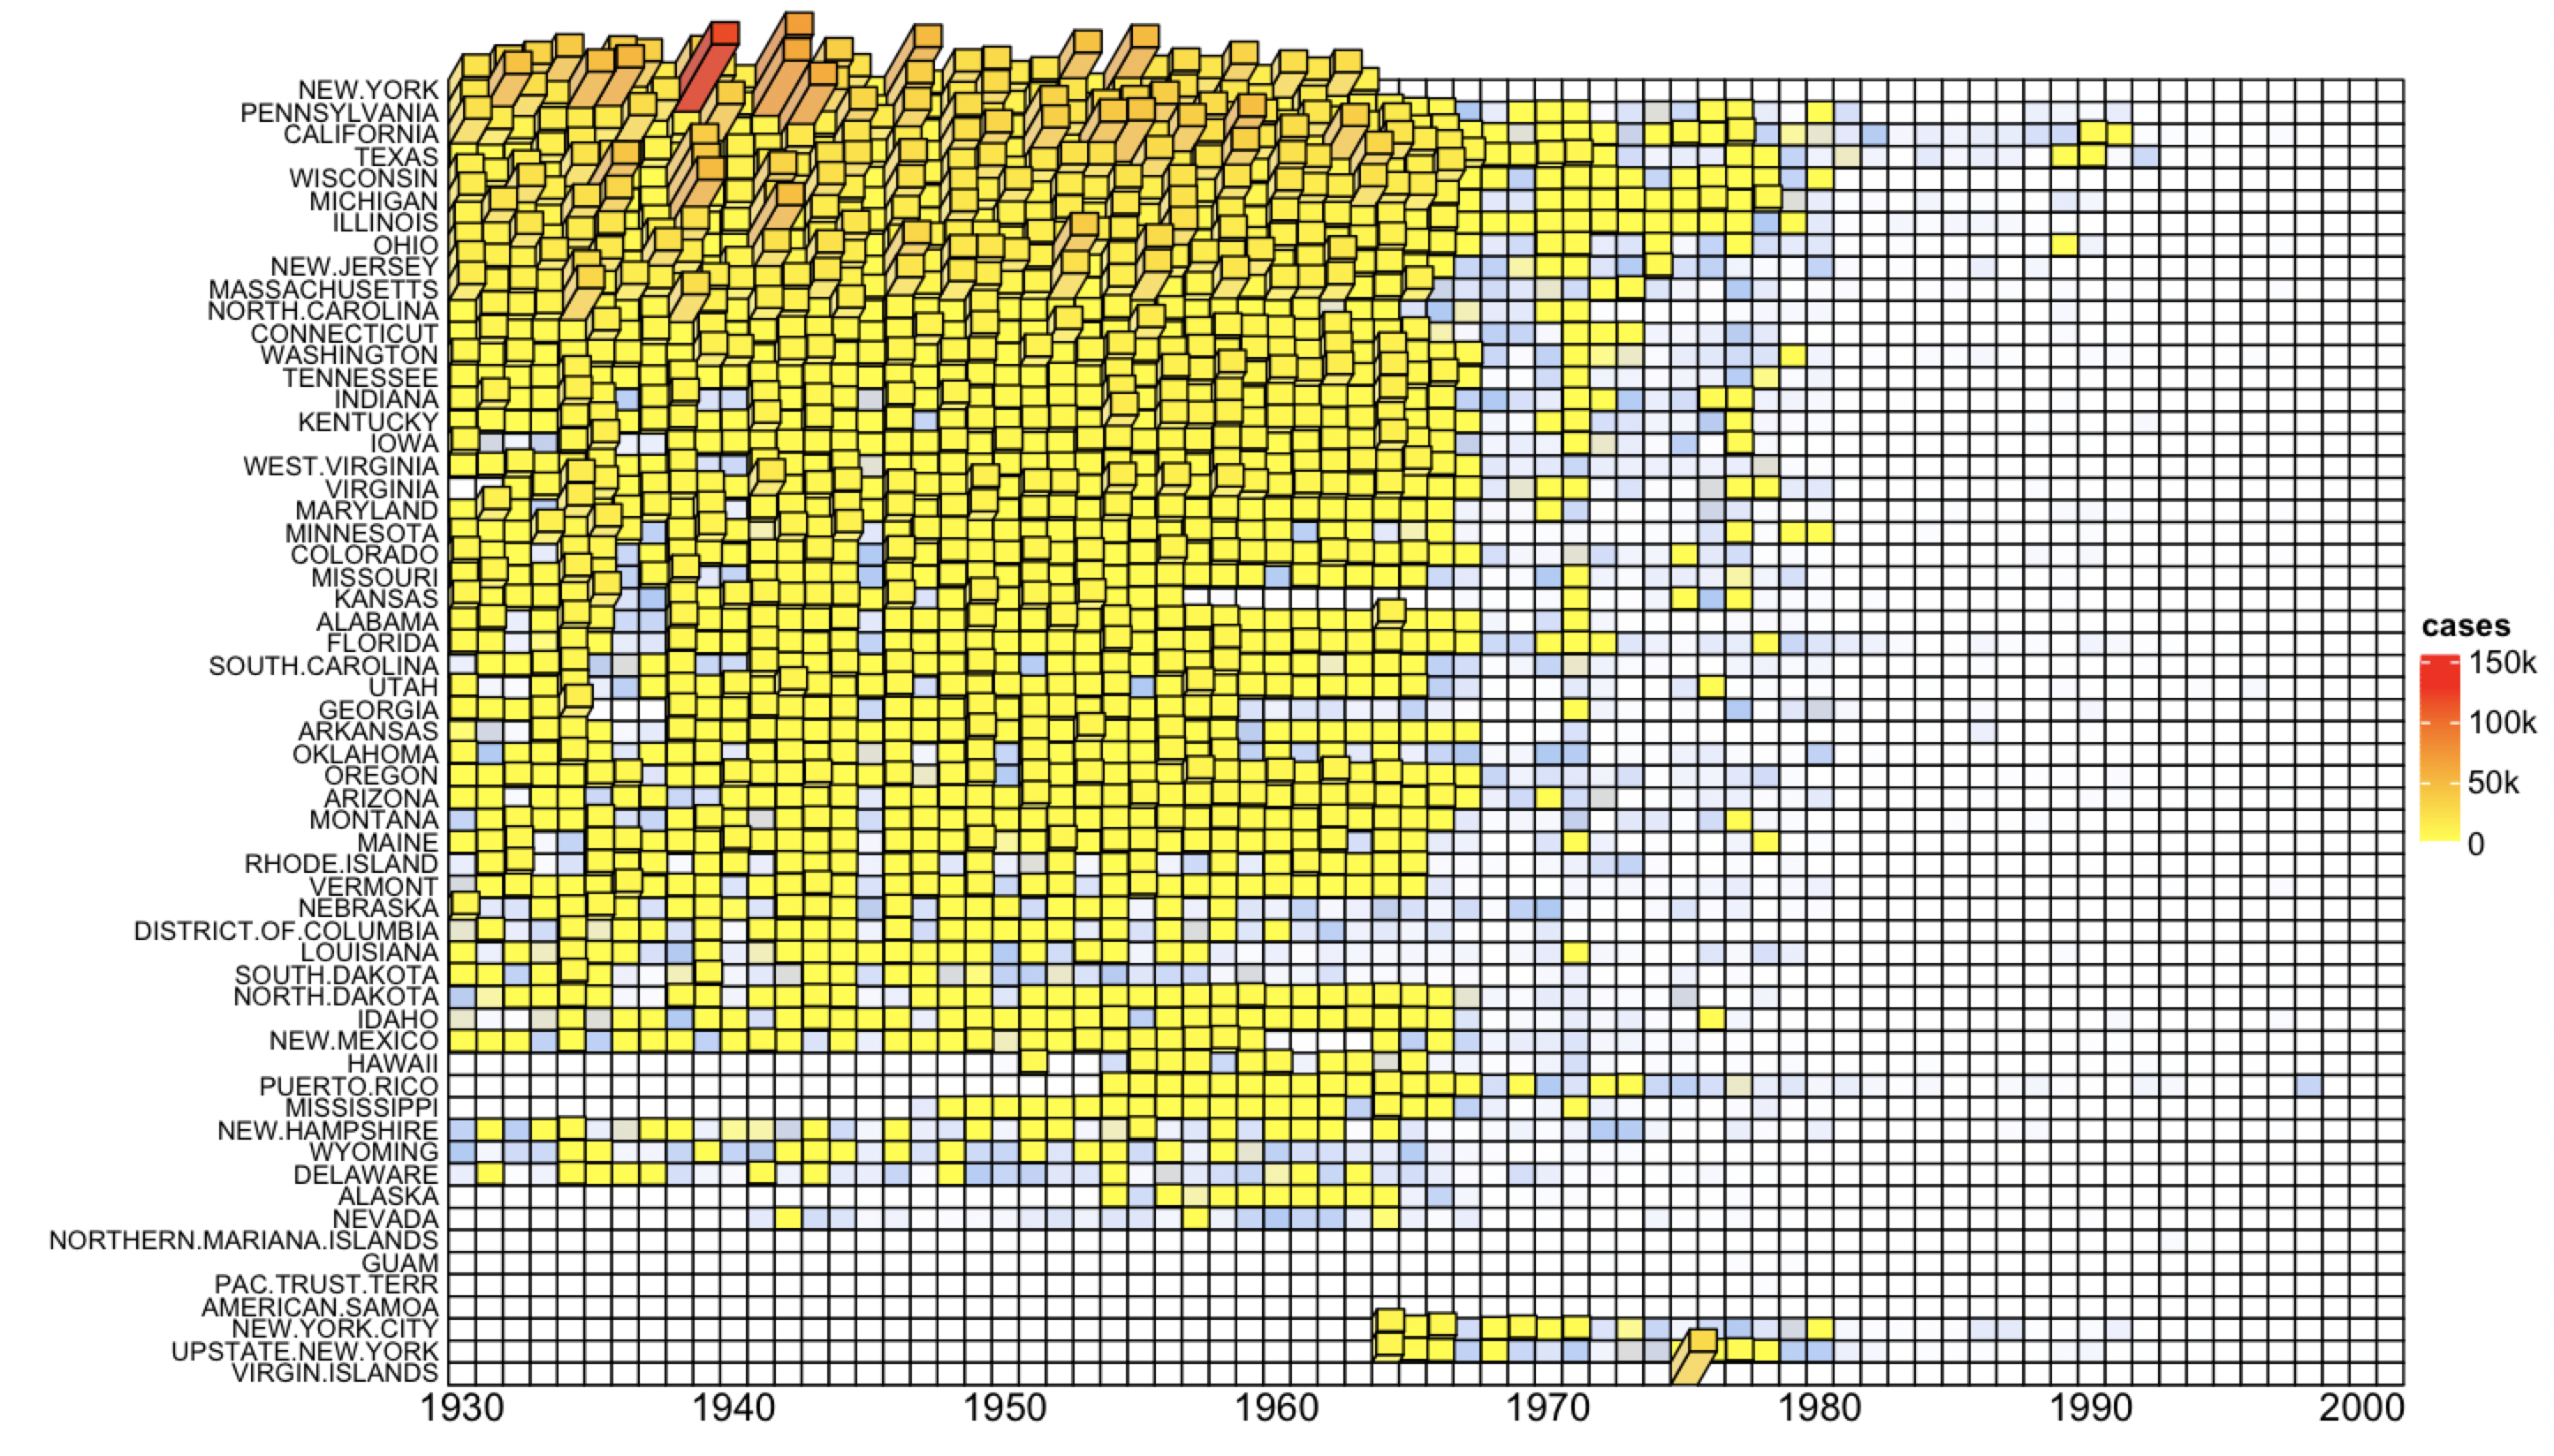
3D heatmap

image

License

MIT @ Zuguang Gu

Comments
  • error: You should have at least two distinct break values in complexheatmap

    error: You should have at least two distinct break values in complexheatmap

    Hi @jokergoo, Thanks to develop this greate tools, The matrix i put in Heatmap sparked the error like below, error: You should have at least two distinct break values in complexheatmap Why the error occurred when using the matrix to plot heatmap using complexheatmap R package. the original code showing below,

    Heatmap(as.matrix(m))
    

    The matrix displaying below,

    image

    Any advice would be appricated

    opened by honghh2018 27
  • split on columns?

    split on columns?

    Hi,

    I looked at the help page for Heatmap, it seems only supports split on rows, and there is a gap parameter for it. Is it possible to split on columns as well?

    A more detailed question is: when I do a supervised-clustering, I want to first split the columns (samples) into say 3 pre-defined subgroups first, and then do clustering within each subgroup for columns and do a k-means for all rows. Is it possible?

    Now, I am manually arrange the data matrix into three distinct groups, and do a K means with the rows, and cluster_column=FALSE.

    Thanks, Ming

    opened by crazyhottommy 26
  • When cluster with too many rows, the heatmap is too dense, and the file size is large.

    When cluster with too many rows, the heatmap is too dense, and the file size is large.

    Hi,

    This is more like a general question. When making heatmap with too many rows, usually use EnrichedHeatmap with many (more than 10,000) genomic regions, the PDF size of the heatmap is very big (several MB). Computer becomes very slow when visualize it or when insert into powerpoint and Word. For other type of analysis, I usually use only top several hundred most variable rows to cluster.

    I know it is more of a visualization than making any real quantitative comparisons. Our eyes probably can not differentiate these many pixels. How to reduce the size of the PDF?

    Some time ago, I got a tip from this post

    Now for my heatmap power tip of the day, if you will: use the "useRaster=TRUE" parameter in your heatmap.2() call. Excellent extension by R developers since 2.13. But for some reason the R developers explicitly turn it off for interactive session windows, so you'll only see it in an exported file. (Unless you have a custom image() function which doesn't disable it, I did this.) It also makes the exported file hugely smaller, especially for PDFs.

    What it does is darn-near essential for nextgen coverage heatmaps -- it actually properly resamples the image as it down-sizes the image during export. Without useRaster=TRUE, image() creates a zillion tiny rectangles to represent the heatmap, all pieced together right next to each other. When the display is fewer pixels/points high than the number of rows of data, it discretizes the data -- that is, it uses integer values for the rectangles. In many cases, especially onscreen, many rectangles fully overlap others, randomly obscuring the real patterns, and often blunting your otherwise cool-looking signal.

    useRaster=TRUE is only for heatmap.2 or internally image(). Is there a way to specify it in ComplexHeatmaps or how do you usually deal with this situation?

    Thanks, Ming

    opened by crazyhottommy 25
  • `ComplexHeatmap::pheatmap()` cannot produce top annotations when called from within `do.call`.

    `ComplexHeatmap::pheatmap()` cannot produce top annotations when called from within `do.call`.

    Some of the logic within HeatmapAnnotation()'s system call check code breaks down when it is called within do.call(pheatmap, ...)

    library(ComplexHeatmap)
    
    mat <- matrix(rpois(30, 20), ncol=5)
    rownames(mat) <- paste0("gene", 1:6)
    colnames(mat) <- paste0("samp", 1:5)
    
    annotation_col <- data.frame(score = 1:5,
                                 row.names = colnames(mat))
    
    # Direct call works
    pheatmap(mat, annotation_col = annotation_col)
    
    # indirect call with do.call
    do.call(pheatmap, list(mat, annotation_col = annotation_col))
    > Error in as.character(scl[[1]]) : 
        cannot coerce type 'closure' to vector of type 'character'
    

    The error comes from this line, https://github.com/jokergoo/ComplexHeatmap/blob/a5cd974897746990d16843724d71822ccd771feb/R/HeatmapAnnotation-class.R#L161 and results from scl[[1]] being the function definition itself, rather than its symbolic name. Thus as.character() fails.

    I'm not sure of the best solution here, but it may help that is.symbol(scl[[1]]) evaluates to TRUE for direct calls but FALSE for indirect calls through do.call.

    opened by dtm2451 19
  • Error: invalid 'xscale' in viewport

    Error: invalid 'xscale' in viewport

    ComplexHeatmap::Heatmap(matrix(c(0, 0, 1, 1), nrow=2))
    

    gives

    Error in valid.viewport(x, y, width, height, just, gp, clip, mask, xscale,  :
      invalid 'xscale' in viewport
    
    opened by bersbersbers 18
  • column_split usage

    column_split usage

    Hi,

    I want to split the columns unevenly. I have 34 samples and want to split it to 8-26 in the oncoPrint. I tried to search the wiki, but I am unable to find the proper usage for that. It always gives me the error that "the number of columns should be equal to the ncol of matirx"

    Also I am using, column_order and column)split both, so should I define a list of column orders since I am splitting the matrix?

    You help is much appreciated.

    Thanks, Rashesh

    opened by Rashesh7 18
  • Apply customized dendrogram to heatmap

    Apply customized dendrogram to heatmap

    Hey, I was wondering how to apply my customized dendrogram to the heatmap. I first generated a heatmap with specified clustering method in Heatmap commend:

    Heatmap(matrix_new, cluster_columns =T, cluster_rows=F, clustering_distance_columns = "pearson", clustering_method_columns = "ward.D")

    Then, I customized the dendrogram using the following codes

    hc <- hclust(as.dist(1-cor(t(sample.norm[,1:18]),method="pearson")),method="ward.D") dd <- as.dendrogram(hc) dd.reorder = reorder(dd, c(rep(10, 22),rep(9,27),rep(1,49)), agglo.FUN = mean)

    When I plot the customized dendrogram, it did changed into the way I want. And I assigned the customized dendrogram to the heatmap I created at the first:

    Heatmap(matrix_new, cluster_columns = dd.reorder, cluster_rows=F)

    However, the dendrograms in two heatmaps did not change. I am not sure what went wrong, and come here for some help. Any advise?

    Thanks, Stingo

    opened by stingo93 16
  • Custom Heatmap Row Labels

    Custom Heatmap Row Labels

    Greetings!

    I was wondering if it is possible to add a table along the height of the heatmap to depict multiple pieces of information about the column? For instance, I want to show the gene locus number in one column, the gene name in a second, and what it is identified as in a different organism in a third column. I have gone through the how to web pages for the ComplexHeatmap package, and I saw nothing. Is what I am suggesting possible for your package? If not, do you have any suggestions as to how I might be able to implement this?

    Thank you very much for your time!

    enhancement 
    opened by FireBorn123 15
  • Not a validObject(): no slot of name

    Not a validObject(): no slot of name "subsetable"

    Hi jokergoo, I'm working on a new project and I make some complexheatmaps. However when I open the R project and I load the library {ComplexHeatmap}, I get these warnings:

    Warning messages:
    1: Not a validObject(): no slot of name "subsetable" for this object of class "HeatmapAnnotation" 
    2: Not a validObject(): no slot of name "subsetable" for this object of class "SingleAnnotation" 
    3: Not a validObject(): no slot of name "subsetable" for this object of class "AnnotationFunction" 
    4: Not a validObject(): no slot of name "subsetable" for this object of class "HeatmapAnnotation" 
    5: Not a validObject(): no slot of name "subsetable" for this object of class "SingleAnnotation" 
    6: Not a validObject(): no slot of name "subsetable" for this object of class "AnnotationFunction" 
    

    The problem appears only when I load the package inside this R project and only the first time I load it. In other R project I don't have it. Do you know why I have these warnings? I don't even understand what do they mean.

    I have the latest version of R (4.1.3) and ComplexHeatmap (2.10.0).

    opened by ShinyFabio 14
  • Freeze after first Heatmap()

    Freeze after first Heatmap()

    Thank you for putting together and maintaining ComplexHeatmap. I just got started with the github version 2.9.3 (July 29, 2021) on R Version 4.0.2. Heatmap() runs without any issue for the first heatmap. But, on trying to repeat this with the same matrix, R freezes. This occurs both with RStudio and from R Console.

    Here are some snippets from running devtools::session_info()

    - Session info -----------------------------------------------------------------------------------
     setting  value                       
     version  R version 4.0.2 (2020-06-22)
     os       Windows 10 x64              
     system   x86_64, mingw32             
     ui       RStudio                     
     language (EN)                        
     collate  English_United States.1252  
     ctype    English_United States.1252  
     tz       America/New_York            
     date     2021-07-29 
    
     ComplexHeatmap * 2.9.3    2021-07-29 [1] Github (jokergoo/[email protected])
    

    Thanks, Vishal

    opened by pseudorational 14
  • heatmap_legend_side does not moves the annotation legends

    heatmap_legend_side does not moves the annotation legends

    Hi,

    When we use the parameter heatmap_legend_side to move the legends to the bottom draw(ht, heatmap_legend_side = "bottom"), it only moves the legends from the onconprint, but not for annatations to the bottom.

    How can I do that? I would like to have all legends in the bottom. Thanks.

    image

    opened by tiagochst 14
  • Get nicer plot with anno_mark

    Get nicer plot with anno_mark

    Hello!

    Thanks for ComplexHeatmap!! I was wondering what's the best way to get something like B here (Alvisi G,et al. Multimodal single-cell profiling of intrahepatic cholangiocarcinoma defines hyperactivated Tregs as a potential therapeutic target. J Hepatol. 2022 Nov;77(5):1359-1372.): image

    I have a gene co-expression heatmap and I want to show selected genes in the areas of high correlation. Here is my attempt with anno_mark:

    position <- which(rownames(mat)%in%genes)
    
    row_an <- rowAnnotation(Genes = anno_mark(at = position,
                                               labels = rownames(mat)[position],
                                               labels_gp = gpar(fontsize = 6),
                                               link_width = unit(5, "mm"),
                                               padding = unit(1, "mm"),
                                               link_gp = gpar(lwd = 1),
                                              extend = unit(1, "mm")))
    
    ht.3 <- Heatmap(mat, name = "Spearman correlation",
                    column_names_gp = grid::gpar(fontsize = 0),
                    row_names_gp = grid::gpar(fontsize = 0),
                    right_annotation = row_an,
                    heatmap_legend_param = list(legend_direction = "horizontal")) 
    draw(ht.3, heatmap_legend_side = "bottom")
    

    where genes are the selected genes I want to plot.

    This is what I get: heat_corr

    The heatmap is a bit confusing. I tried to use anno_zoom or anno_textbox but would like to maintain the rows clustering and I would prefer not to split the rows.

    Is it doable?

    Thanks, Francesco

    opened by france-hub 0
  • Visually different heatmaps even though generated in the exact same way

    Visually different heatmaps even though generated in the exact same way

    So I have been trying to troubleshoot this issue I have run into when generating publication quality grouped heatmaps.

    I am attaching 3 heatmaps which are generated from three different matrices, but which are all generated in exactly the same way. The code to generate the heatmaps is also exactly the same ( it is one function iterated over the three matrices.)

    However, for some reason I have yet to understand, they have strikingly different 'pixel' size. This is visible directly in the in-line RStudio image device... as well as after exporting at 1200 DPI PNG files.

    Any ideas? I'm including the size of the data matrices for comparison:

    Heatmap 1: 875 columns x 2119 rows

    aaa_1

    Heatmap 2: 674 columns x 1743 rows

    aaa_2

    Heatmap 3: 241 ccolumns x 1780 rows

    aaa_3

    opened by RobertWhitener 0
  • How to make bars filled with more than two colors correctly in anno_numeric?

    How to make bars filled with more than two colors correctly in anno_numeric?

    ginfo: image

    anno209 <- rowAnnotation(
        log2fc1 = anno_numeric(ginfo$log2FC209 %>% nice_round(., digit=3), 
                               bg_gp = gpar(fill = ginfo$col209),
                               labels_gp = gpar(fontsize = letter_size),
                               bar_width = unit(1, "npc") - unit(2, "pt")), 
        annotation_name_rot = row_anno_rot,
        annotation_name_gp = gpar(fontsize = label_size, fontface = "bold"),
        width=unit(c(row_anno_width), "in"),
        annotation_name_offset = unit(c(row_anno_offset), "mm"),
        annotation_label = "log2FC 209_5 VS 313_1" 
      );
    

    I intended to have log2FC barplot as a row annotation using anno_numeric, fill the bars that are significantly (padj209 <= 0.05) upregulated (log2FC209 > 0) red, significantly (padj209 <= 0.05) downregulated (log2FC209 < 0) green, not significant (padj209 > 0.05) white. Based on the criteria, I have the color ready as col209. Using the code above, I got bar annotation as below:

    image

    Basically, it failed to add the color appropriately. Do you know how to fix it?

    Thank you very much, Wendy

    opened by guodudou 0
  • Can't Add Multiple Annotations to UpSet Plot: Error: Length of annotations differs.

    Can't Add Multiple Annotations to UpSet Plot: Error: Length of annotations differs.

    Dear Jokergoo, Congratulations on developing and maintaining this fantastic package. Easily one of my favourite R packages overall.

    I've recently stumbled across a frustrating error whilst trying to make an UpSet plot annotated with different intersect methods. For context, I've made this type of plot before (shown below), and in fact even recycled the code when trying to remake it this time. My problem is that I can make each UpSet plot (intersect, distinct, and union) separately fine (shown below), but when I tried to add them into the same plot I get the following error: "Error: Length of annotations differs. distict: 7, intersect: 11, union: 15" (notice also the little spelling mistake in "distict").

    ComplexHeatmap Issue-page-001

    And here is my code

    Sets <- list(
    Abd.Fem   = vector1,
    Glu.Fem    = vector2,
    Abd.Man  = vector3,
    Glu.Man   = vector4)
    UPSets.intersect <- make_comb_mat(Sets, mode = "intersect", min_set_size = 0)
    UPSets.intersect.distinct <- make_comb_mat(Sets, mode = "distinct", min_set_size = 0)
    UPSets.intersect.union <- make_comb_mat(Sets, mode = "union", min_set_size = 0)
    # # # # # # # # # # # # # # # # # # # # # # # # # # # # # # # # # # #
    Sets.Upset.Plot <-
    UpSet(t(UPSets.intersect.distinct[comb_degree(UPSets.intersect.distinct) > 0]),
          comb_order = order(-comb_size(UPSets.intersect.distinct[comb_degree(UPSets.intersect.distinct) > 0])),
          set_order = c("Abd.Fem","Glu.Fem","Abd.Man","Glu.Man"),
          pt_size = unit(5, "mm"),
          lwd = 3,
          bg_col = c("#f5e1e1","#f5e1e1","#e7f5fe","#e7f5fe"),
          right_annotation = rowAnnotation(
        "distict" = anno_barplot(comb_size(UPSets.intersect.distinct), 
            gp = gpar(fill = "black"), width = unit(1.5, "cm")), 
        "intersect" = anno_barplot(comb_size(UPSets.intersect), 
            gp = gpar(fill = "black"), width = unit(1.5, "cm")), 
        "union" = anno_barplot(comb_size(UPSets.intersect.union), 
            gp = gpar(fill = "black"), width = unit(1.5, "cm")), 
        gap = unit(2, "mm"), annotation_name_side = "bottom"))
    
    Error: Length of annotations differs. distict: 7, intersect: 11, union: 15


    Is it possible to plot these together, as last time, or does the data this time somehow make it impossible? I am using ComplexHeatmap version 2.15.1, downloaded from GitHub today. Your help is very much appreciated! Best wishes, Daniel

    opened by danphillips28 0
  • Remove white space between samples in Oncoprint

    Remove white space between samples in Oncoprint

    Hello, Thank you very much for this great package, I use it every time. I was looking to know if it would be possible to remove the white space between sample to get an oncoprint that looks like this ?

    oncoprint

    Thank you! Evan

    opened by eseffar 1
  • How to make the fill color in anno_barplot a gradient color like in heatmap

    How to make the fill color in anno_barplot a gradient color like in heatmap

    Hello, I am trying to make a barplot annotation. The values are between -1 and 1 and I would like to make the filling color gradient like in heatmap using colorRamp2(c(-1, 0, 1), c("green", "white", "red")), but it didn't work If I specify in Signature = anno_barplot(sinfo %>% pull(Signature), height = unit(1.2, "cm"), gp = gpar(fill = colorRamp2(c(-1, 0, 1), c("green", "white", "red")))) Do you have any suggestions? The purpose is to color the following barplots in gradient. image

    Thank you very much!

    opened by guodudou 0
Releases(1.99.4)
Generate visualizations of GitHub user and repository statistics using GitHub Actions.

GitHub Stats Visualization Generate visualizations of GitHub user and repository statistics using GitHub Actions. This project is currently a work-in-

Aditya Thakekar 1 Jan 11, 2022
This repository contains a streaming Dataflow pipeline written in Python with Apache Beam, reading data from PubSub.

Sample streaming Dataflow pipeline written in Python This repository contains a streaming Dataflow pipeline written in Python with Apache Beam, readin

Israel Herraiz 9 Mar 18, 2022
Some method of processing point cloud

Point-Cloud Some method of processing point cloud inversion the completion pointcloud to incomplete point cloud Some model of encoding point cloud to

Tan 1 Nov 19, 2021
649 Pokémon palettes as CSVs, with a Python lib to turn names/IDs into palettes, or MatPlotLib compatible ListedColormaps.

PokePalette 649 Pokémon, broken down into CSVs of their RGB colour palettes. Complete with a Python library to convert names or Pokédex IDs into eithe

11 Dec 05, 2022
Data science project for exploratory analysis on the kcse grades dataset (Kamilimu Data Science Track)

Kcse-Data-Analysis Data science project for exploratory analysis on the kcse grades dataset (Kamilimu Data Science Track) Findings The performance of

MUGO BRIAN 1 Feb 23, 2022
A simple python tool for explore your object detection dataset

A simple tool for explore your object detection dataset. The goal of this library is to provide simple and intuitive visualizations from your dataset and automatically find the best parameters for ge

GRADIANT - Centro Tecnolóxico de Telecomunicacións de Galicia 142 Dec 25, 2022
Interactive Data Visualization in the browser, from Python

Bokeh is an interactive visualization library for modern web browsers. It provides elegant, concise construction of versatile graphics, and affords hi

Bokeh 17.1k Dec 31, 2022
Altair extension for saving charts in a variety of formats.

Altair Saver This packge provides extensions to Altair for saving charts to a variety of output types. Supported output formats are: .json/.vl.json: V

Altair 85 Dec 09, 2022
Library for exploring and validating machine learning data

TensorFlow Data Validation TensorFlow Data Validation (TFDV) is a library for exploring and validating machine learning data. It is designed to be hig

688 Jan 03, 2023
View part of your screen in grayscale or simulated color vision deficiency.

monolens View part of your screen in grayscale or filtered to simulate color vision deficiency. Watch the demo on YouTube. Install with pip install mo

Hans Dembinski 31 Oct 11, 2022
This is a small repository for me to implement my simply Data Visualisation skills through Python.

Data Visualisations This is a small repository for me to implement my simply Data Visualisation skills through Python. Steam Population Chart from 10/

9 Dec 31, 2021
Personal IMDB Graphs with Bokeh

Personal IMDB Graphs with Bokeh Do you like watching movies and also rate all of them in IMDB? Would you like to look at your IMDB stats based on your

2 Dec 15, 2021
YOPO is an interactive dashboard which generates various standard plots.

YOPO is an interactive dashboard which generates various standard plots.you can create various graphs and charts with a click of a button. This tool uses Dash and Flask in backend.

ADARSH C 38 Dec 20, 2022
erdantic is a simple tool for drawing entity relationship diagrams (ERDs) for Python data model classes

erdantic is a simple tool for drawing entity relationship diagrams (ERDs) for Python data model classes. Diagrams are rendered using the venerable Graphviz library.

DrivenData 129 Jan 04, 2023
Analysis and plotting for motor/prop/ESC characterization, thrust vs RPM and torque vs thrust

esc_test This is a Python package used to plot and analyze data collected for the purpose of characterizing a particular propeller, motor, and ESC con

Alex Spitzer 1 Dec 28, 2021
Python Data Validation for Humans™.

validators Python data validation for Humans. Python has all kinds of data validation tools, but every one of them seems to require defining a schema

Konsta Vesterinen 670 Jan 09, 2023
An intuitive library to add plotting functionality to scikit-learn objects.

Welcome to Scikit-plot Single line functions for detailed visualizations The quickest and easiest way to go from analysis... ...to this. Scikit-plot i

Reiichiro Nakano 2.3k Dec 31, 2022
This is a web application to visualize various famous technical indicators and stocks tickers from user

Visualizing Technical Indicators Using Python and Plotly. Currently facing issues hosting the application on heroku. As soon as I am able to I'll like

4 Aug 04, 2022
A data visualization curriculum of interactive notebooks.

A data visualization curriculum of interactive notebooks, using Vega-Lite and Altair. This repository contains a series of Python-based Jupyter notebooks.

UW Interactive Data Lab 1.2k Dec 30, 2022
ipyvizzu - Jupyter notebook integration of Vizzu

ipyvizzu - Jupyter notebook integration of Vizzu. Tutorial · Examples · Repository About The Project ipyvizzu is the Jupyter Notebook integration of V

Vizzu 729 Jan 08, 2023