🎨 Python Echarts Plotting Library

Overview

pyecharts logo

pyecharts

Python ❤️ ECharts = pyecharts

Travis Build Status Appveyor Build Status Codecov Package version PyPI - Python Version

PyPI - Format Contributions welcome License

English README

📣 简介

Apache ECharts (incubating) 是一个由百度开源的数据可视化,凭借着良好的交互性,精巧的图表设计,得到了众多开发者的认可。而 Python 是一门富有表达力的语言,很适合用于数据处理。当数据分析遇上数据可视化时,pyecharts 诞生了。

特性

  • 简洁的 API 设计,使用如丝滑般流畅,支持链式调用
  • 囊括了 30+ 种常见图表,应有尽有
  • 支持主流 Notebook 环境,Jupyter Notebook 和 JupyterLab
  • 可轻松集成至 Flask,Sanic,Django 等主流 Web 框架
  • 高度灵活的配置项,可轻松搭配出精美的图表
  • 详细的文档和示例,帮助开发者更快的上手项目
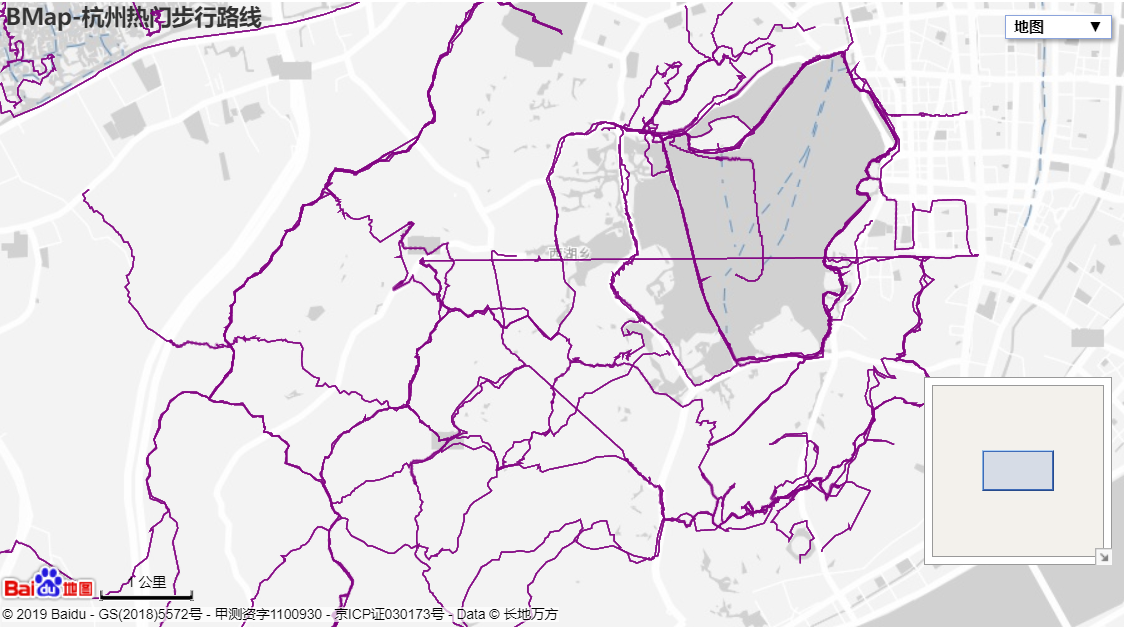
  • 多达 400+ 地图文件,并且支持原生百度地图,为地理数据可视化提供强有力的支持

版本

v0.5.x 和 V1 间不兼容,V1 是一个全新的版本,详见 ISSUE#892ISSUE#1033

V0.5.x

支持 Python2.7,3.4+

经开发团队决定,0.5.x 版本将不再进行维护,0.5.x 版本代码位于 05x 分支,文档位于 05x-docs.pyecharts.org

V1

仅支持 Python3.6+

新版本系列将从 v1.0.0 开始,文档位于 pyecharts.org;示例位于 gallery.pyecharts.org

🔰 安装

pip 安装

# 安装 v1 以上版本
$ pip install pyecharts -U

# 如果需要安装 0.5.11 版本的开发者,可以使用
# pip install pyecharts==0.5.11

源码安装

# 安装 v1 以上版本
$ git clone https://github.com/pyecharts/pyecharts.git
# 如果需要安装 0.5.11 版本,请使用 git clone https://github.com/pyecharts/pyecharts.git -b v05x
$ cd pyecharts
$ pip install -r requirements.txt
$ python setup.py install

📝 使用

本地环境

生成 HTML

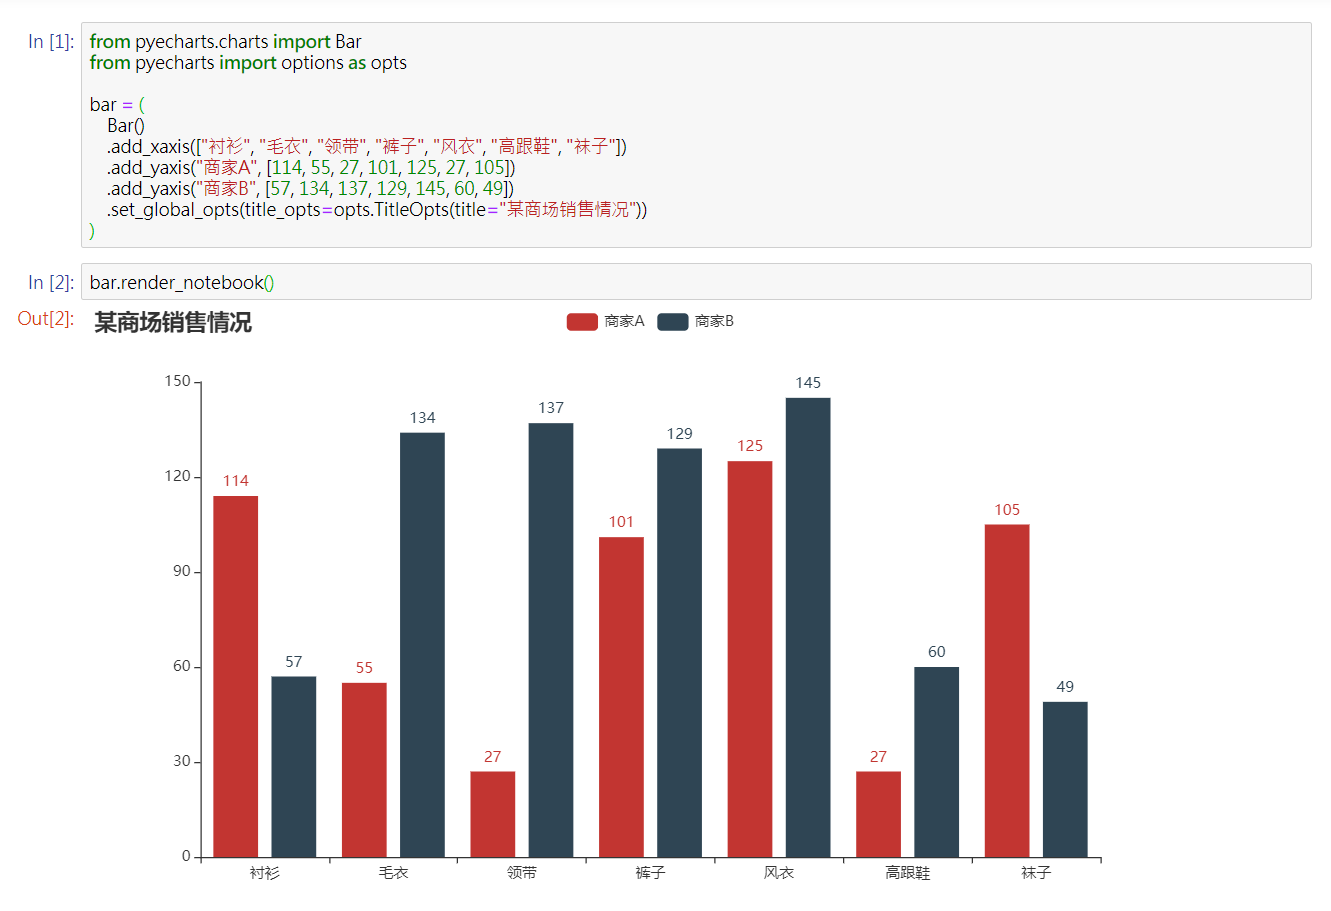
from pyecharts.charts import Bar
from pyecharts import options as opts

# V1 版本开始支持链式调用
bar = (
    Bar()
    .add_xaxis(["衬衫", "毛衣", "领带", "裤子", "风衣", "高跟鞋", "袜子"])
    .add_yaxis("商家A", [114, 55, 27, 101, 125, 27, 105])
    .add_yaxis("商家B", [57, 134, 137, 129, 145, 60, 49])
    .set_global_opts(title_opts=opts.TitleOpts(title="某商场销售情况"))
)
bar.render()

# 不习惯链式调用的开发者依旧可以单独调用方法
bar = Bar()
bar.add_xaxis(["衬衫", "毛衣", "领带", "裤子", "风衣", "高跟鞋", "袜子"])
bar.add_yaxis("商家A", [114, 55, 27, 101, 125, 27, 105])
bar.add_yaxis("商家B", [57, 134, 137, 129, 145, 60, 49])
bar.set_global_opts(title_opts=opts.TitleOpts(title="某商场销售情况"))
bar.render()

生成图片

from snapshot_selenium import snapshot as driver

from pyecharts import options as opts
from pyecharts.charts import Bar
from pyecharts.render import make_snapshot


def bar_chart() -> Bar:
    c = (
        Bar()
        .add_xaxis(["衬衫", "毛衣", "领带", "裤子", "风衣", "高跟鞋", "袜子"])
        .add_yaxis("商家A", [114, 55, 27, 101, 125, 27, 105])
        .add_yaxis("商家B", [57, 134, 137, 129, 145, 60, 49])
        .reversal_axis()
        .set_series_opts(label_opts=opts.LabelOpts(position="right"))
        .set_global_opts(title_opts=opts.TitleOpts(title="Bar-测试渲染图片"))
    )
    return c

# 需要安装 snapshot-selenium 或者 snapshot-phantomjs
make_snapshot(driver, bar_chart().render(), "bar.png")

Notebook 环境

Jupyter Notebook

JupyterLab

Web 框架

🔖 Demo

Demo 代码位于 example 文件夹下,欢迎参考 pyecharts 画廊 pyecharts-gallery

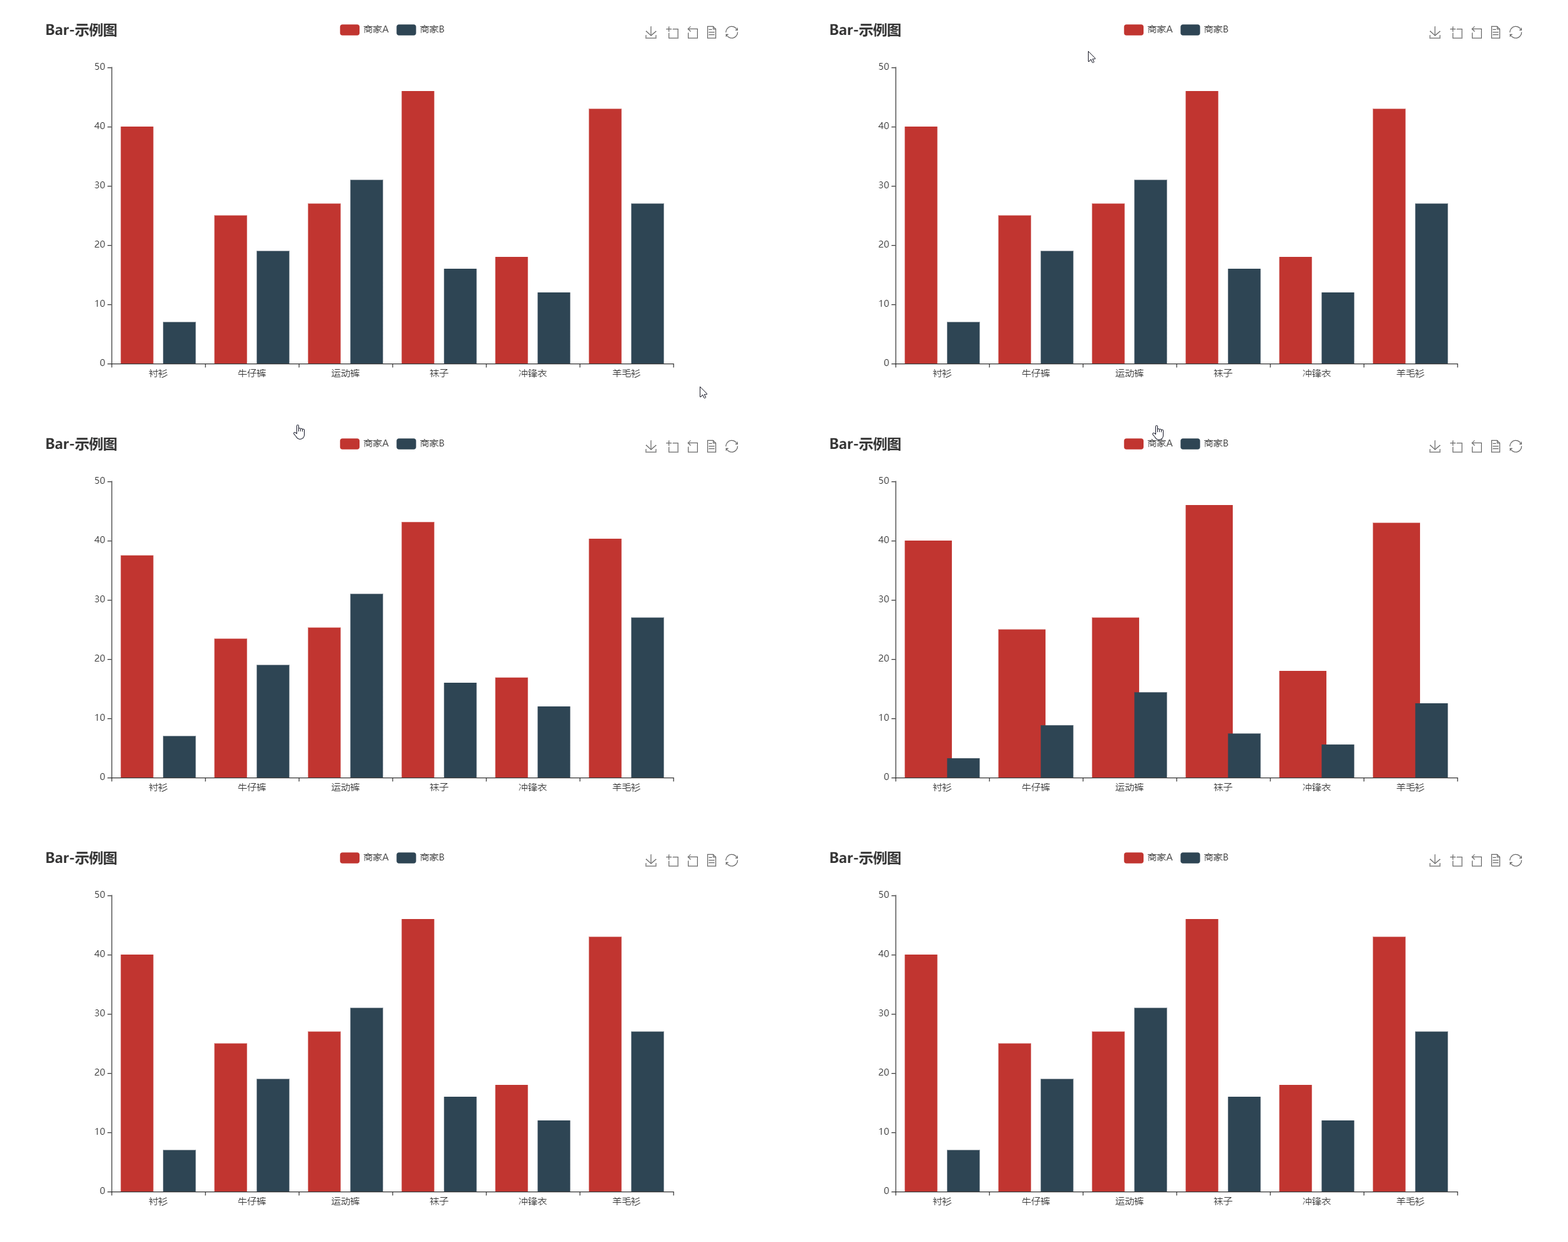
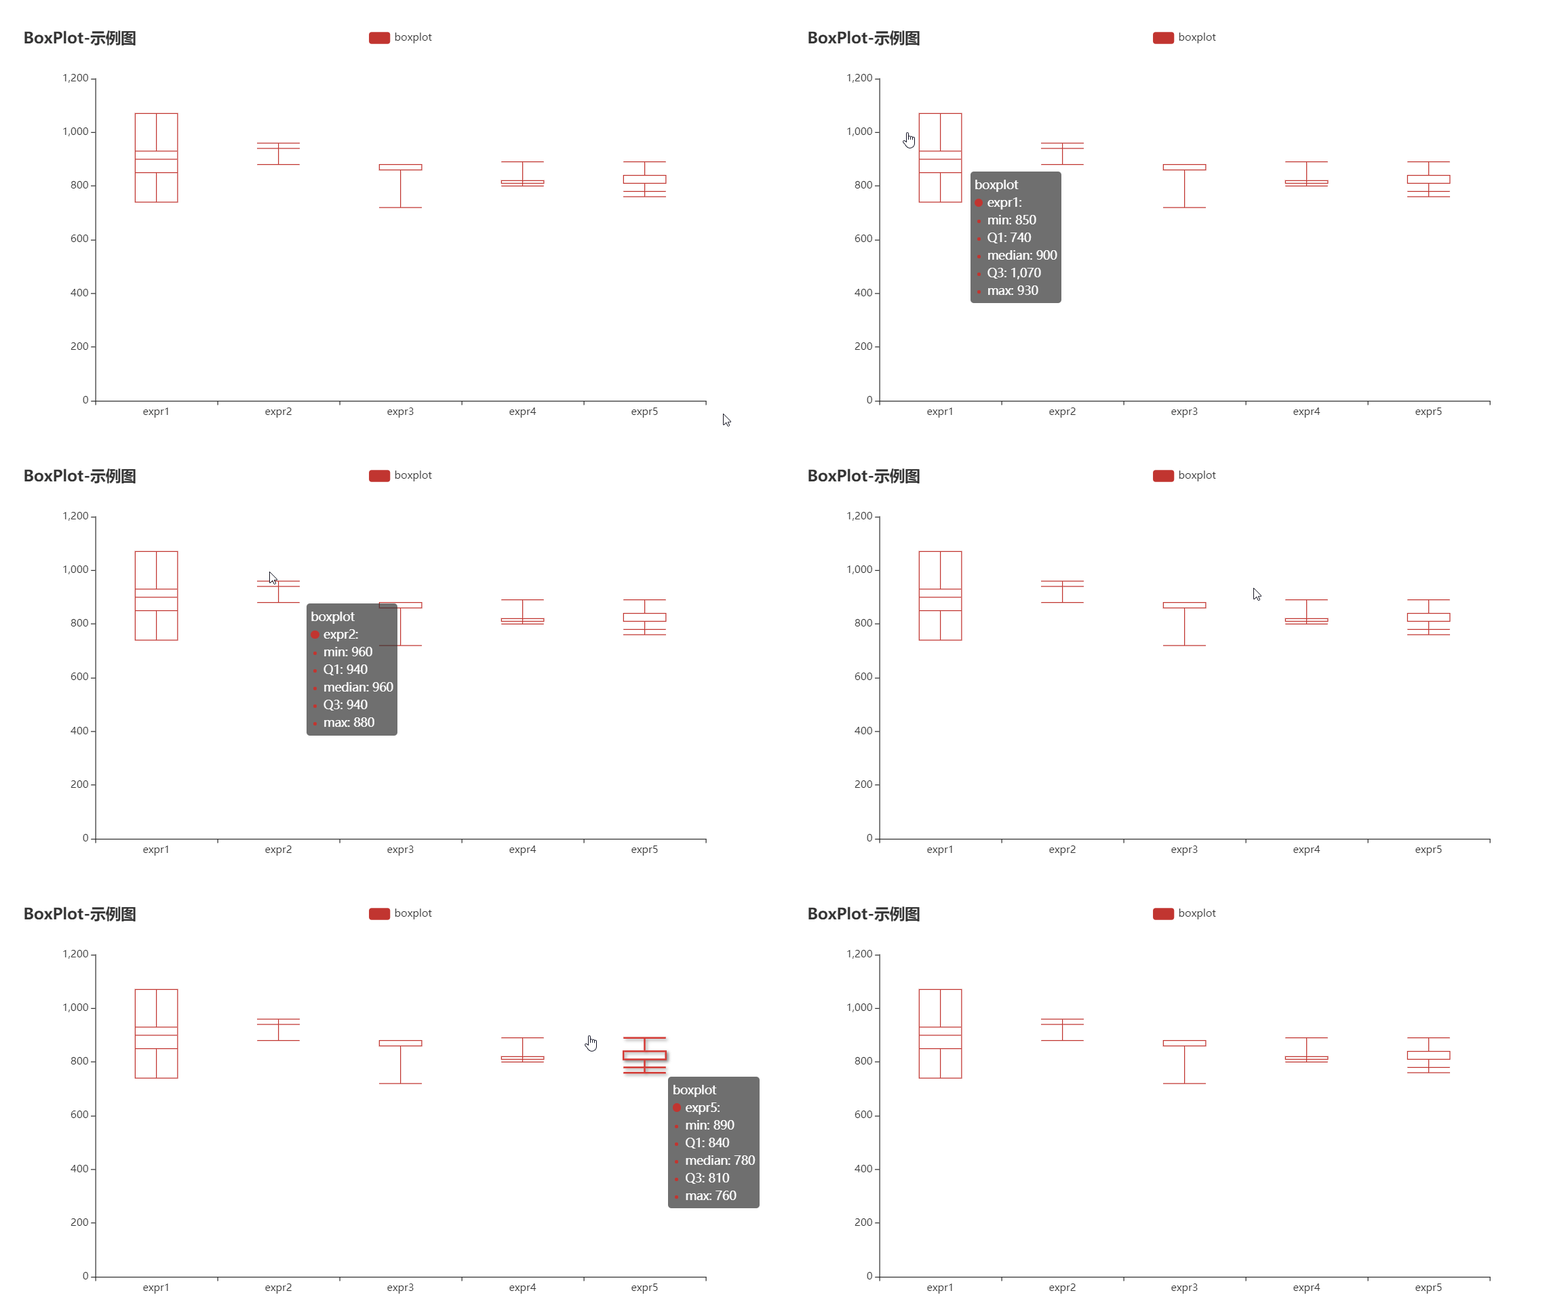
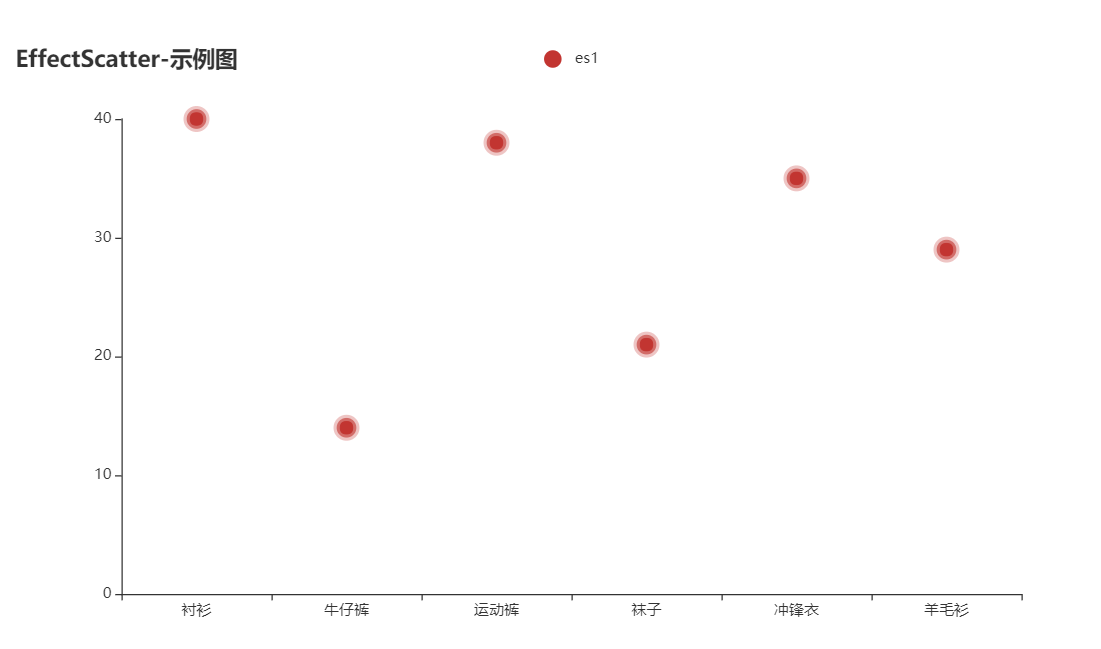
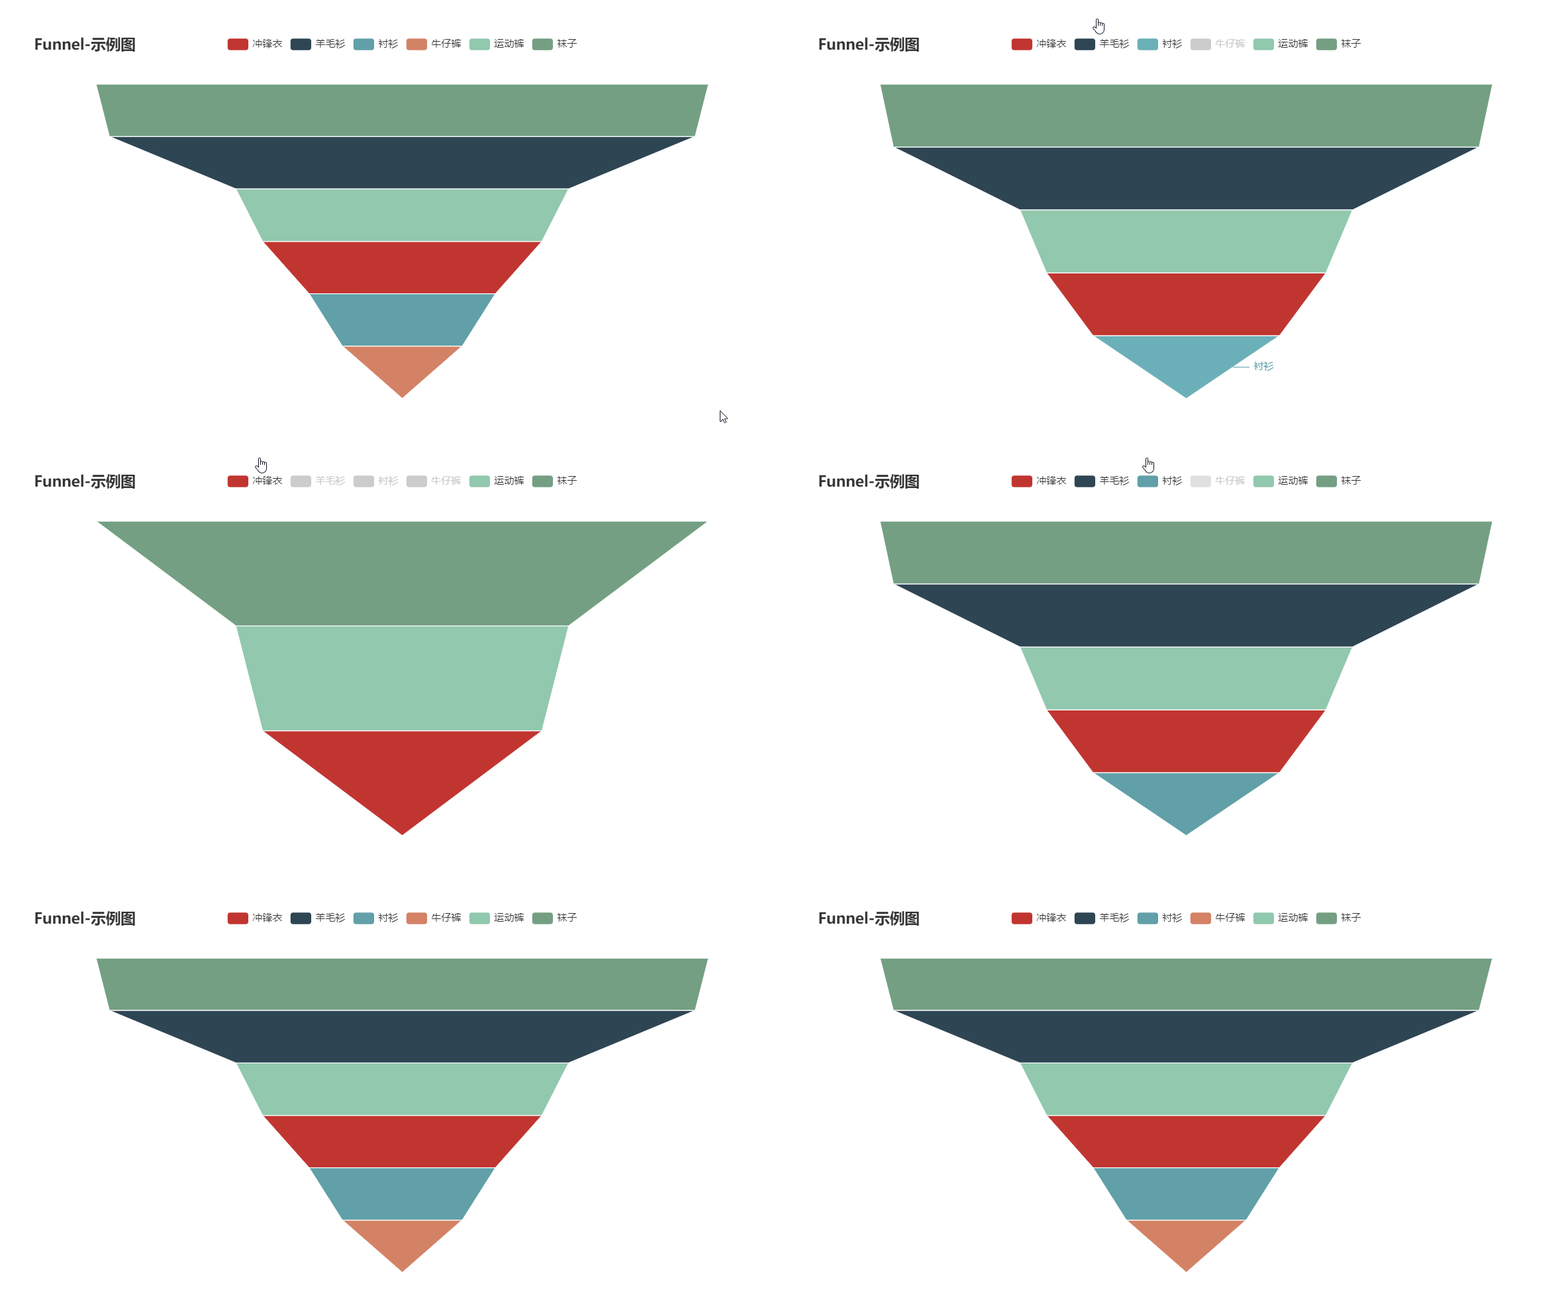
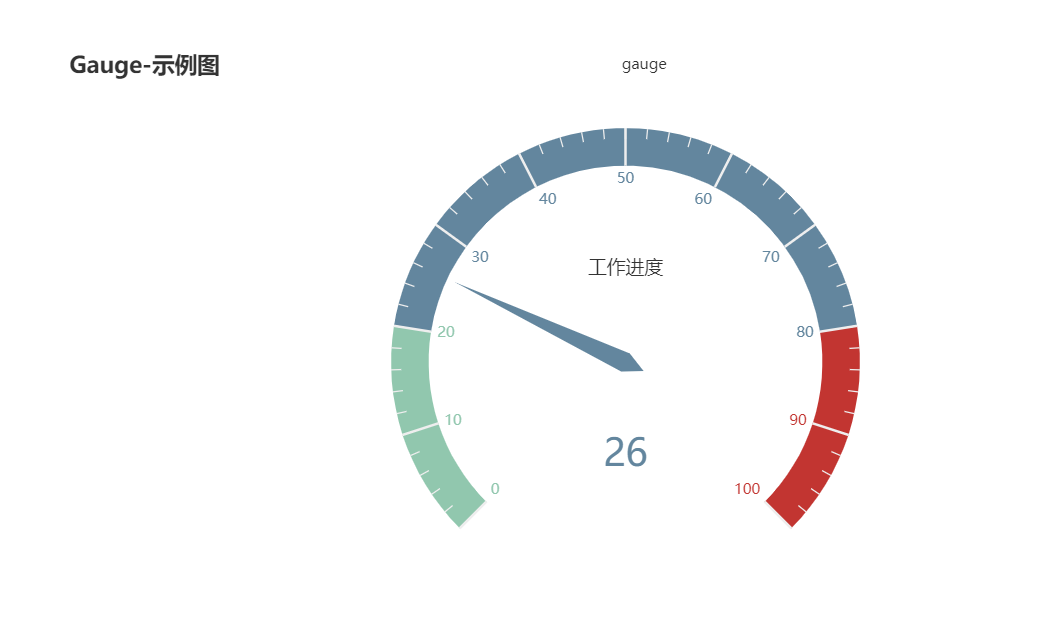
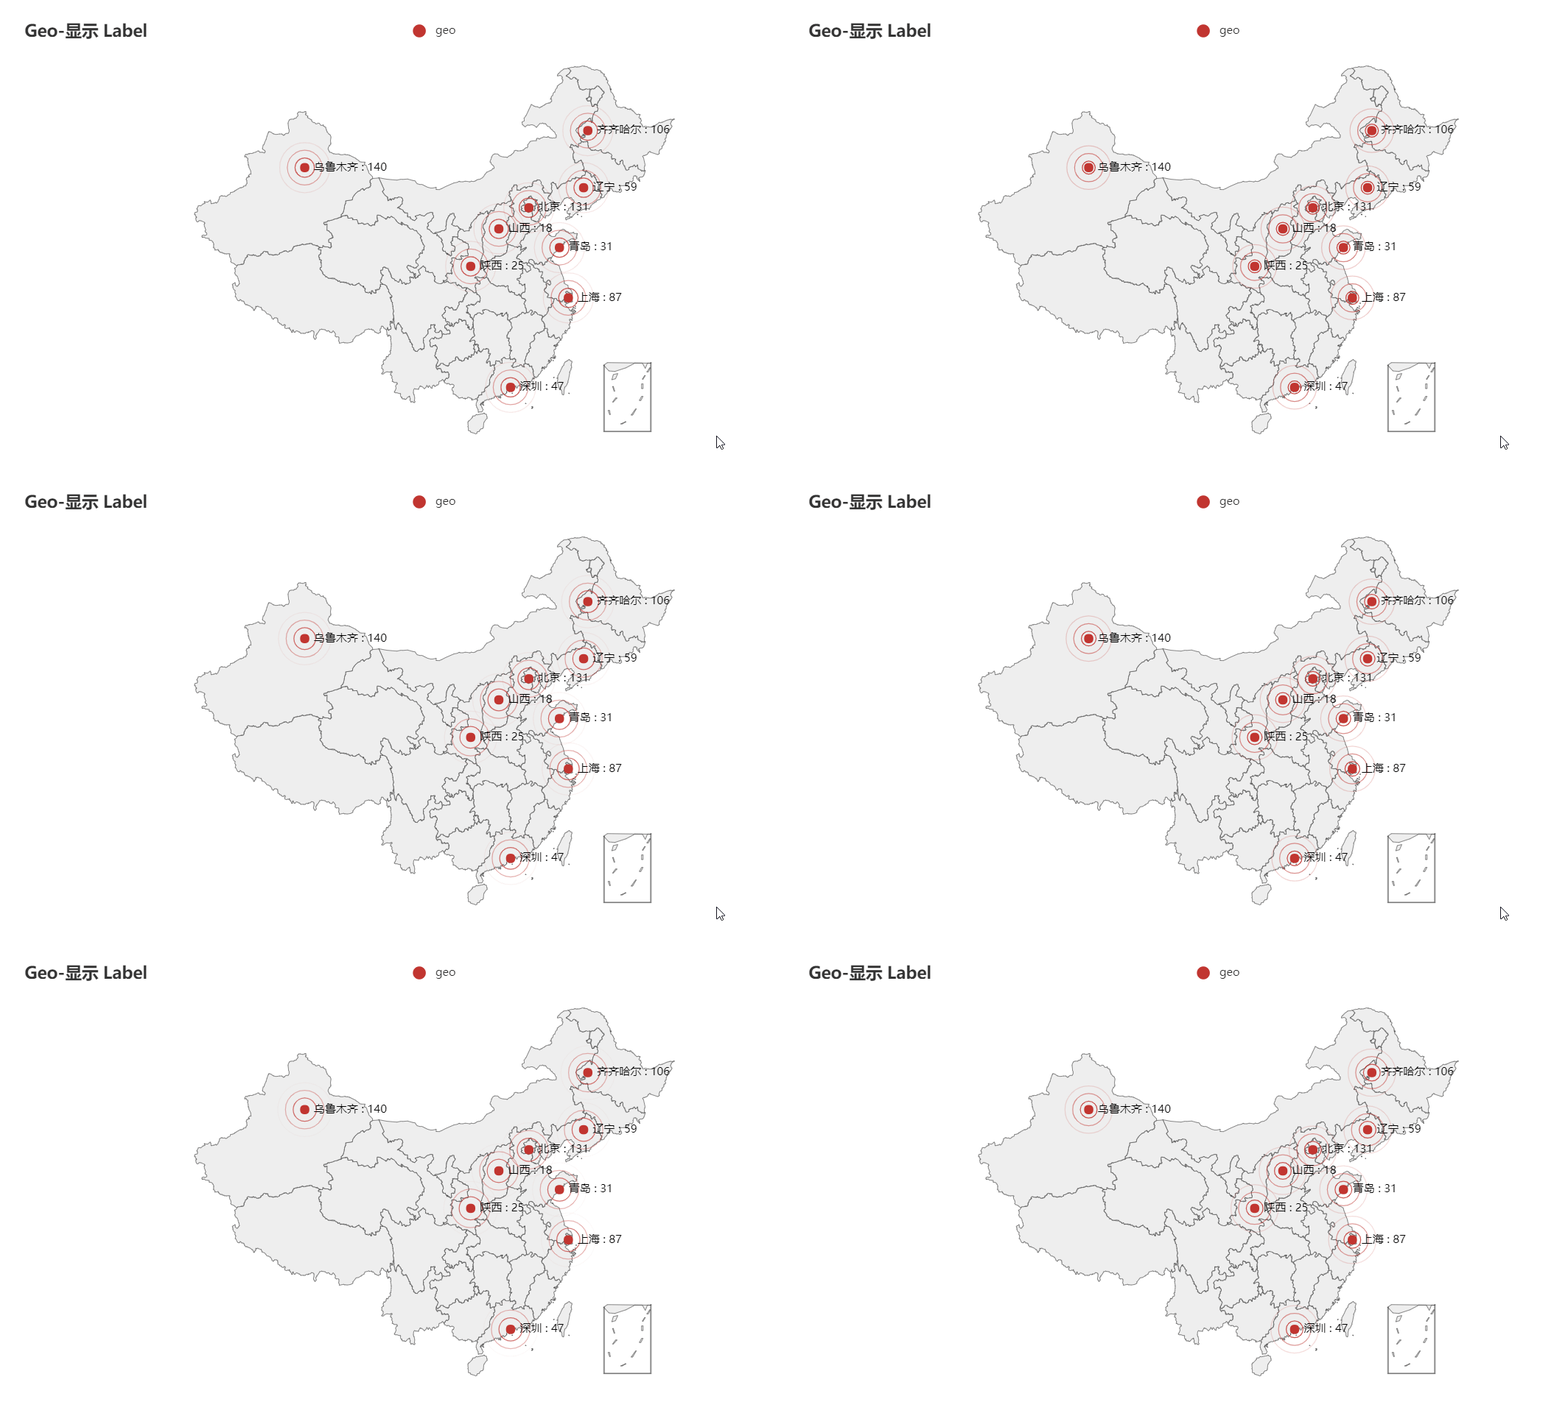
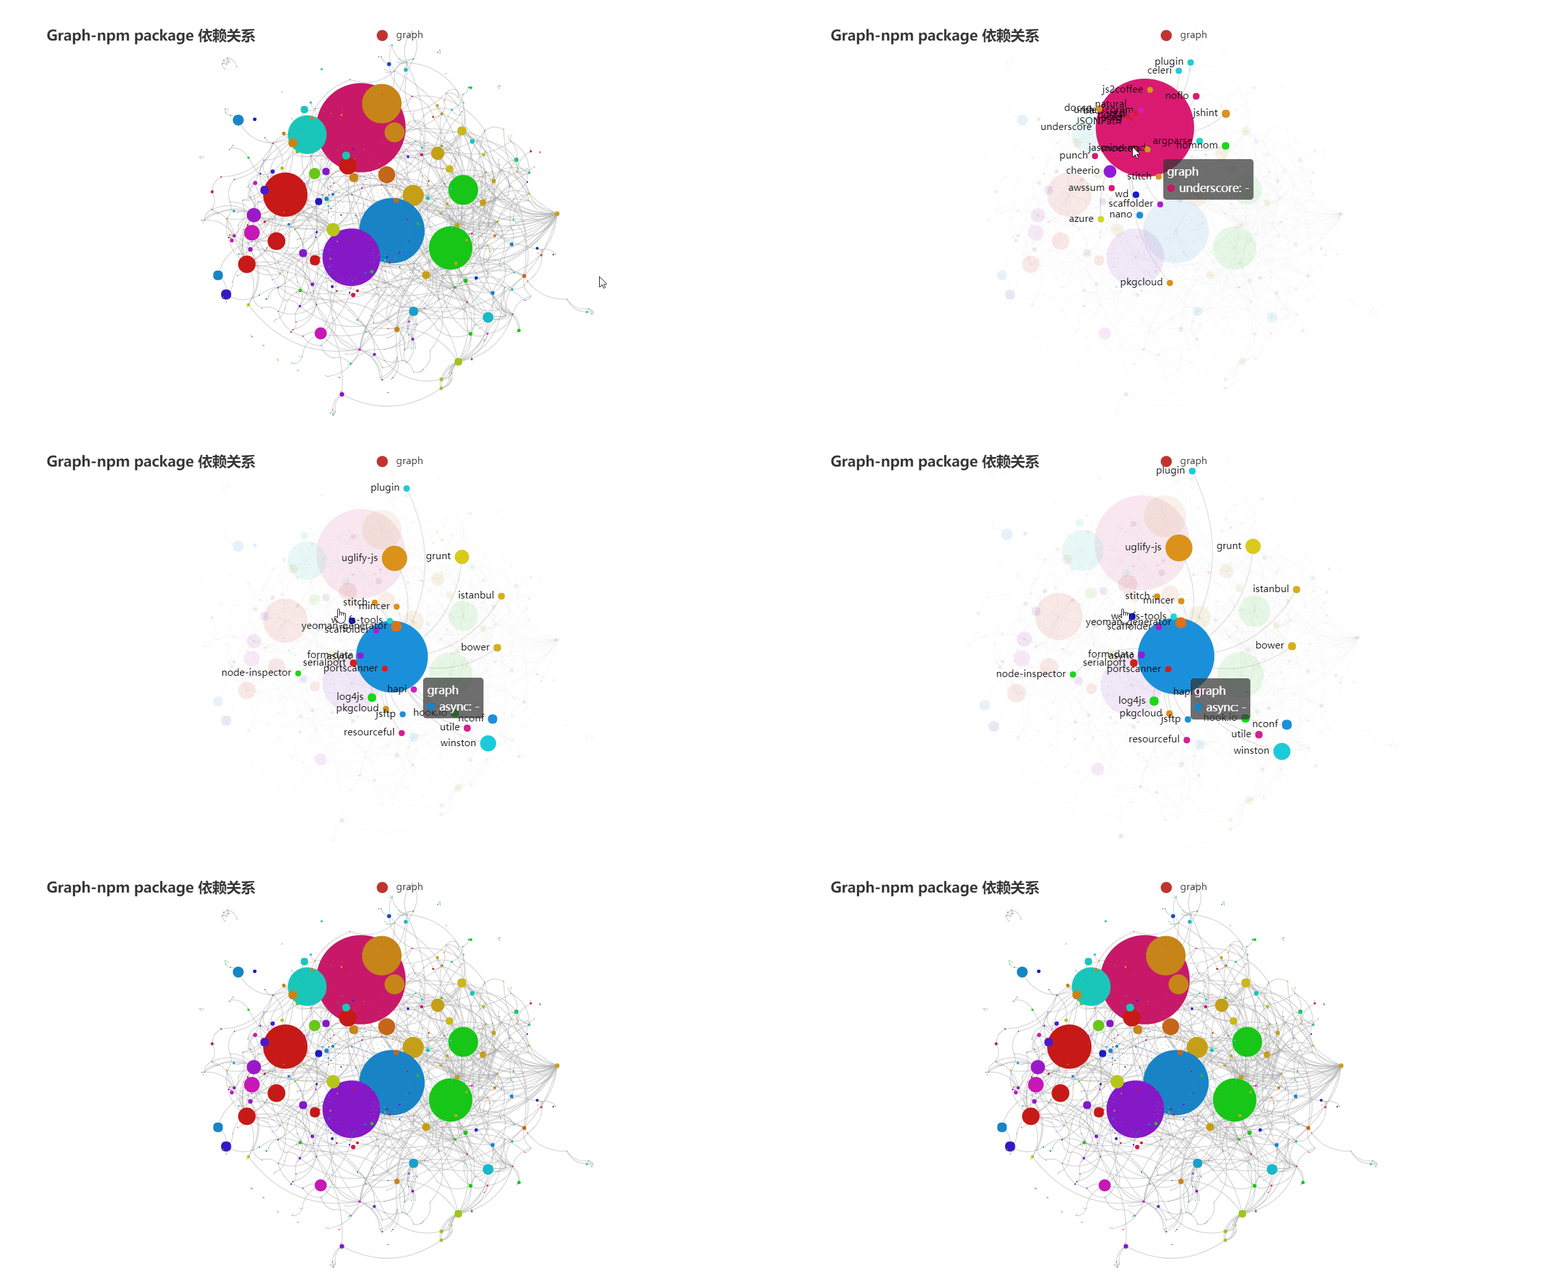
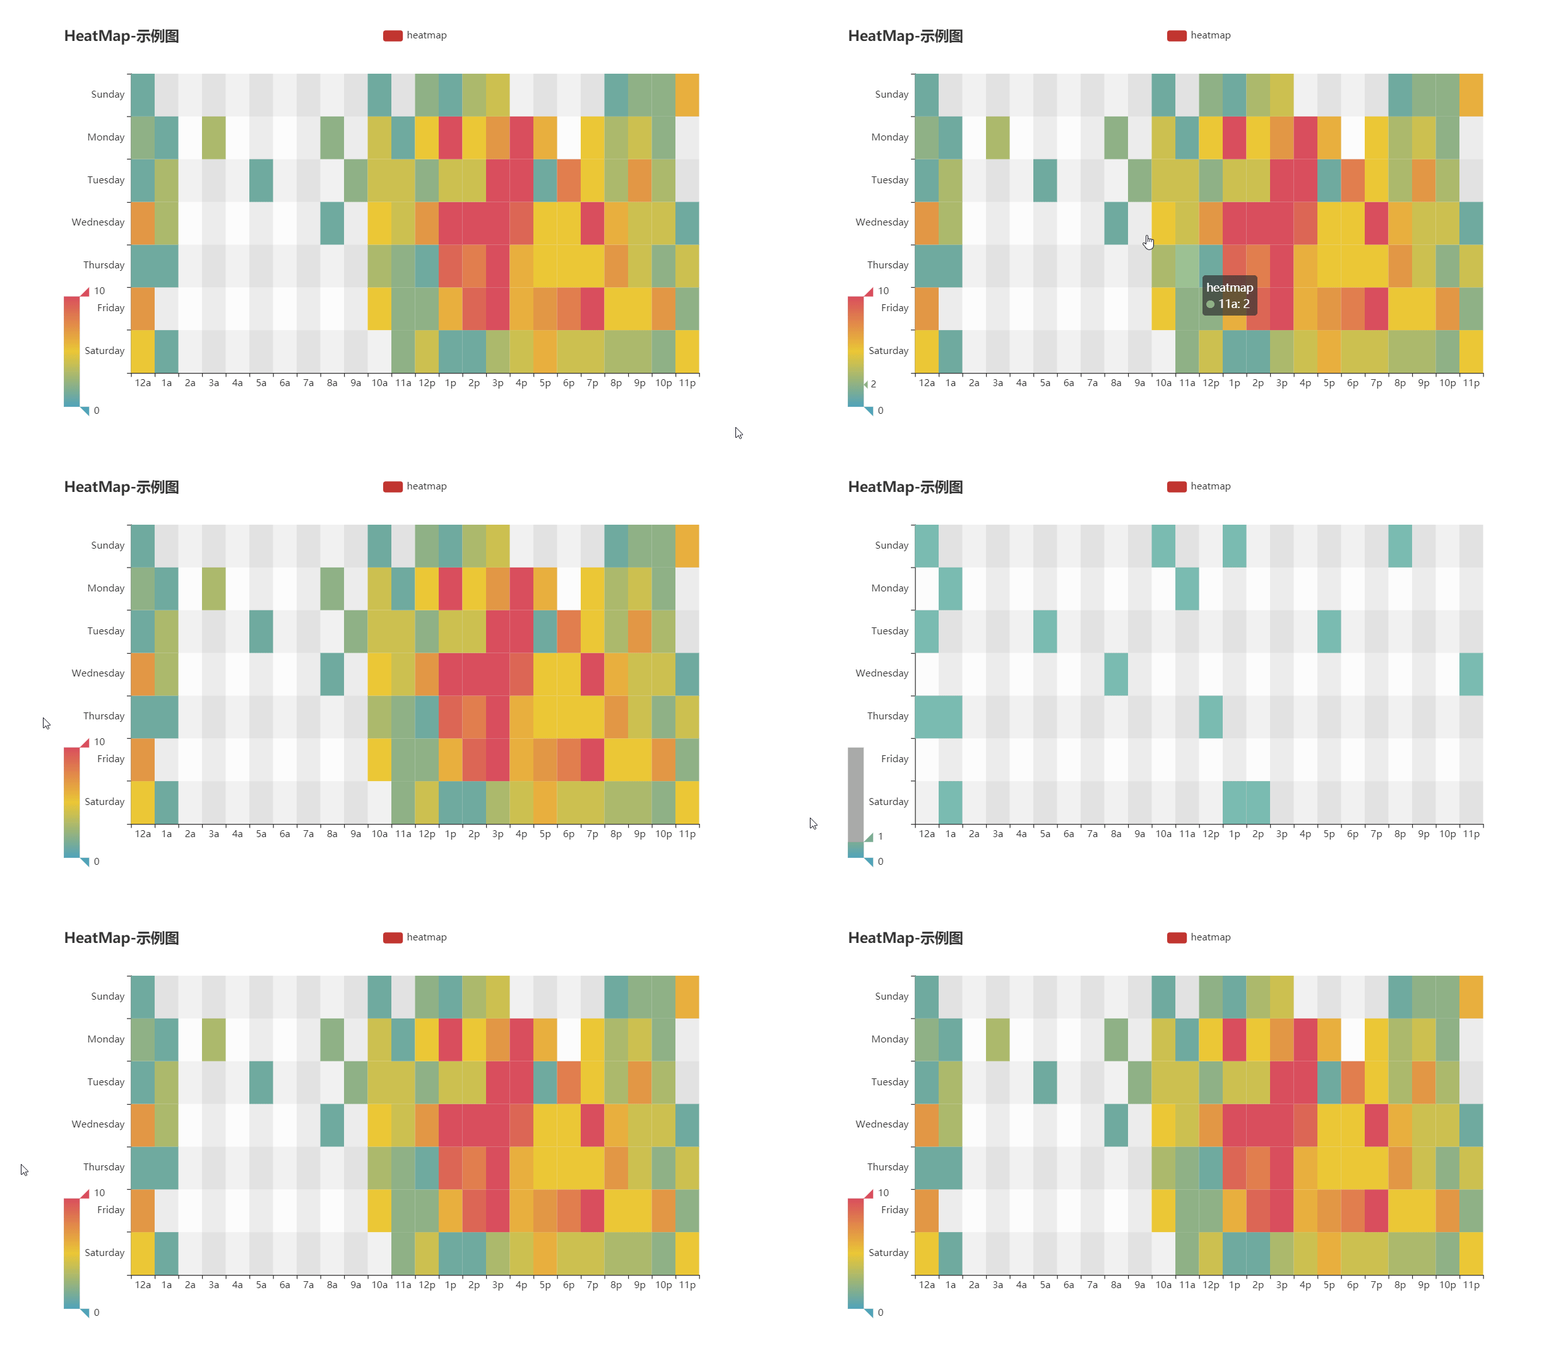
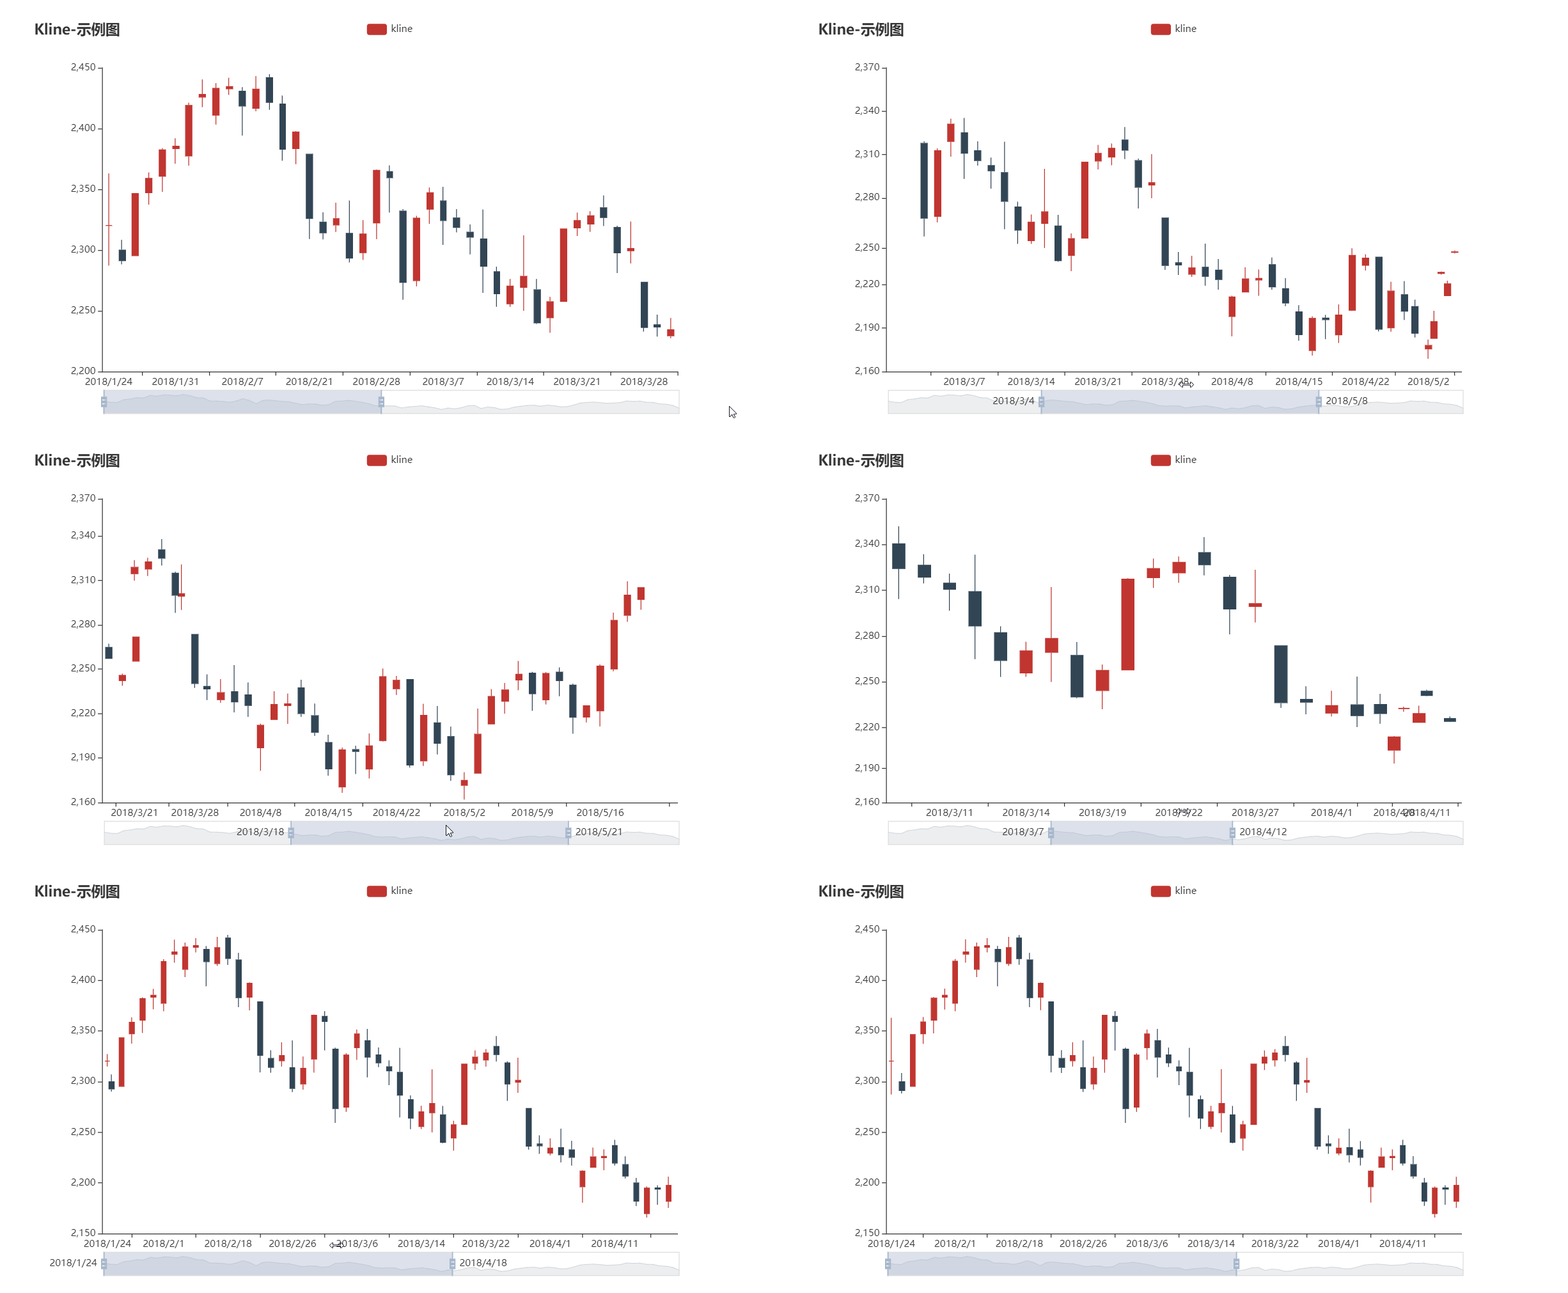
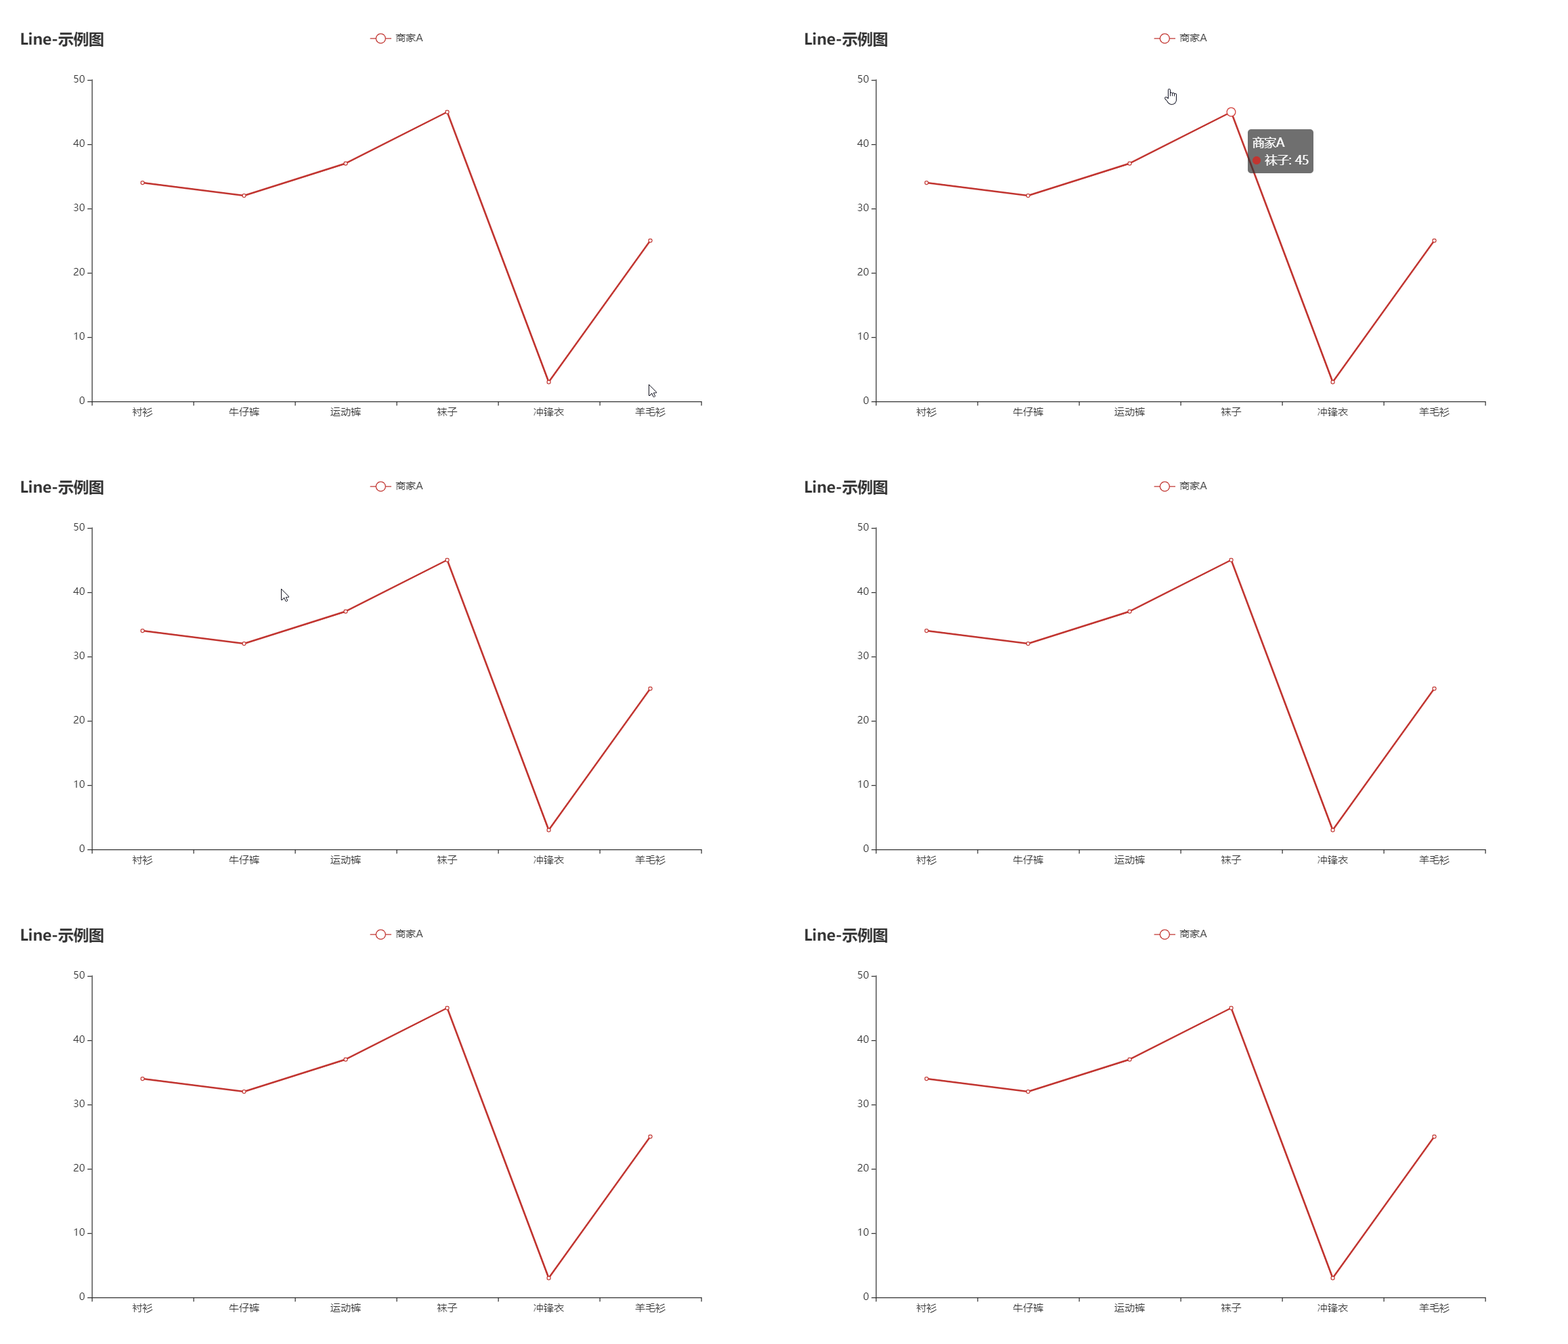
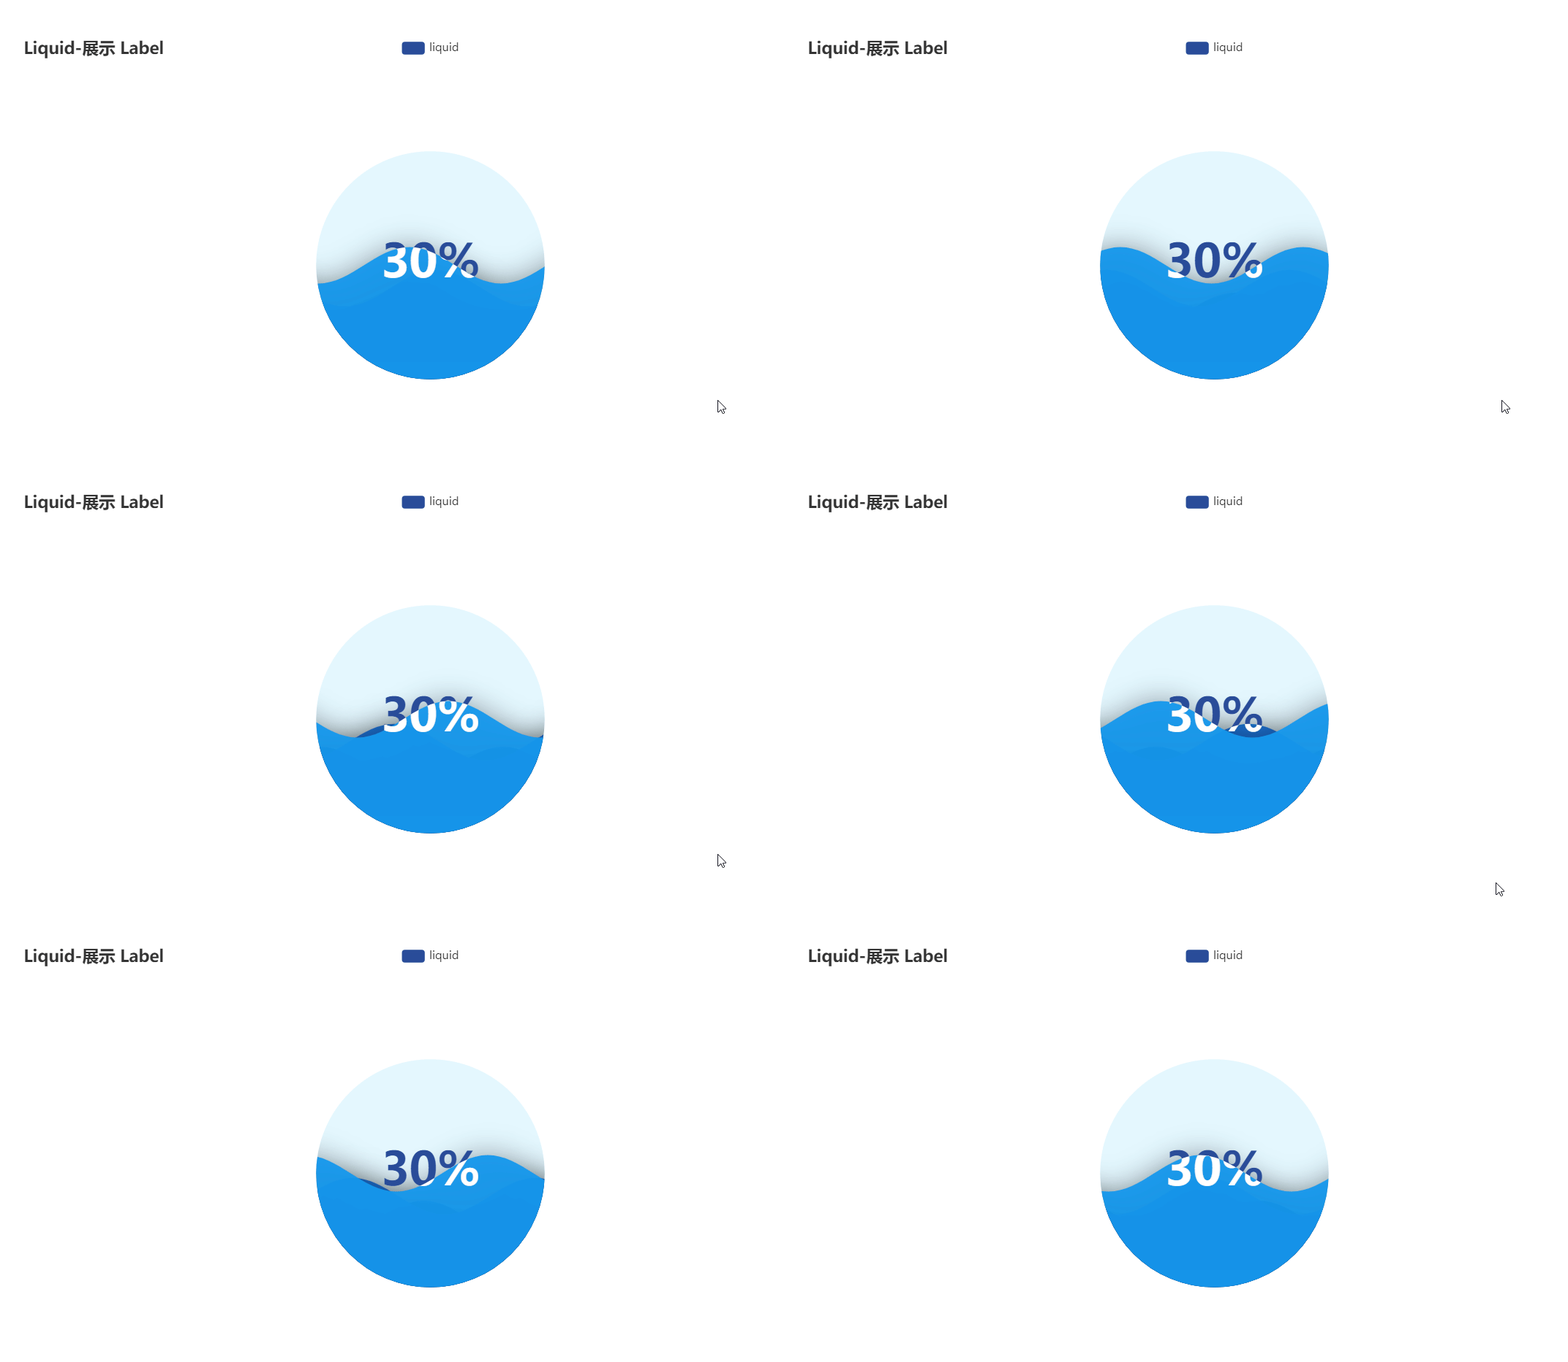
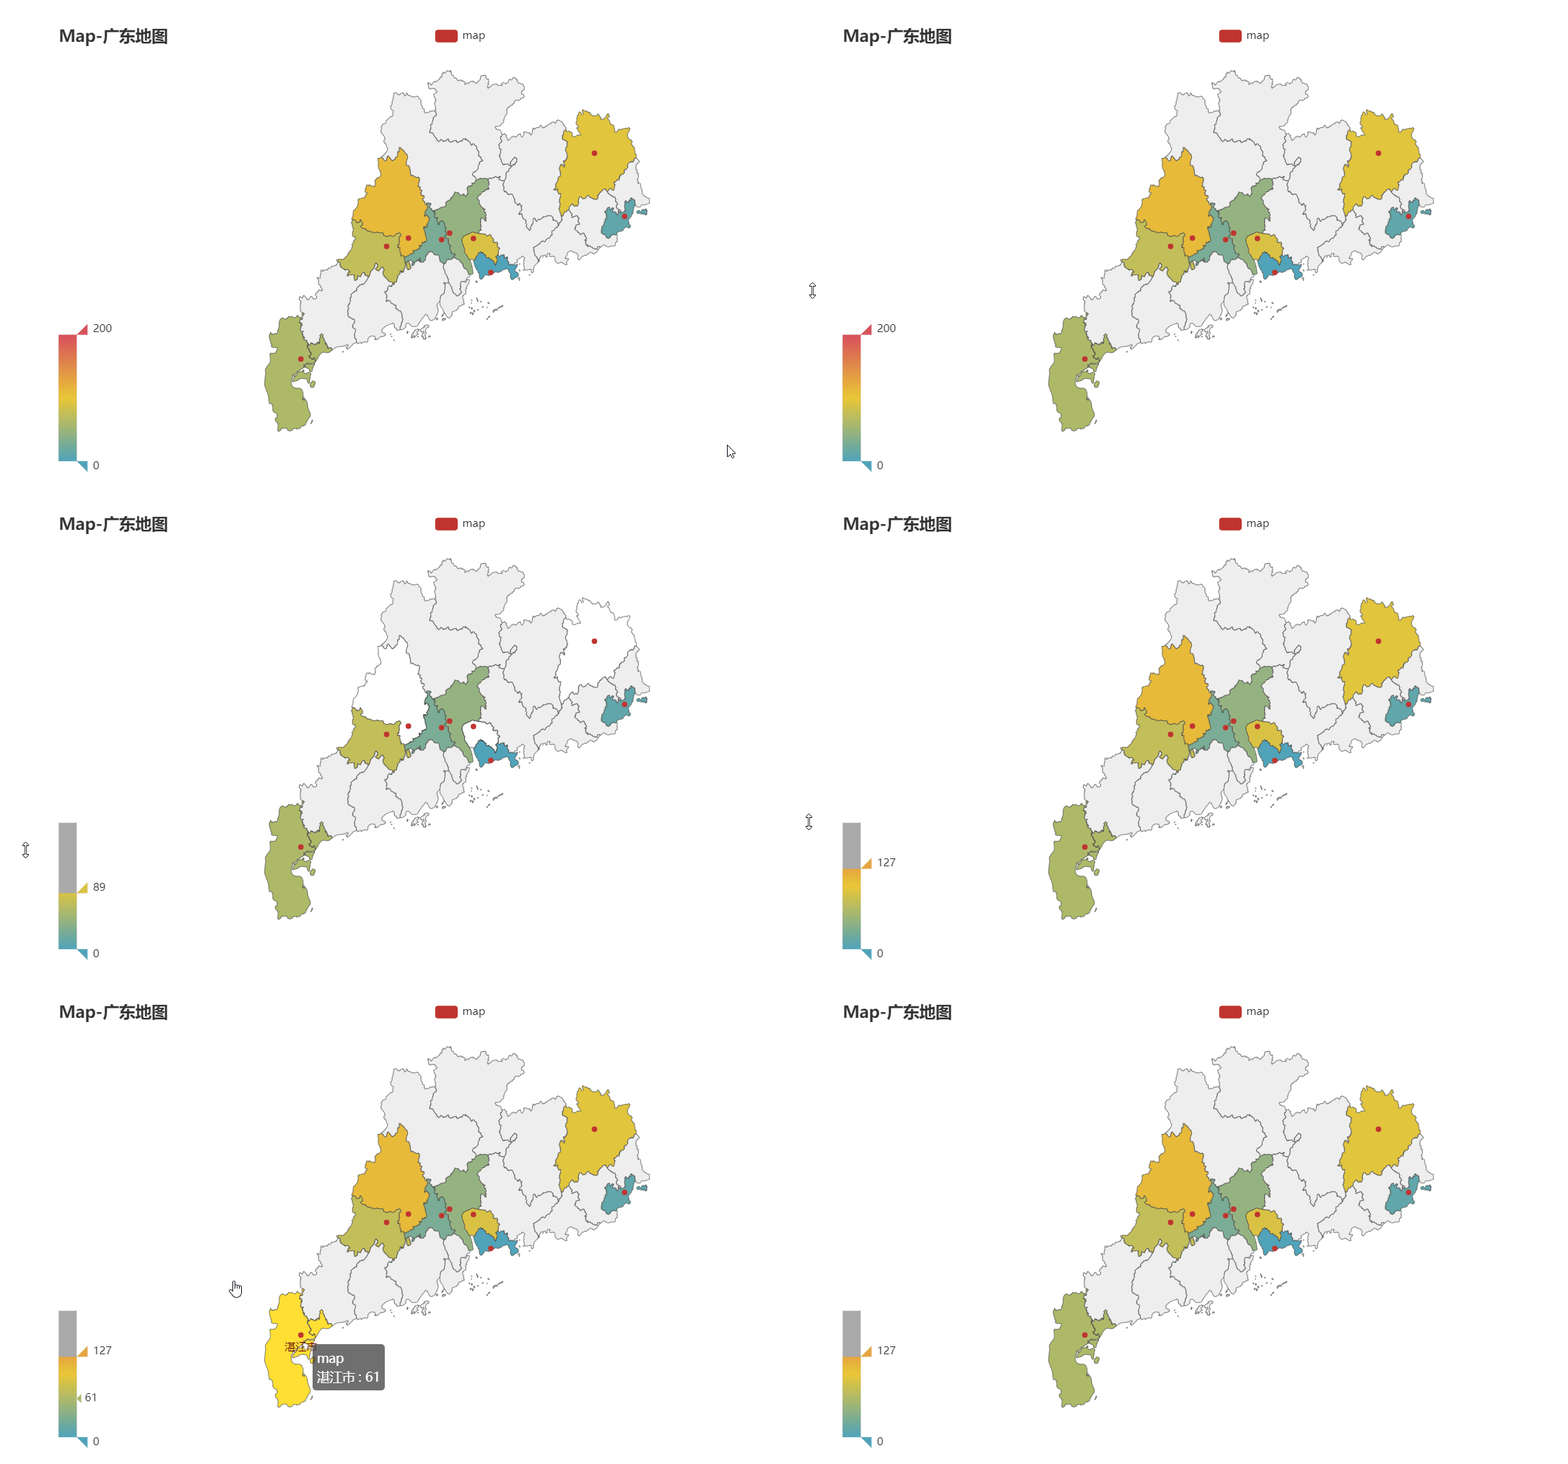
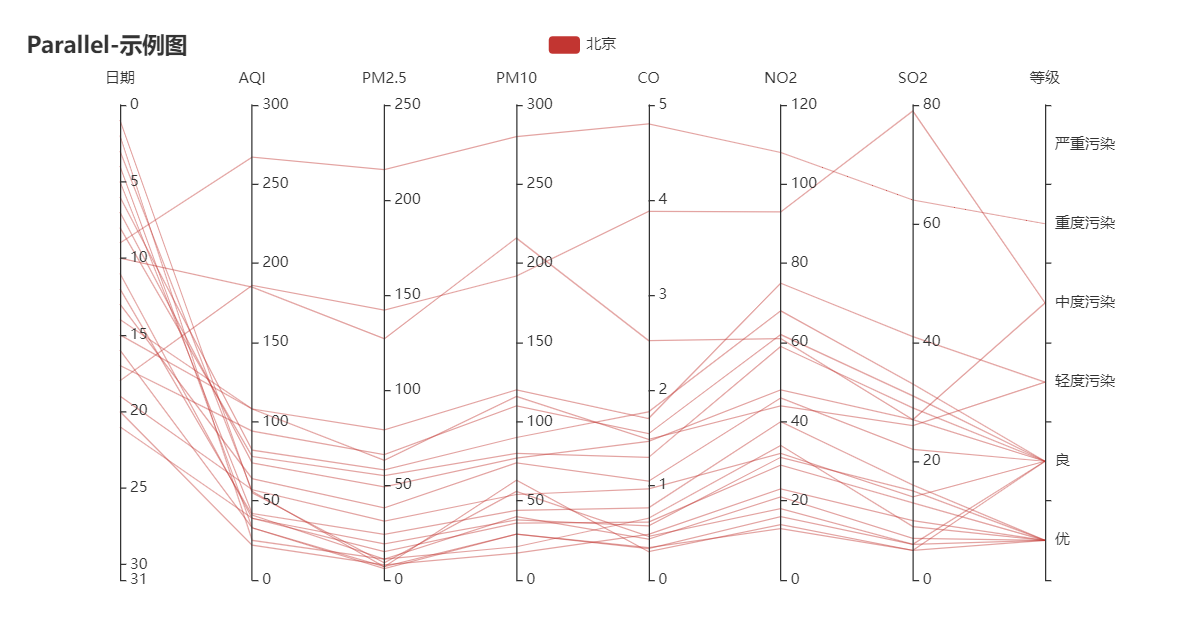
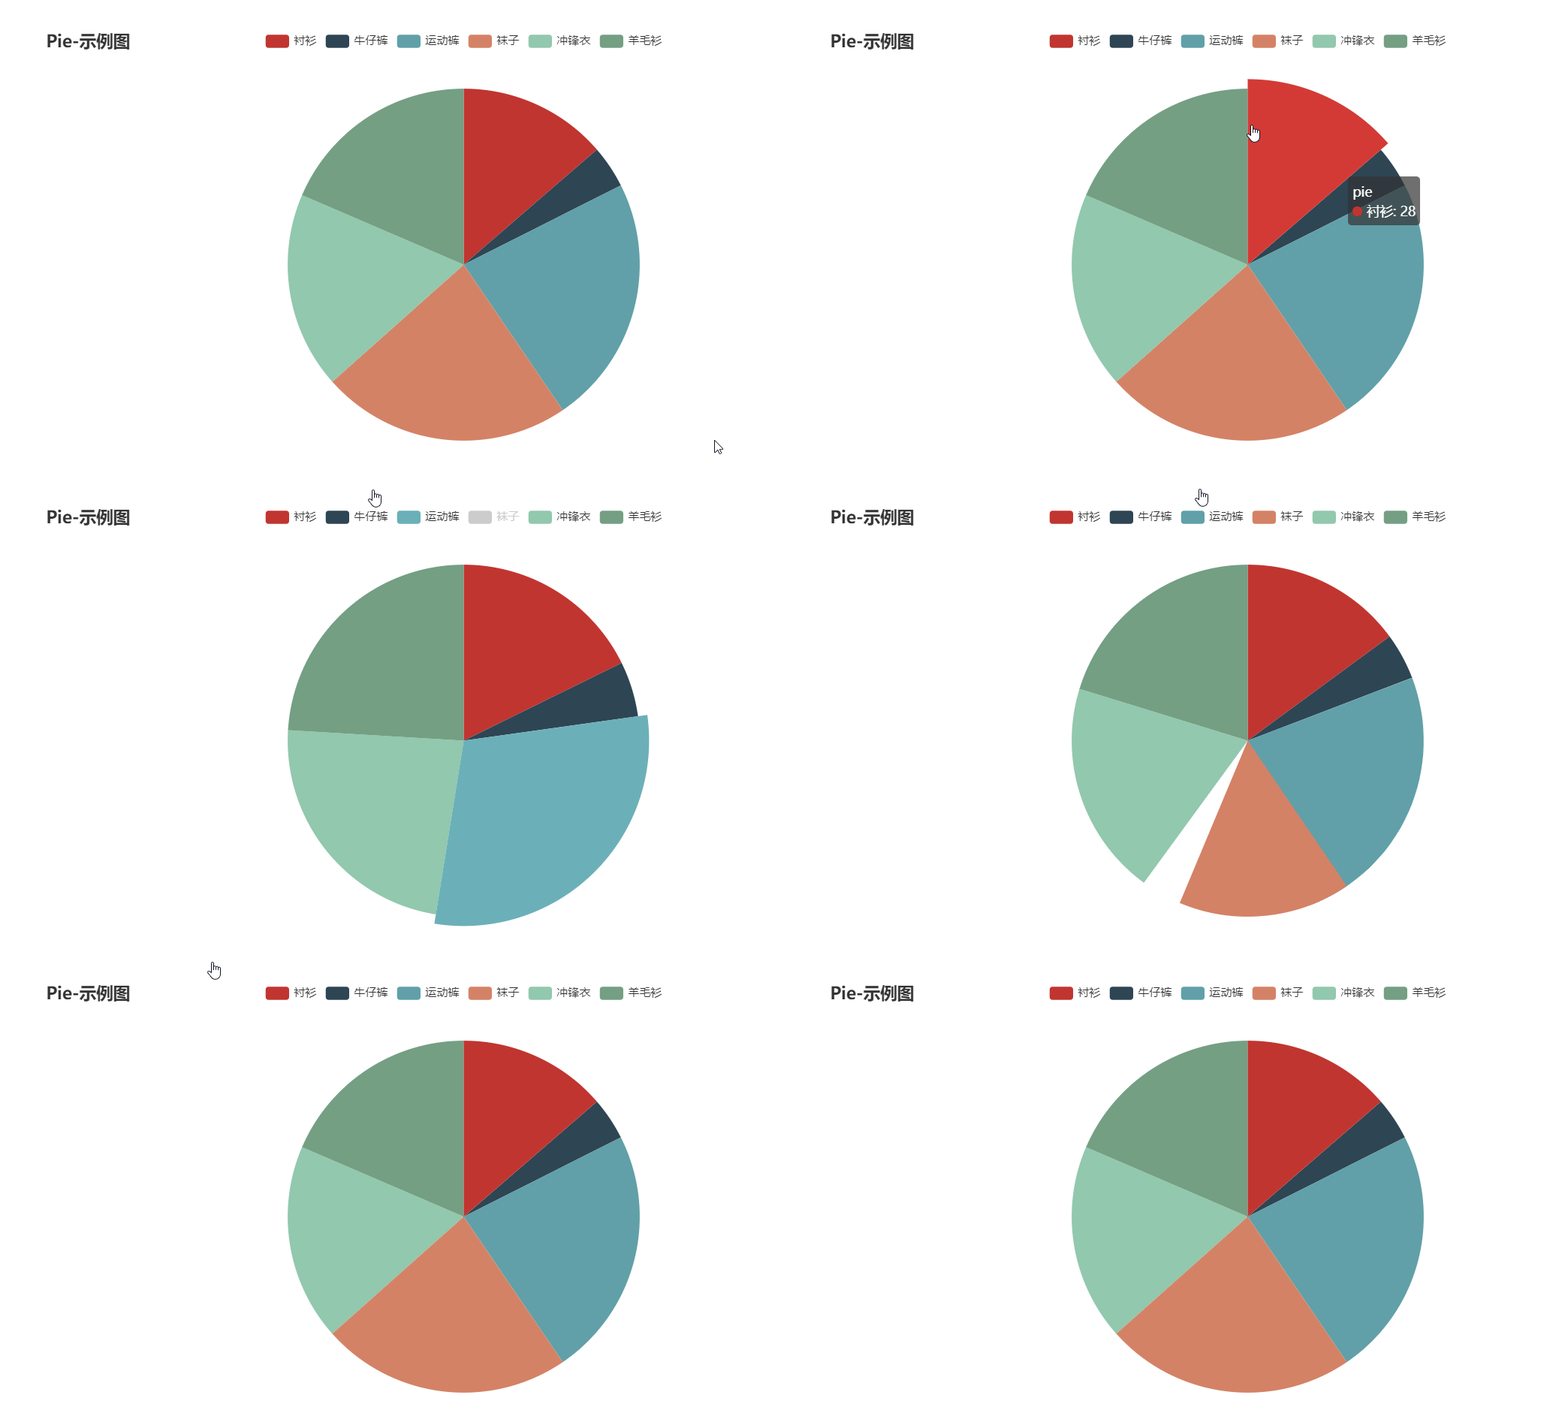
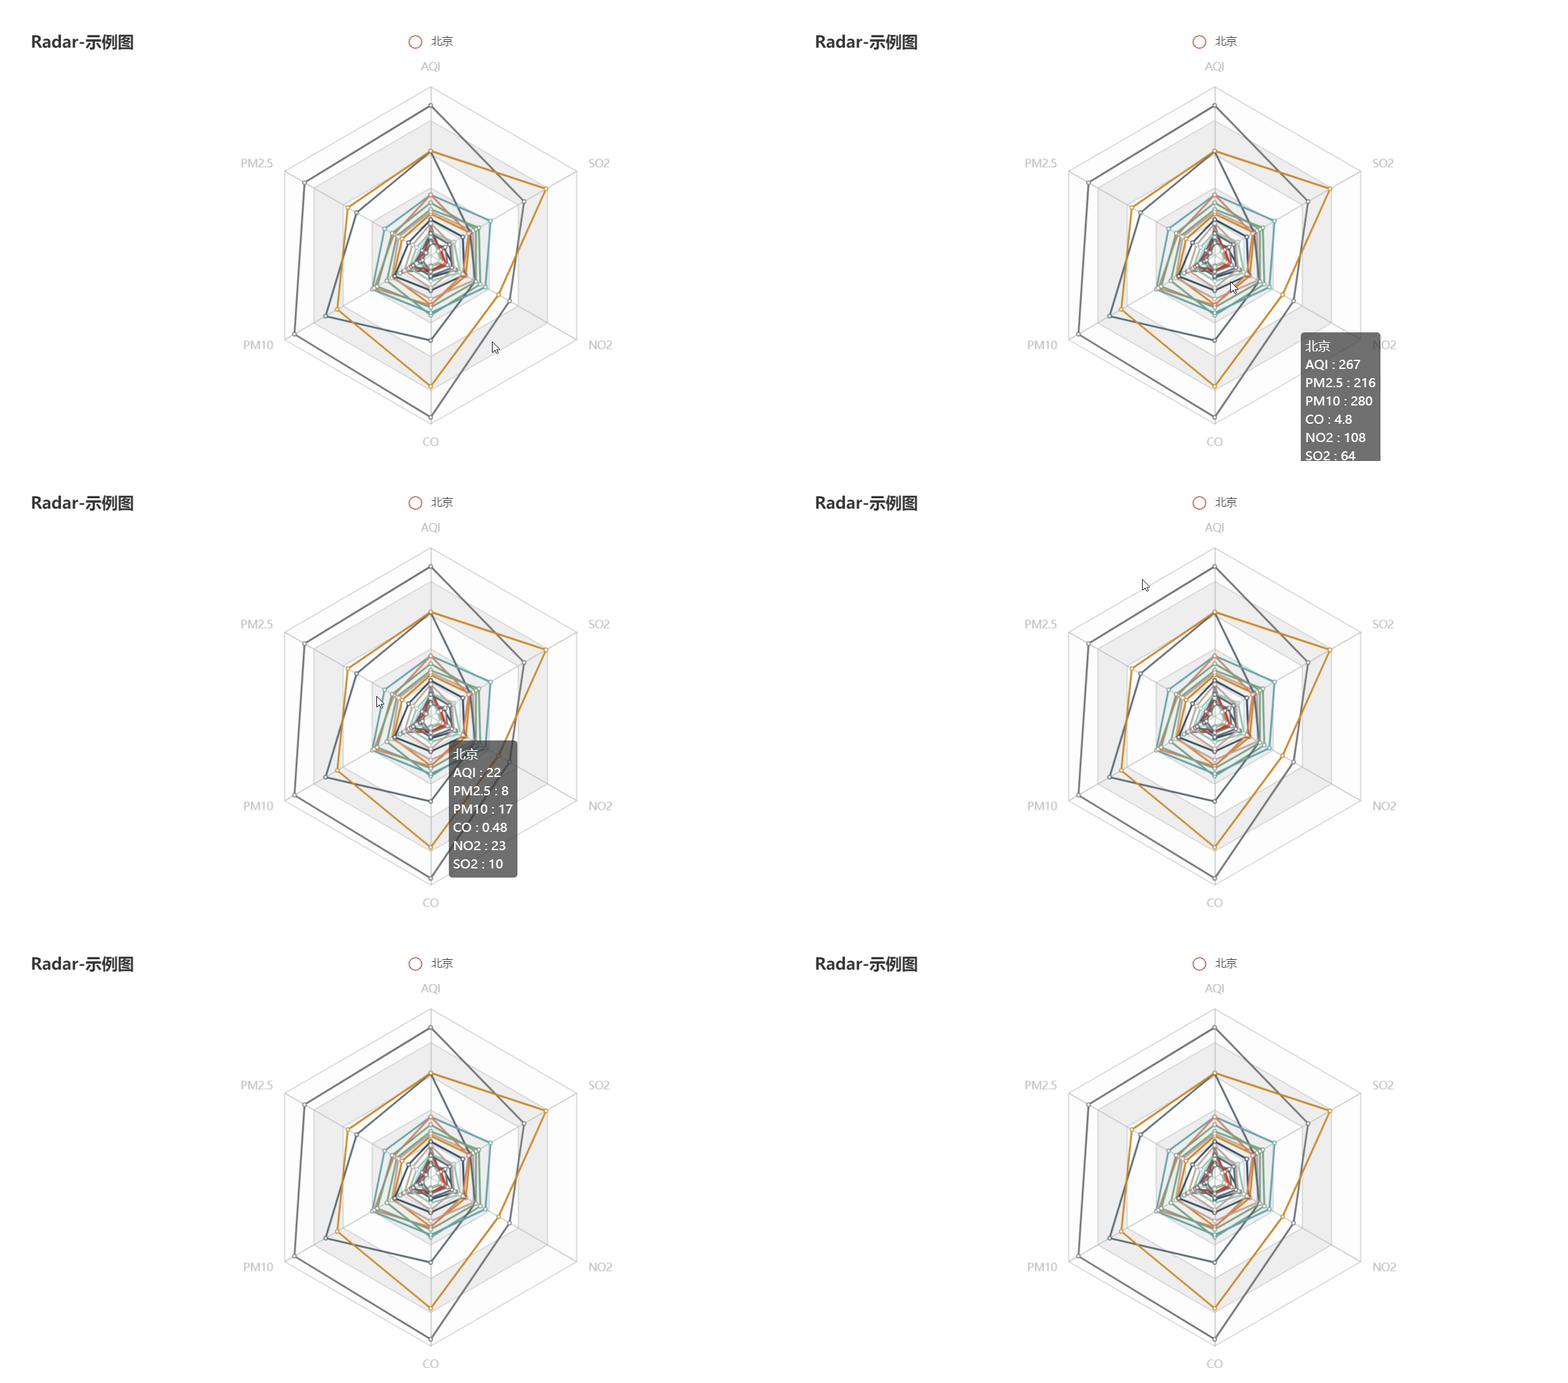
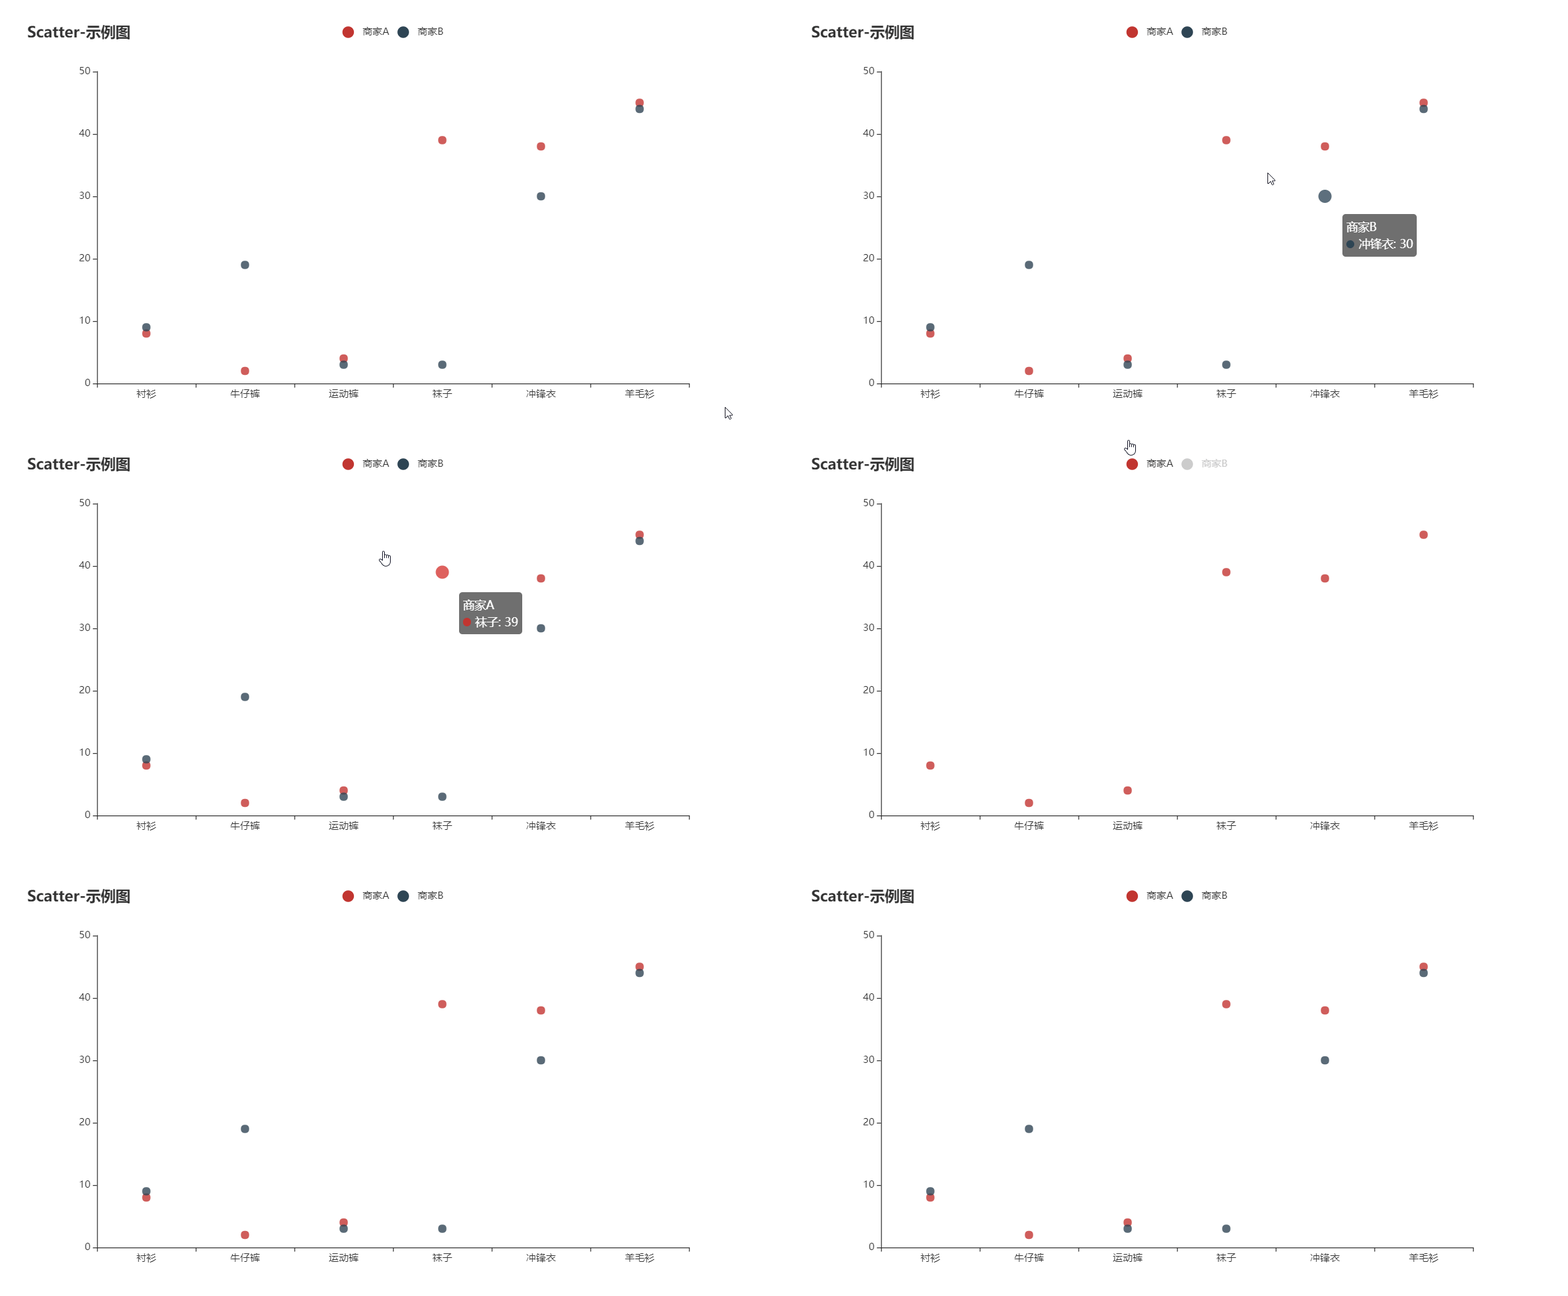
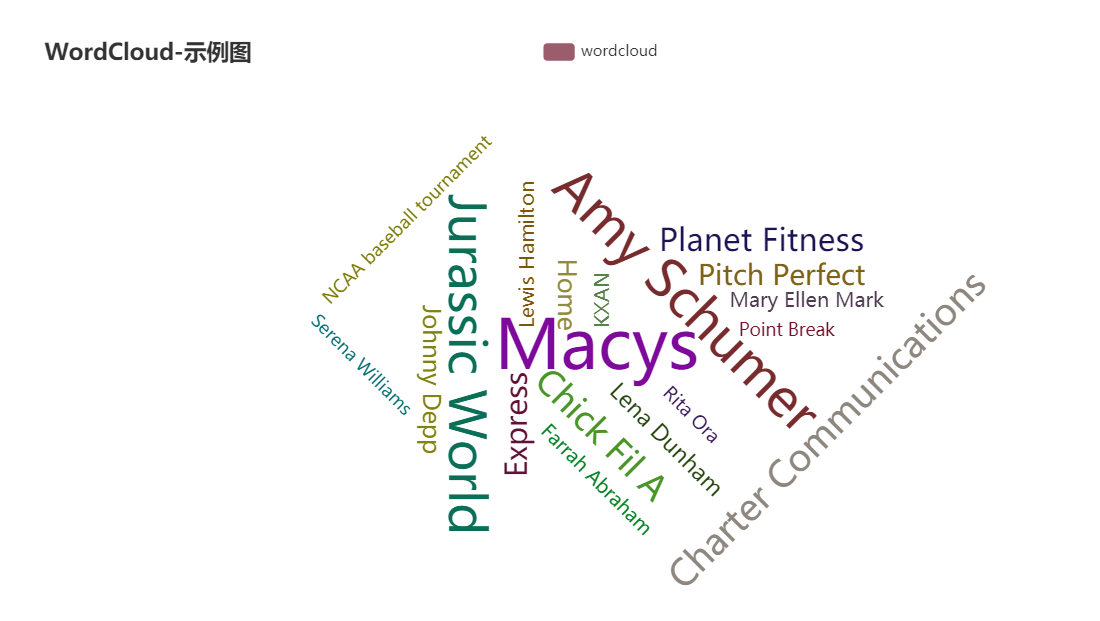
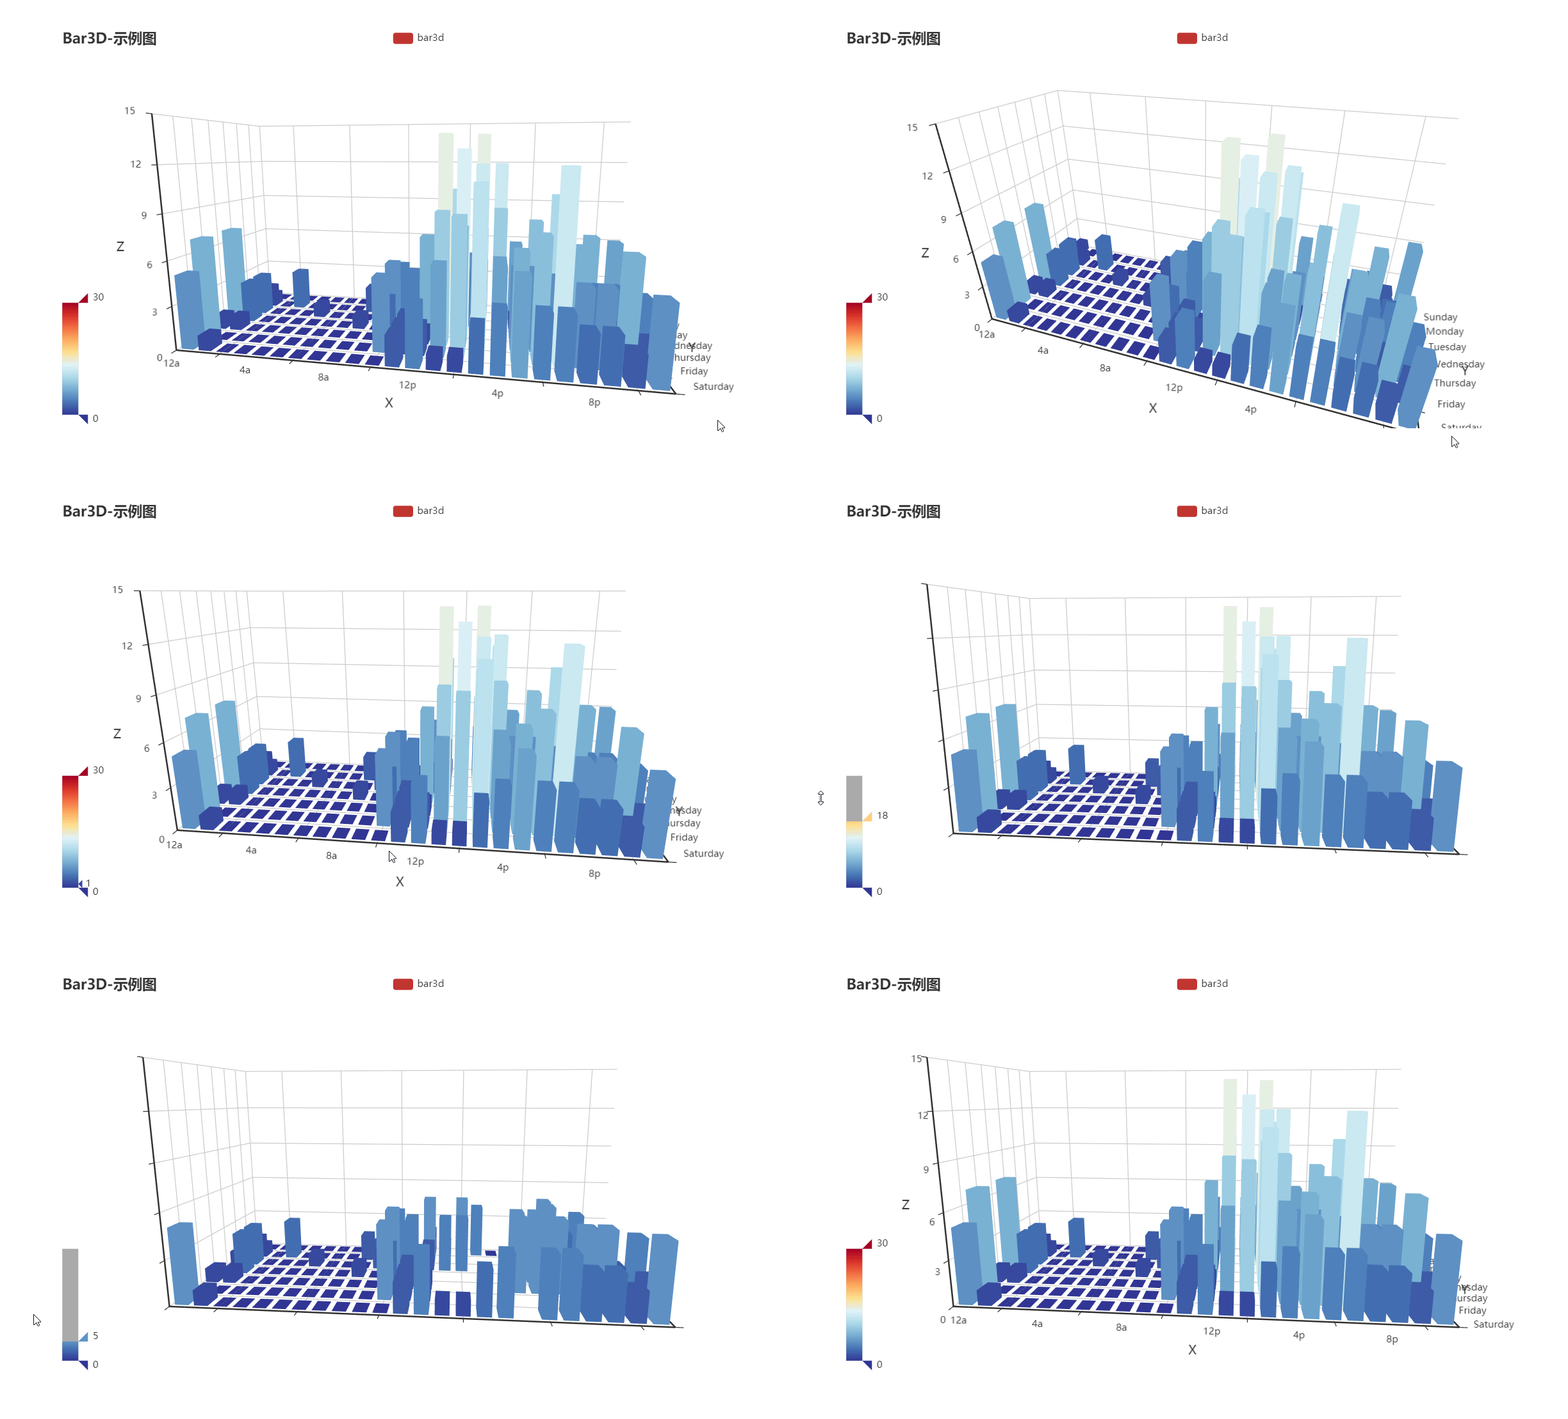
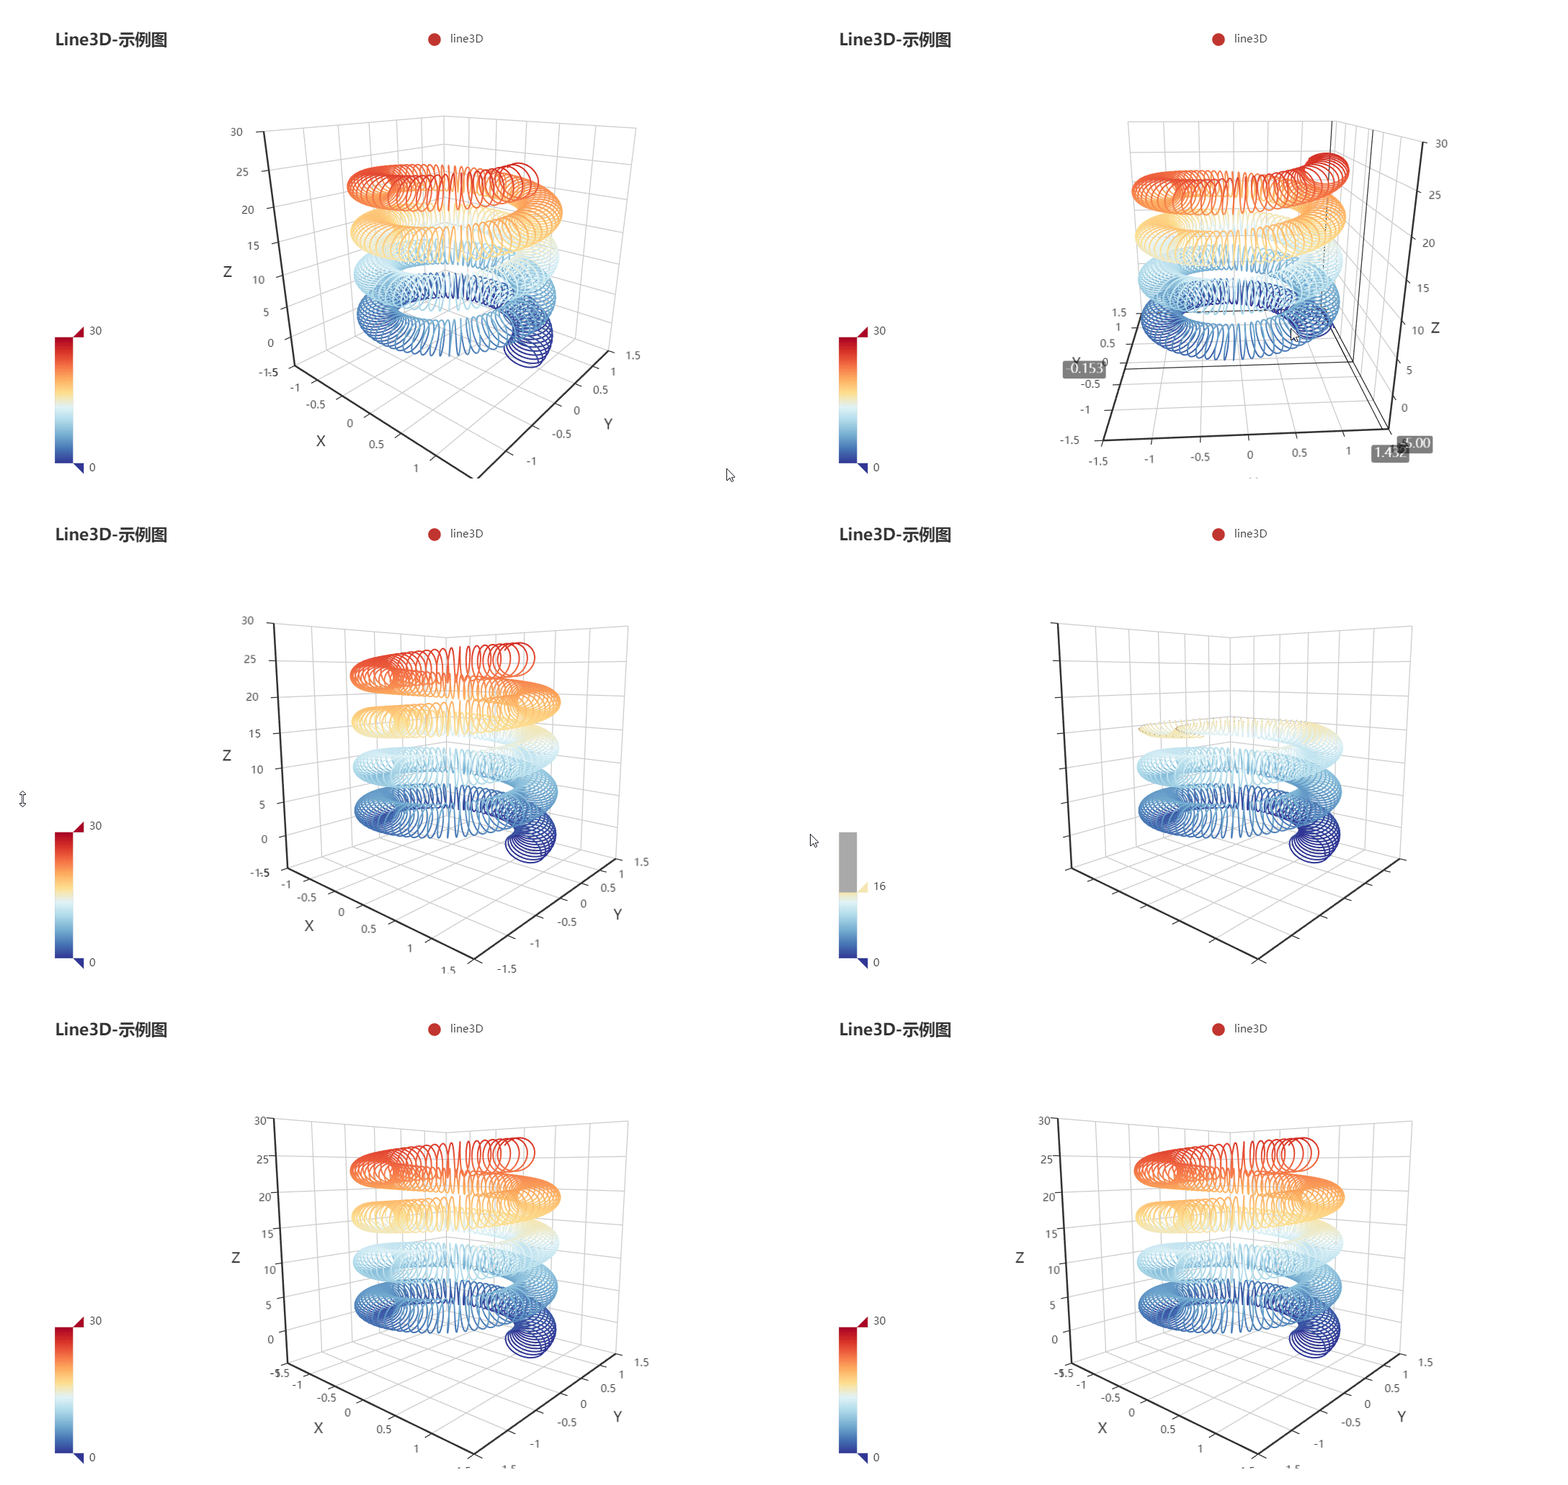
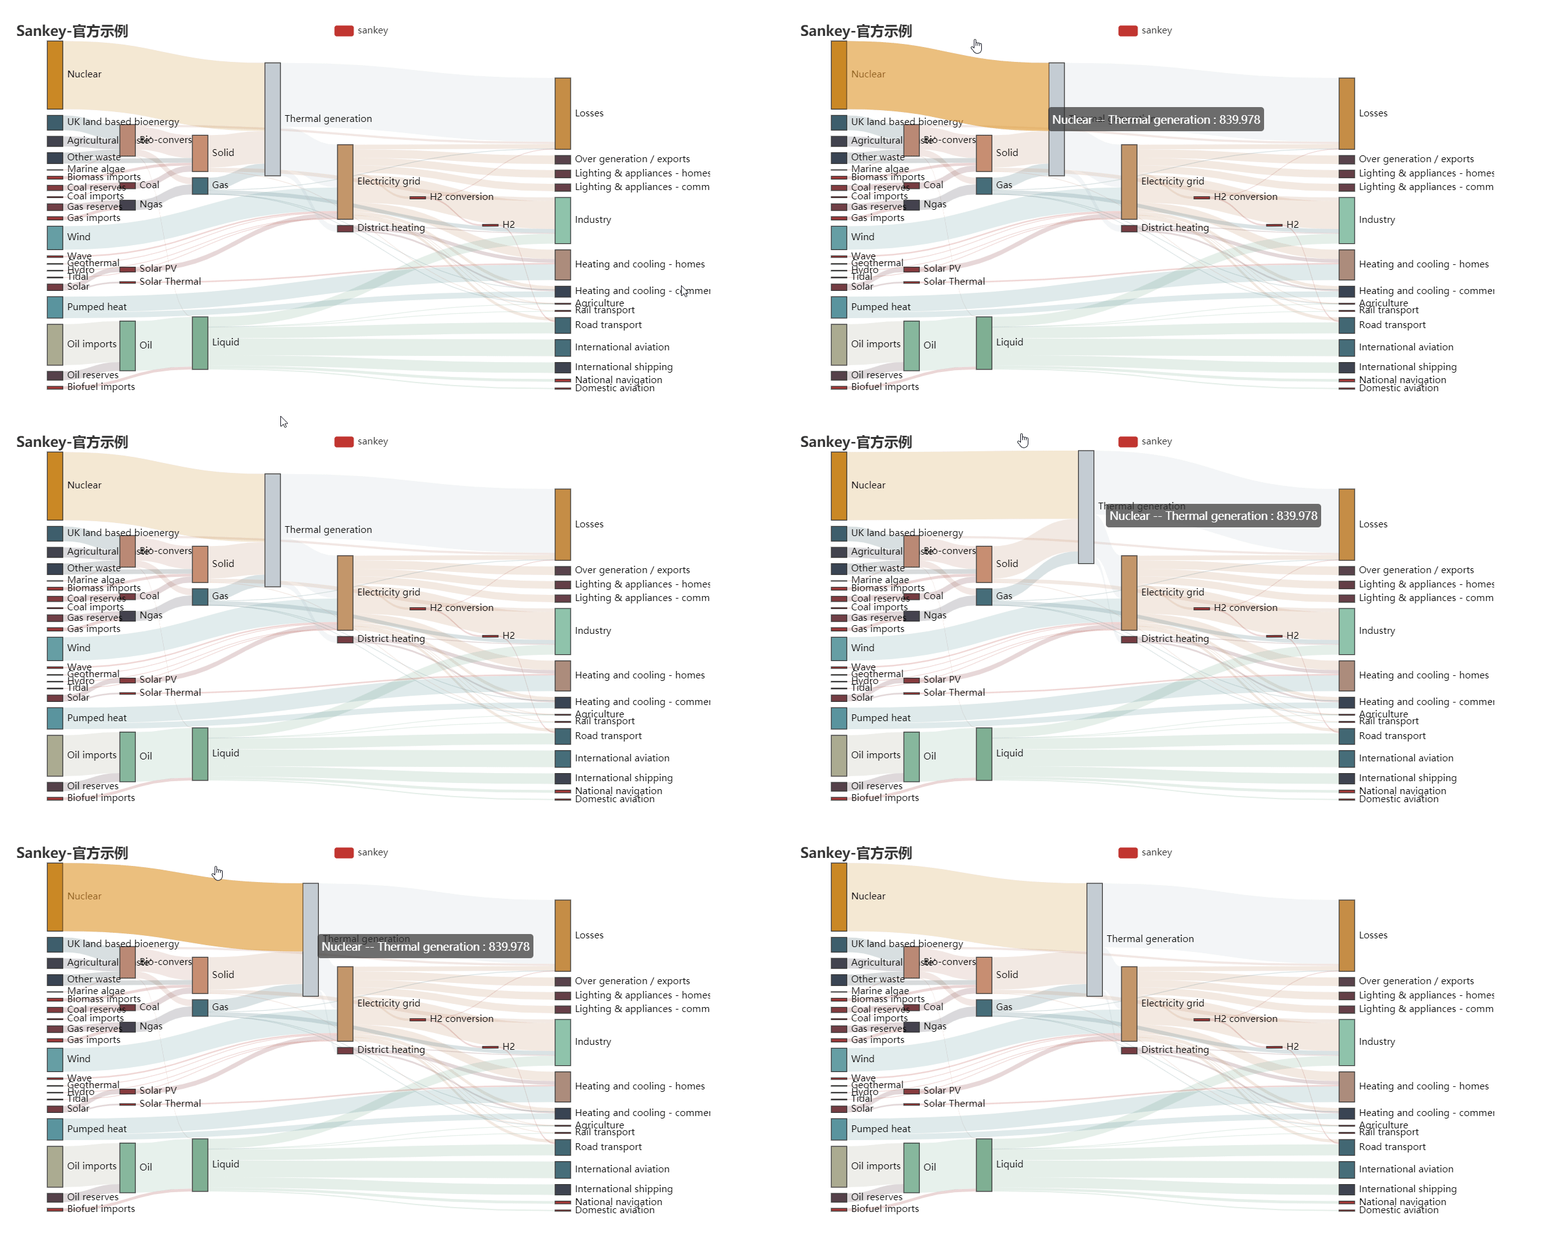
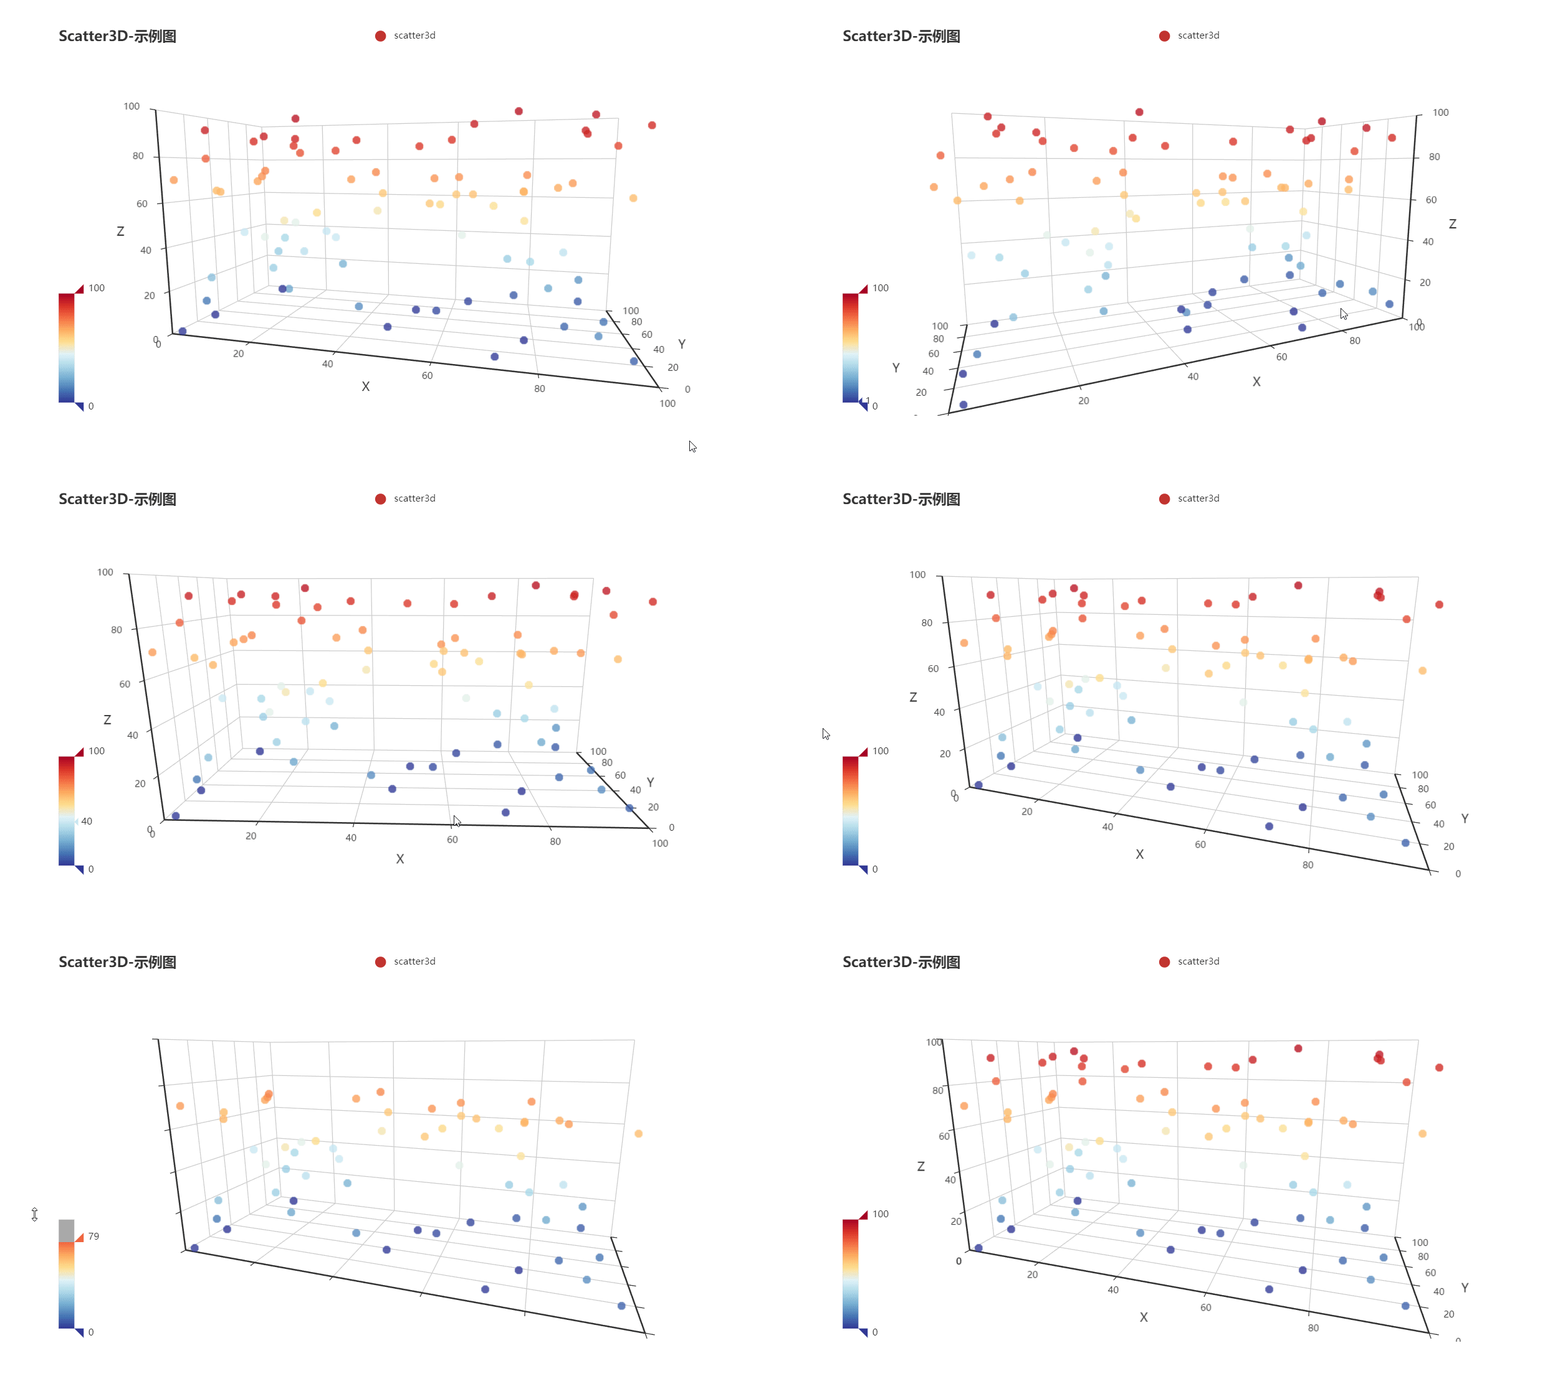
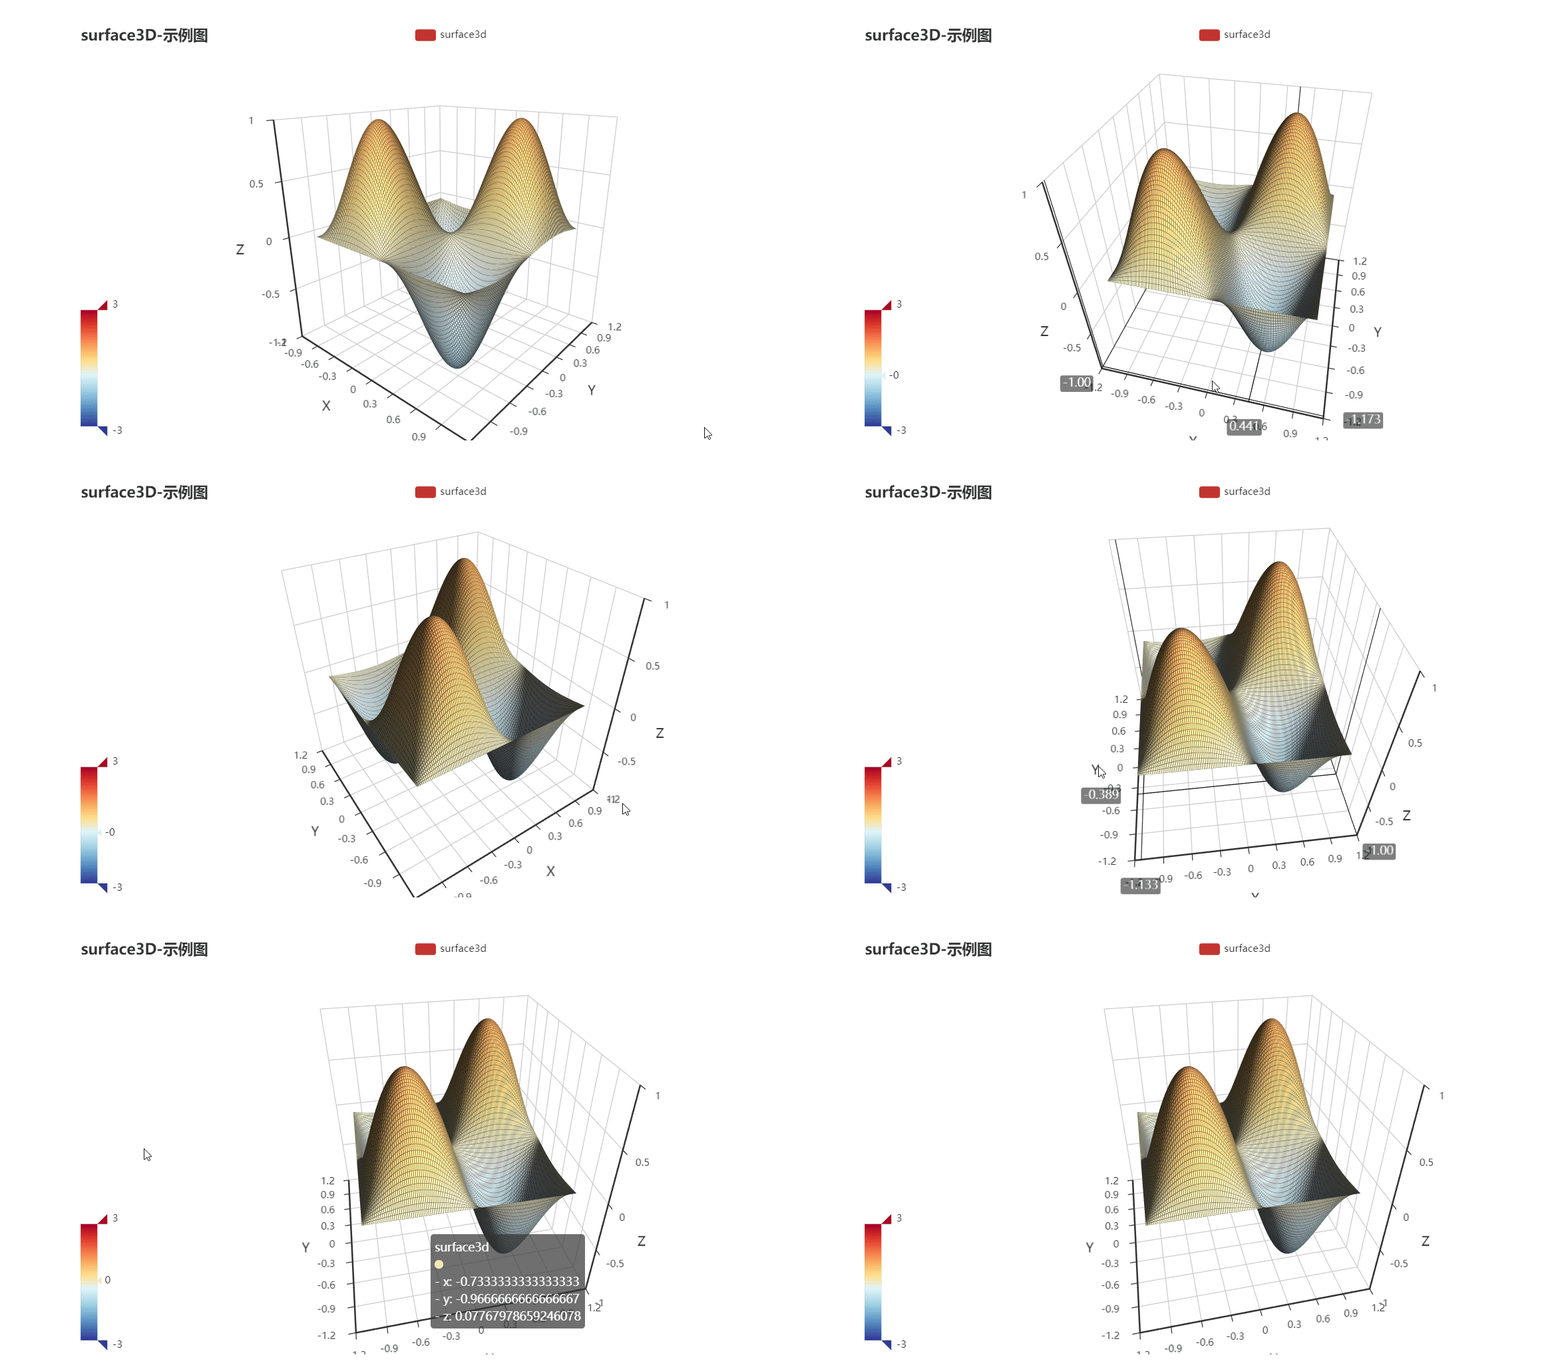
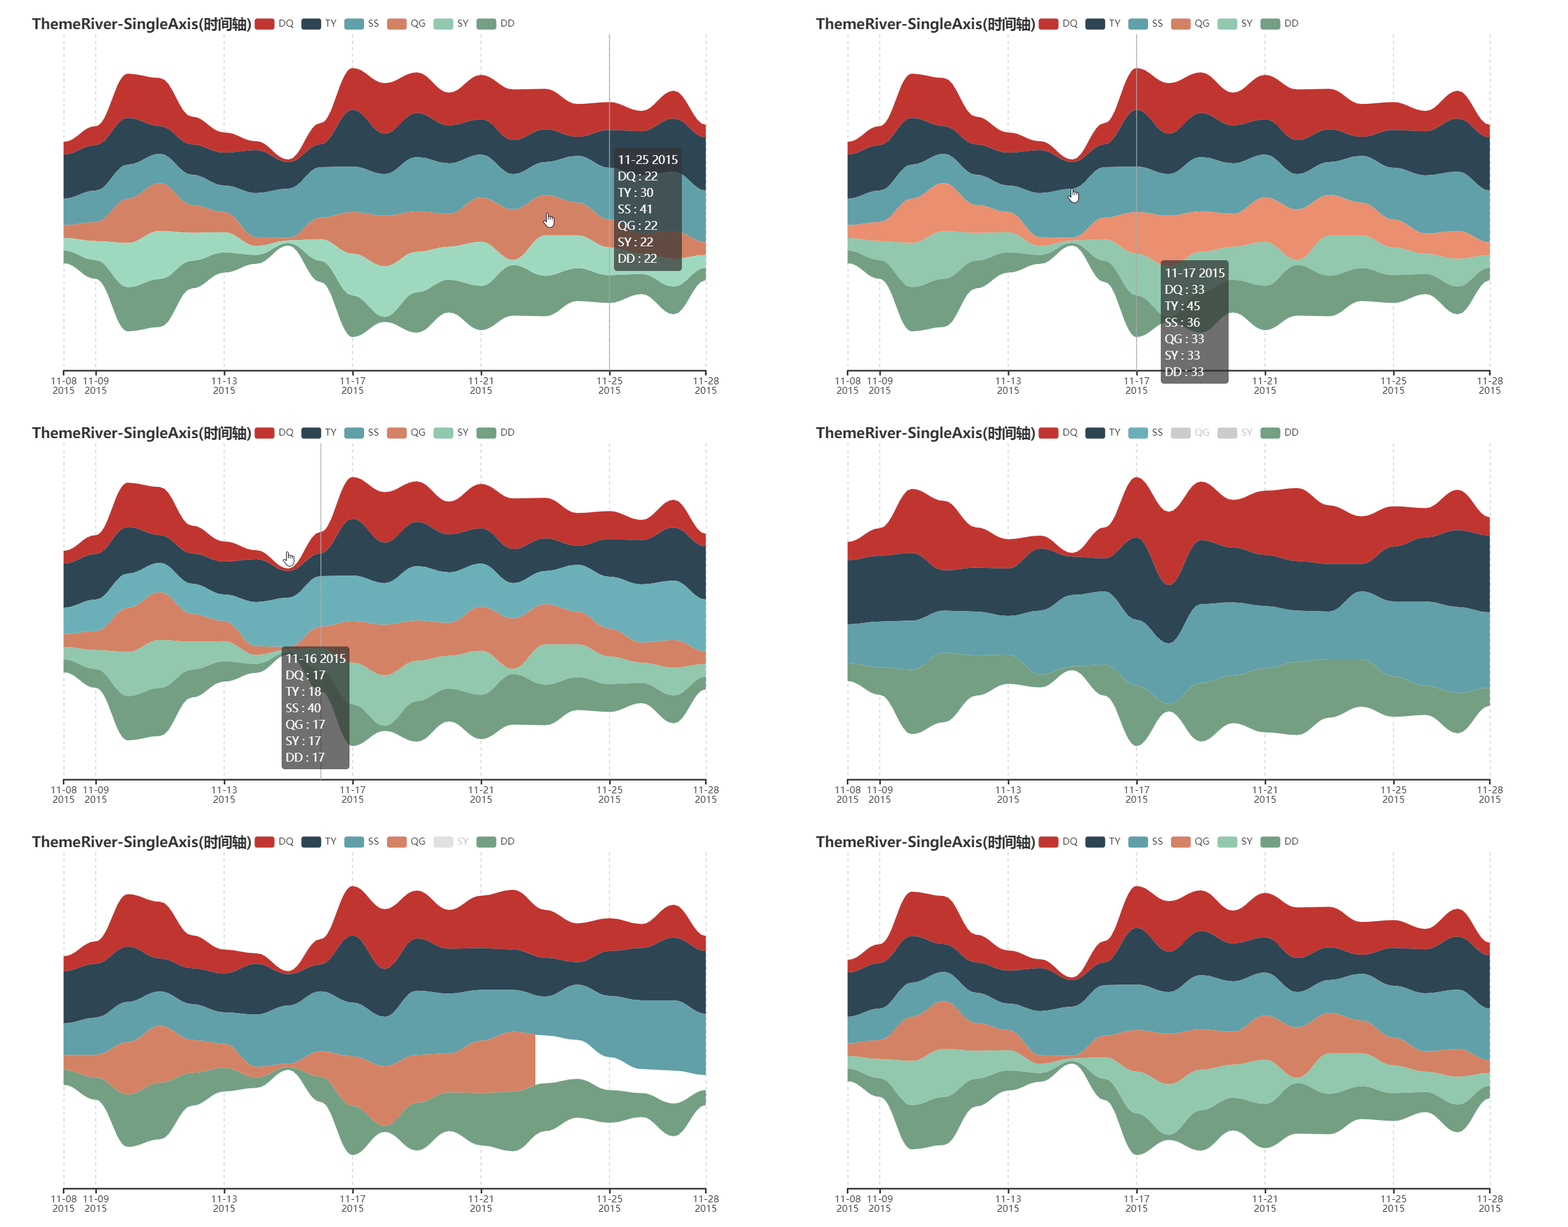
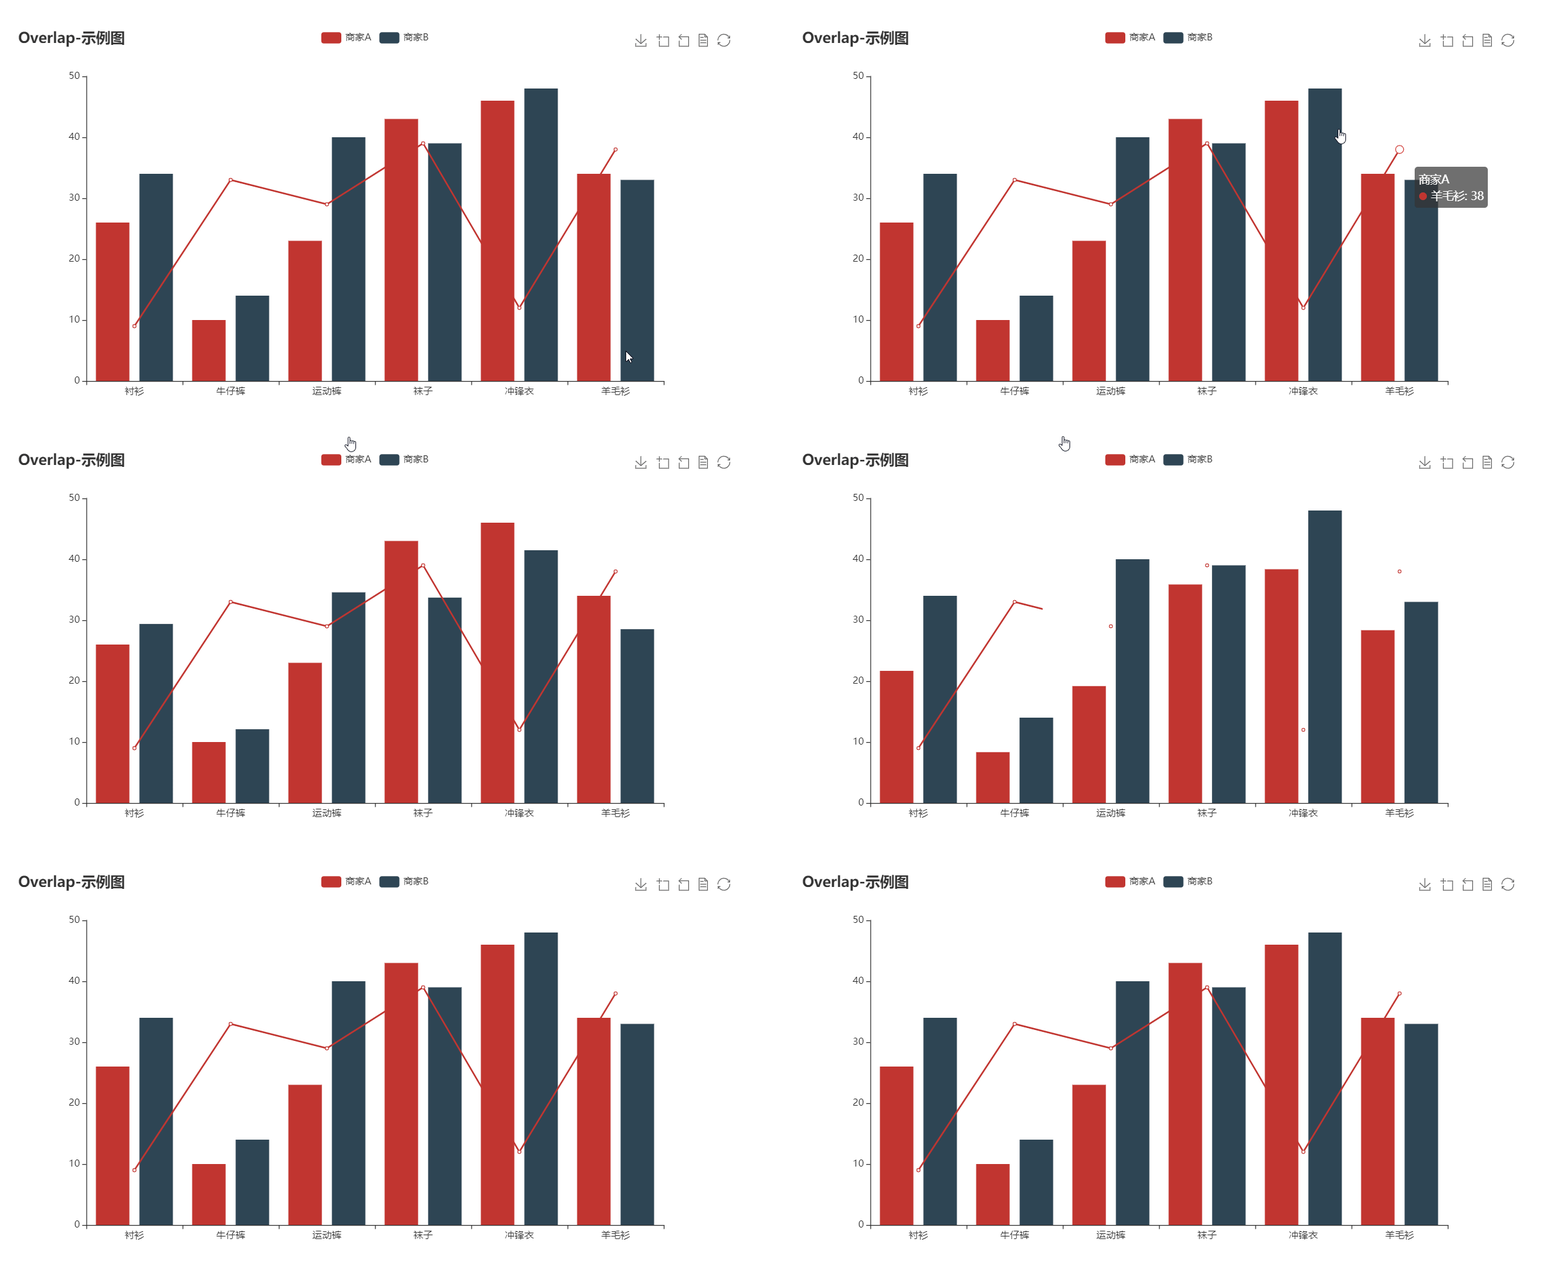
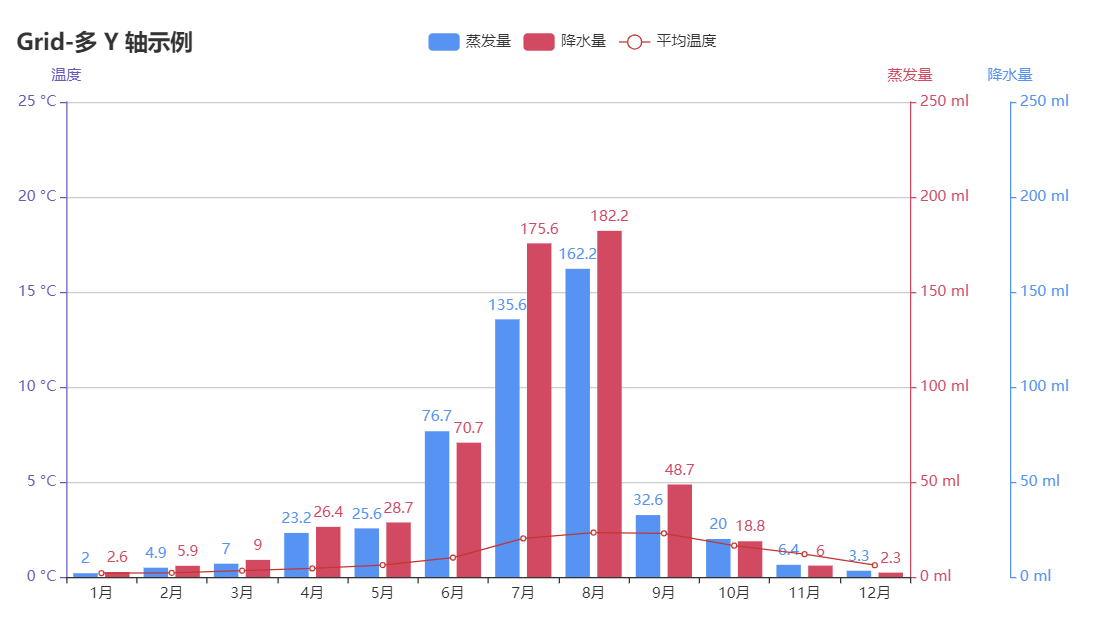
bar boxplot effectScatter funnel gague geo geo graph heatmap kline line liquid map bmap parallel pie ploar radar scatter tree treemap wordCloud bar3D line3D sankey scatter3D surface3D themeRiver sunburst overlap grid grid timeline

更多详细文档,请访问

代码质量

单元测试

$ pip install -r test/requirements.txt
$ make

集成测试

使用 Travis CIAppVeyor 持续集成环境。

代码规范

使用 flake8, Codecov 以及 pylint 提升代码质量。

😉 Author

pyecharts 主要由以下几位开发者开发维护

更多贡献者信息可以访问 pyecharts/graphs/contributors

💌 捐赠

开发和维护 pyecharts 花费了我巨大的心力,如果你觉得项目帮助到您,请认真考虑请作者喝一杯咖啡 😄

微信二维码 支付宝二维码
wechat-code alipay-code

如果其他开发者帮助到了您,也可以请他们喝咖啡 捐赠通道

💡 贡献

期待能有更多的开发者参与到 pyecharts 的开发中来,我们会保证尽快 Reivew PR 并且及时回复。但提交 PR 请确保

  1. 通过所有单元测试,如若是新功能,请为其新增单元测试
  2. 遵守开发规范,使用 black 以及 isort 格式化代码($ pip install -r requirements-dev.txt)
  3. 如若需要,请更新相对应的文档

我们也非常欢迎开发者能为 pyecharts 提供更多的示例,共同来完善文档,文档项目位于 pyecharts/website

📃 License

MIT ©chenjiandongx

Owner
pyecharts
pyecharts dev team
pyecharts
Gaphas is the diagramming widget library for Python.

Gaphas Gaphas is the diagramming widget library for Python. Gaphas is a library that provides the user interface component (widget) for drawing diagra

Gaphor 144 Dec 14, 2022
flask extension for integration with the awesome pydantic package

Flask-Pydantic Flask extension for integration of the awesome pydantic package with Flask. Installation python3 -m pip install Flask-Pydantic Basics v

249 Jan 06, 2023
simple tool to paint axis x and y
simple tool to paint axis x and y

G705 1 Oct 21, 2021
Analytical Web Apps for Python, R, Julia, and Jupyter. No JavaScript Required.

Dash Dash is the most downloaded, trusted Python framework for building ML & data science web apps. Built on top of Plotly.js, React and Flask, Dash t

Plotly 17.9k Dec 31, 2022
2021 grafana arbitrary file read

2021_grafana_arbitrary_file_read base on pocsuite3 try 40 default plugins of grafana alertlist annolist barchart cloudwatch dashlist elasticsearch gra

ATpiu 5 Nov 09, 2022
Small binja plugin to import header file to types

binja-import-header (v1.0.0) Author: matteyeux Import header file to Binary Ninja types view Description: Binary Ninja plugin to import types from C h

matteyeux 15 Dec 10, 2022
An application that allows you to design and test your own stock trading algorithms in an attempt to beat the market.

StockBot is a Python application for designing and testing your own daily stock trading algorithms. Installation Use the

Ryan Cullen 280 Dec 19, 2022
A program that analyzes data from inertia measurement units installed in aircraft and generates g-exceedance curves.

A program that analyzes data from inertia measurement units installed in aircraft and generates g-exceedance curves.

Pooya 1 Dec 02, 2021
A python script and steps to display locations of peers connected to qbittorrent

A python script (along with instructions) to display the locations of all the peers your qBittorrent client is connected to in a Grafana worldmap dash

62 Dec 07, 2022
3D plotting and mesh analysis through a streamlined interface for the Visualization Toolkit (VTK)

PyVista Deployment Build Status Metrics Citation License Community 3D plotting and mesh analysis through a streamlined interface for the Visualization

PyVista 1.6k Jan 08, 2023
Print matplotlib colors

mplcolors Tired of searching "matplotlib colors" every week/day/hour? This simple script displays them all conveniently right in your terminal emulato

Brandon Barker 32 Dec 13, 2022
BGraph is a tool designed to generate dependencies graphs from Android.bp soong files.

BGraph BGraph is a tool designed to generate dependencies graphs from Android.bp soong files. Overview BGraph (for Build-Graphs) is a project aimed at

Quarkslab 10 Dec 19, 2022
3D Vision functions with end-to-end support for deep learning developers, written in Ivy.

Ivy vision focuses predominantly on 3D vision, with functions for camera geometry, image projections, co-ordinate frame transformations, forward warping, inverse warping, optical flow, depth triangul

Ivy 61 Dec 29, 2022
Gesture controlled media player

Media Player Gesture Control Gesture controller for media player with MediaPipe, VLC and OpenCV. Contents About Setup About A tool for using gestures

Atharva Joshi 2 Dec 22, 2021
🐍PyNode Next allows you to easily create beautiful graph visualisations and animations

PyNode Next A complete rewrite of PyNode for the modern era. Up to five times faster than the original PyNode. PyNode Next allows you to easily create

ehne 3 Feb 12, 2022
SummVis is an interactive visualization tool for text summarization.

SummVis is an interactive visualization tool for analyzing abstractive summarization model outputs and datasets.

Robustness Gym 246 Dec 08, 2022
Yata is a fast, simple and easy Data Visulaization tool, running on python dash

Yata is a fast, simple and easy Data Visulaization tool, running on python dash. The main goal of Yata is to provide a easy way for persons with little programming knowledge to visualize their data e

Cybercreek 3 Jun 28, 2021
Python Data. Leaflet.js Maps.

folium Python Data, Leaflet.js Maps folium builds on the data wrangling strengths of the Python ecosystem and the mapping strengths of the Leaflet.js

6k Jan 02, 2023
Create charts with Python in a very similar way to creating charts using Chart.js

Create charts with Python in a very similar way to creating charts using Chart.js. The charts created are fully configurable, interactive and modular and are displayed directly in the output of the t

Nicolas H 68 Dec 08, 2022
PolytopeSampler is a Matlab implementation of constrained Riemannian Hamiltonian Monte Carlo for sampling from high dimensional disributions on polytopes

PolytopeSampler PolytopeSampler is a Matlab implementation of constrained Riemannian Hamiltonian Monte Carlo for sampling from high dimensional disrib

9 Sep 26, 2022