A Python wrapper of Neighbor Retrieval Visualizer (NeRV)

Overview

PyNeRV

A Python wrapper of the dimensionality reduction algorithm Neighbor Retrieval Visualizer (NeRV)

Compile

Set up the paths in Makefile then make.

Usage example

import numpy as np
import matplotlib.pyplot as plt
from nerv import NeRV

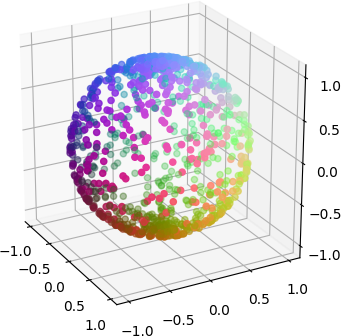
data = np.genfromtxt('dredviz-1.0.2/spheredata.dat', skip_header=1)
color = np.genfromtxt('dredviz-1.0.2/spheredata.col', skip_header=1)
nerv_obj = NeRV(random_state=0)
nerv_obj.fit(data)
print('Final cost = %g' % nerv_obj.cost_)
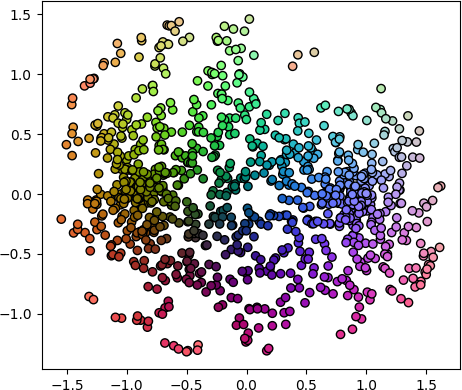
plt.scatter(*nerv_obj.embedding_.T, c=color)
plt.show()

which shows (right)


Reference

@article{venna2010information,
  title={Information retrieval perspective to nonlinear dimensionality reduction for data visualization},
  author={Venna, Jarkko and Peltonen, Jaakko and Nybo, Kristian and Aidos, Helena and Kaski, Samuel},
  journal={Journal of Machine Learning Research},
  volume={11},
  number={Feb},
  pages={451--490},
  year={2010}
}
Python Data Validation for Humans™.

validators Python data validation for Humans. Python has all kinds of data validation tools, but every one of them seems to require defining a schema

Konsta Vesterinen 670 Jan 09, 2023
An open-source tool for visual and modular block programing in python

PyFlow PyFlow is an open-source tool for modular visual programing in python ! Although for now the tool is in Beta and features are coming in bit by

1.1k Jan 06, 2023
Simple function to plot multiple barplots in the same figure.

Simple function to plot multiple barplots in the same figure. Supports padding and custom color.

Matthias Jakobs 2 Feb 21, 2022
Fast visualization of radar_scenes based on oleschum/radar_scenes

RadarScenes Tools About This python package provides fast visualization for the RadarScenes dataset. The Open GL based visualizer is smoother than ole

Henrik Söderlund 2 Dec 09, 2021
Example scripts for generating plots of Bohemian matrices

Bohemian Eigenvalue Plotting Examples This repository contains examples of generating plots of Bohemian eigenvalues. The examples in this repository a

Bohemian Matrices 5 Nov 12, 2022
A shimmer pre-load component for Plotly Dash

dash-loading-shimmer A shimmer pre-load component for Plotly Dash Installation Get it with pip: pip install dash-loading-extras Or maybe you prefer Pi

Lucas Durand 4 Oct 12, 2022
Visualizations for machine learning datasets

Introduction The facets project contains two visualizations for understanding and analyzing machine learning datasets: Facets Overview and Facets Dive

PAIR code 7.1k Jan 07, 2023
Analytical Web Apps for Python, R, Julia, and Jupyter. No JavaScript Required.

Dash Dash is the most downloaded, trusted Python framework for building ML & data science web apps. Built on top of Plotly.js, React and Flask, Dash t

Plotly 17.9k Dec 31, 2022
Example Code Notebooks for Data Visualization in Python

This repository contains sample code scripts for creating awesome data visualizations from scratch using different python libraries (such as matplotli

Javed Ali 27 Jan 04, 2023
A D3.js plugin that produces flame graphs from hierarchical data.

d3-flame-graph A D3.js plugin that produces flame graphs from hierarchical data. If you don't know what flame graphs are, check Brendan Gregg's post.

Martin Spier 740 Dec 29, 2022
Epagneul is a tool to visualize and investigate windows event logs

epagneul Epagneul is a tool to visualize and investigate windows event logs. Dep

jurelou 190 Dec 13, 2022
Sprint planner considering JIRA issues and google calendar meetings schedule.

Sprint planner Sprint planner is a Python script for planning your Jira tasks based on your calendar availability. Installation Use the package manage

Apptension 2 Dec 05, 2021
Using SQLite within Python to create database and analyze Starcraft 2 units data (Pandas also used)

SQLite python Starcraft 2 English This project shows the usage of SQLite with python. To create, modify and communicate with the SQLite database from

1 Dec 30, 2021
Colormaps for astronomers

cmastro: colormaps for astronomers 🔭 This package contains custom colormaps that have been used in various astronomical applications, similar to cmoc

Adrian Price-Whelan 12 Oct 11, 2022
A concise grammar of interactive graphics, built on Vega.

Vega-Lite Vega-Lite provides a higher-level grammar for visual analysis that generates complete Vega specifications. You can find more details, docume

Vega 4k Jan 08, 2023
Python code for solving 3D structural problems using the finite element method

3DFEM Python 3D finite element code This python code allows for solving 3D structural problems using the finite element method. New features will be a

Rémi Capillon 6 Sep 29, 2022
Automatically Visualize any dataset, any size with a single line of code. Created by Ram Seshadri. Collaborators Welcome. Permission Granted upon Request.

AutoViz Automatically Visualize any dataset, any size with a single line of code. AutoViz performs automatic visualization of any dataset with one lin

AutoViz and Auto_ViML 1k Jan 02, 2023
A curated list of awesome Dash (plotly) resources

Awesome Dash A curated list of awesome Dash (plotly) resources Dash is a productive Python framework for building web applications. Written on top of

Luke Singham 1.7k Jan 07, 2023
:art: Diagram as Code for prototyping cloud system architectures

Diagrams Diagram as Code. Diagrams lets you draw the cloud system architecture in Python code. It was born for prototyping a new system architecture d

MinJae Kwon 27.5k Dec 30, 2022
This is a Cross-Platform Plot Manager for Chia Plotting that is simple, easy-to-use, and reliable.

Swar's Chia Plot Manager A plot manager for Chia plotting: https://www.chia.net/ Development Version: v0.0.1 This is a cross-platform Chia Plot Manage

Swar Patel 1.3k Dec 13, 2022