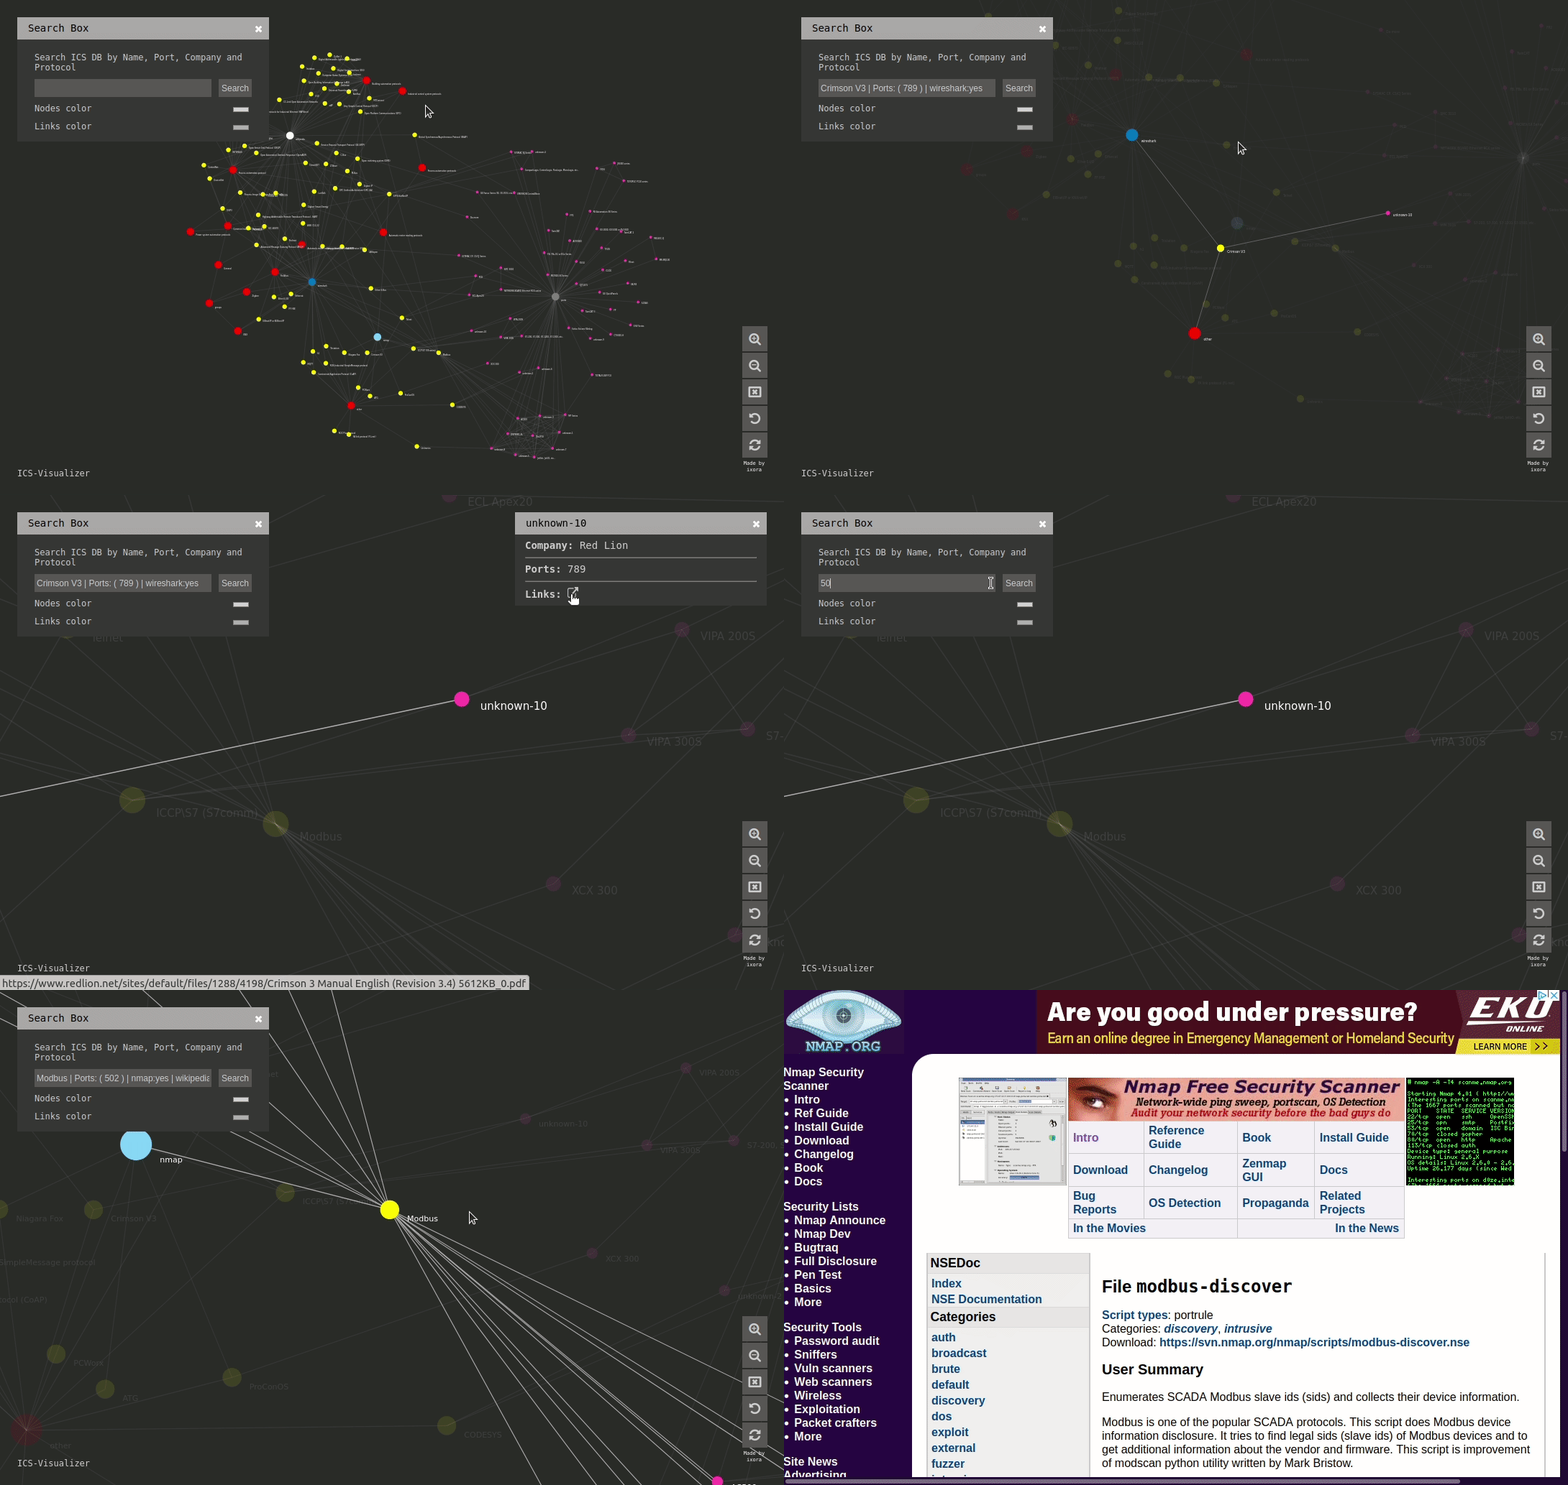
ICS-Visualizer is an interactive Industrial Control Systems (ICS) network graph that contains up-to-date ICS metadata

Overview

Generic badge Generic badge Generic badge Generic badge

ICS-Visualizer is an interactive Industrial Control Systems (ICS) network graph that contains up-to-date ICS metadata (Name, company, port, user manuals, external links, and mapped wireshark\namp modules and scripts).

Interface

Live

https://qeeqbox.github.io/ics-visualizer/

Features

  • ICS metadata (Name, company, port and info)
  • Mapped Wireshark and NMAP modules\scripts
  • External links to great ICS resources (Articles, manuals and projects)
  • Optimized canvas (Fast interaction)
  • Search function (Target item will be highlighted)
  • Zoom-in, zoom-out & reset options

Notes

  • ICS metadata db was compiled using my previous experience with ICS and a lot of great external articles\researches\projects (Do not forget to check them out!)

Resources

d3js.org wikipedia wireshark nmap and more

Other Licenses

By using this framework, you are accepting the license terms of each package listed below: D3, fontawesome, jQuery & JavaScript

Other Projects

Owner
QeeqBox
Security Projects for Red, Blue and Purple Teams
QeeqBox
This tool is designed to help administrators get an overview of their Active Directory structure.

This tool is designed to help administrators get an overview of their Active Directory structure. In the group view you can see all elements of an AD (OU, USER, GROUPS, COMPUTERS etc.). In the user v

deexno 2 Oct 30, 2022
TensorDebugger (TDB) is a visual debugger for deep learning. It extends TensorFlow with breakpoints + real-time visualization of the data flowing through the computational graph

TensorDebugger (TDB) is a visual debugger for deep learning. It extends TensorFlow (Google's Deep Learning framework) with breakpoints + real-time visualization of the data flowing through the comput

Eric Jang 1.4k Dec 15, 2022
Function Plotter: a simple application with GUI to plot mathematical functions

Function-Plotter Function Plotter is a simple application with GUI to plot mathe

Mohamed Nabawe 4 Jan 03, 2022
3D rendered visualization of the austrian monuments registry

Visualization of the Austrian Monuments Visualization of the monument landscape of the austrian monuments registry (Bundesdenkmalamt Denkmalverzeichni

Nikolai Janakiev 3 Oct 24, 2019
flask extension for integration with the awesome pydantic package

Flask-Pydantic Flask extension for integration of the awesome pydantic package with Flask. Installation python3 -m pip install Flask-Pydantic Basics v

249 Jan 06, 2023
Resources for teaching & learning practical data visualization with python.

Practical Data Visualization with Python Overview All views expressed on this site are my own and do not represent the opinions of any entity with whi

Paul Jeffries 98 Sep 24, 2022
A simple code for plotting figure, colorbar, and cropping with python

Python Plotting Tools This repository provides a python code to generate figures (e.g., curves and barcharts) that can be used in the paper to show th

Guanying Chen 134 Jan 02, 2023
3D Vision functions with end-to-end support for deep learning developers, written in Ivy.

Ivy vision focuses predominantly on 3D vision, with functions for camera geometry, image projections, co-ordinate frame transformations, forward warping, inverse warping, optical flow, depth triangul

Ivy 61 Dec 29, 2022
ecoglib: visualization and statistics for high density microecog signals

ecoglib: visualization and statistics for high density microecog signals This library contains high-level analysis tools for "topos" and "chronos" asp

1 Nov 17, 2021
The windML framework provides an easy-to-use access to wind data sources within the Python world, building upon numpy, scipy, sklearn, and matplotlib. Renewable Wind Energy, Forecasting, Prediction

windml Build status : The importance of wind in smart grids with a large number of renewable energy resources is increasing. With the growing infrastr

Computational Intelligence Group 125 Dec 24, 2022
Data aggregated from the reports found at the MCPS COVID Dashboard into a set of visualizations.

Montgomery County Public Schools COVID-19 Visualizer Contents About this project Data Support this project About this project Data All data we use can

James 3 Jan 19, 2022
Quickly and accurately render even the largest data.

Turn even the largest data into images, accurately Build Status Coverage Latest dev release Latest release Docs Support What is it? Datashader is a da

HoloViz 2.9k Dec 28, 2022
Graphing communities on Twitch.tv in a visually intuitive way

VisualizingTwitchCommunities This project maps communities of streamers on Twitch.tv based on shared viewership. The data is collected from the Twitch

Kiran Gershenfeld 312 Jan 07, 2023
Data parsing and validation using Python type hints

pydantic Data validation and settings management using Python type hinting. Fast and extensible, pydantic plays nicely with your linters/IDE/brain. De

Samuel Colvin 12.1k Jan 06, 2023
3D plotting and mesh analysis through a streamlined interface for the Visualization Toolkit (VTK)

PyVista Deployment Build Status Metrics Citation License Community 3D plotting and mesh analysis through a streamlined interface for the Visualization

PyVista 1.6k Jan 08, 2023
A TileDB backend for xarray.

TileDB-xarray This library provides a backend engine to xarray using the TileDB Storage Engine. Example usage: import xarray as xr dataset = xr.open_d

TileDB, Inc. 14 Jun 02, 2021
Visualization Website by using Dash and Heroku

Visualization Website by using Dash and Heroku You can visit the website https://payroll-expense-analysis.herokuapp.com/ In this project, I am interes

YF Liu 1 Jan 14, 2022
A python script and steps to display locations of peers connected to qbittorrent

A python script (along with instructions) to display the locations of all the peers your qBittorrent client is connected to in a Grafana worldmap dash

62 Dec 07, 2022
🎨 Python Echarts Plotting Library

pyecharts Python ❤️ ECharts = pyecharts English README 📣 简介 Apache ECharts (incubating) 是一个由百度开源的数据可视化,凭借着良好的交互性,精巧的图表设计,得到了众多开发者的认可。而 Python 是一门富有表达

pyecharts 13.1k Jan 03, 2023
Visualization Data Drug in thailand during 2014 to 2020

Visualization Data Drug in thailand during 2014 to 2020 Data sorce from ข้อมูลเปิดภาครัฐ สำนักงาน ป.ป.ส Inttroducing program Using tkinter module for

Narongkorn 1 Jan 05, 2022