Peloton Stats to Google Sheets with Data Visualization through Seaborn and Plotly

Overview

Peloton Stats to Google Sheets with Data Visualization through Seaborn and Plotly

Problem: 2 peloton users were looking for a way to track their metrics in a way that was readable and available

Solution: this script. I personally run this at set intervals on a raspberry pi, so access to their data is usable at virtually all hours.

Here's how it works. The code relies on first having built a csv file which contains the headings of 'name', 'username', 'email', and 'password' (for Peloton). The script pulls data from this file and then logs into peloton. From there, it downloads the users CSV data with all of their workout data. For my specific needs, we only cared about cycling data (which you will notice in the code). Several calculations are performed and some clean up is completed on the dataframes. That data is then passed into the user's assigned Google Sheet (which also includes their interactive 'goal' cell used for pace calculations [this resets on the first of each year]. Since I am running on a raspberry pi, I use SMTP to send an email to each user at the end of the day with a daily wrap email.

The script utilizes several dependencies (noted in the code itself). One of the dependencies is based on the google sheets API. Information can be found here: https://developers.google.com/sheets/api

You might also like...
Productivity Tools for Plotly + Pandas

Cufflinks This library binds the power of plotly with the flexibility of pandas for easy plotting. This library is available on https://github.com/san

Custom Plotly Dash components based on Mantine React Components library

Dash Mantine Components Dash Mantine Components is a Dash component library based on Mantine React Components Library. It makes it easier to create go

 A Simple Flask-Plotly Example for NTU 110-1 DSSI Class
A Simple Flask-Plotly Example for NTU 110-1 DSSI Class

A Simple Flask-Plotly Example for NTU 110-1 DSSI Class Live Demo Prerequisites We will use Flask and Ploty to build a Flask application. If you haven'

A shimmer pre-load component for Plotly Dash

dash-loading-shimmer A shimmer pre-load component for Plotly Dash Installation Get it with pip: pip install dash-loading-extras Or maybe you prefer Pi

3D plotting and mesh analysis through a streamlined interface for the Visualization Toolkit (VTK)

PyVista Deployment Build Status Metrics Citation License Community 3D plotting and mesh analysis through a streamlined interface for the Visualization

3D plotting and mesh analysis through a streamlined interface for the Visualization Toolkit (VTK)

PyVista Deployment Build Status Metrics Citation License Community 3D plotting and mesh analysis through a streamlined interface for the Visualization

Create Badges with stats of Scratch User, Project and Studio. Use those badges in Github readmes, etc.

Scratch-Stats-Badge Create customized Badges with stats of Scratch User, Studio or Project. Use those badges in Github readmes, etc. Examples Document

 GitHub Stats Visualizations : Transparent
GitHub Stats Visualizations : Transparent

GitHub Stats Visualizations : Transparent Generate visualizations of GitHub user and repository statistics using GitHub Actions. ⚠️ Disclaimer The pro

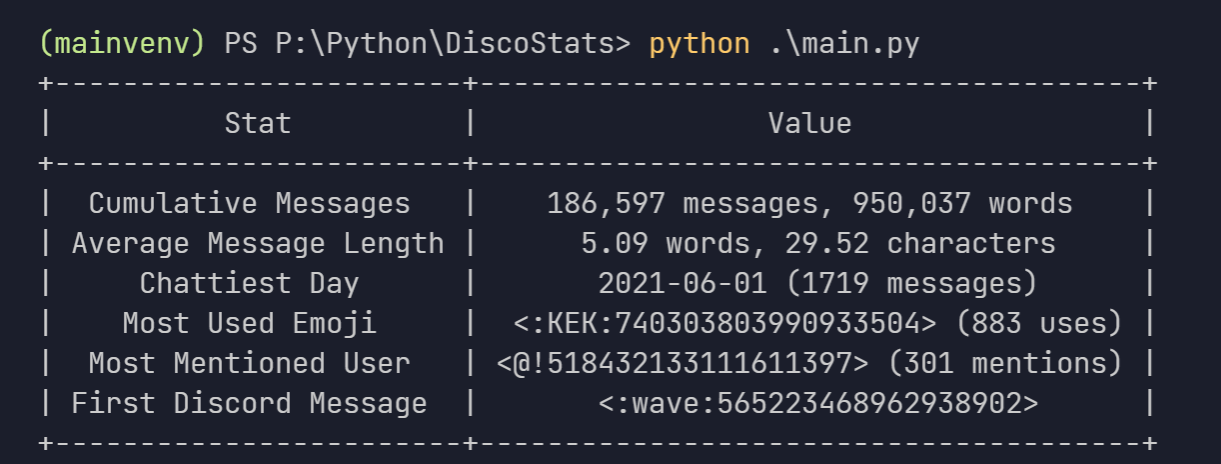
view cool stats related to your discord account.

DiscoStats cool statistics generated using your discord data. How? DiscoStats is not a service that breaks the Discord Terms of Service or Community G

Releases(v2.1.2)
  • v2.1.2(Feb 1, 2022)

    1. added a '--pause' arg to the script to facilitate the pausing for service account quota exceeded errors
    2. Initial push of a google sheet builder

    What's Changed

    • Sheet Build Initial Push by @tychaney in https://github.com/tychaney/Peloton-Data-to-Google-Sheets/pull/3

    Full Changelog: https://github.com/tychaney/Peloton-Data-to-Google-Sheets/compare/v2.1.1...v2.1.2

    Source code(tar.gz)
    Source code(zip)
  • v2.1.1(Jan 31, 2022)

    Minor bug fix from 2.1.0 Corrected the monthly pace calculation

    What's Changed

    • v 2.1.0 by @tychaney in https://github.com/tychaney/Peloton-Data-to-Google-Sheets/pull/2

    Full Changelog: https://github.com/tychaney/Peloton-Data-to-Google-Sheets/compare/v2.1.0...v2.1.1

    Source code(tar.gz)
    Source code(zip)
Multi-class confusion matrix library in Python

Table of contents Overview Installation Usage Document Try PyCM in Your Browser Issues & Bug Reports Todo Outputs Dependencies Contribution References

Sepand Haghighi 1.3k Dec 31, 2022
Simple Inkscape Scripting

Simple Inkscape Scripting Description In the Inkscape vector-drawing program, how would you go about drawing 100 diamonds, each with a random color an

Scott Pakin 140 Dec 27, 2022
The visual framework is designed on the idea of module and implemented by mixin method

Visual Framework The visual framework is designed on the idea of module and implemented by mixin method. Its biggest feature is the mixins module whic

LEFTeyes 9 Sep 19, 2022
JupyterHub extension for ContainDS Dashboards

ContainDS Dashboards for JupyterHub A Dashboard publishing solution for Data Science teams to share results with decision makers. Run a private on-pre

Ideonate 179 Nov 29, 2022
A Python package that provides evaluation and visualization tools for the DexYCB dataset

DexYCB Toolkit DexYCB Toolkit is a Python package that provides evaluation and visualization tools for the DexYCB dataset. The dataset and results wer

NVIDIA Research Projects 107 Dec 26, 2022
3D rendered visualization of the austrian monuments registry

Visualization of the Austrian Monuments Visualization of the monument landscape of the austrian monuments registry (Bundesdenkmalamt Denkmalverzeichni

Nikolai Janakiev 3 Oct 24, 2019
Matplotlib colormaps from the yt project !

cmyt Matplotlib colormaps from the yt project ! Colormaps overview The following colormaps, as well as their respective reversed (*_r) versions are av

The yt project 5 Sep 16, 2022
Color scales in Python for humans

colorlover Color scales for humans IPython notebook: https://plot.ly/ipython-notebooks/color-scales/ import colorlover as cl from IPython.display impo

Plotly 146 Sep 25, 2022
a robust room presence solution for home automation with nearly no false negatives

Argos Room Presence This project builds a room presence solution on top of Argos. Using just a cheap raspberry pi zero w (plus an attached pi camera,

Angad Singh 46 Sep 18, 2022
Complex heatmaps are efficient to visualize associations between different sources of data sets and reveal potential patterns.

Make Complex Heatmaps Complex heatmaps are efficient to visualize associations between different sources of data sets and reveal potential patterns. H

Zuguang Gu 973 Jan 09, 2023
Decision Border Visualizer for Classification Algorithms

dbv Decision Border Visualizer for Classification Algorithms Project description A python package for Machine Learning Engineers who want to visualize

Sven Eschlbeck 1 Nov 01, 2021
Make scripted visualizations in blender

Scripted visualizations in blender The goal of this project is to script 3D scientific visualizations using blender. To achieve this, we aim to bring

Praneeth Namburi 10 Jun 01, 2022
An automatic prover for tautologies in Metamath

completeness An automatic prover for tautologies in Metamath This program implements the constructive proof of the Completeness Theorem for propositio

Scott Fenton 2 Dec 15, 2021
I'm doing Genuary, an aritifiacilly generated month to build code that make beautiful things

Genuary 2022 I'm doing Genuary, an aritifiacilly generated month to build code that make beautiful things. Every day there is a new prompt for making

Joaquín Feltes 1 Jan 10, 2022
A shimmer pre-load component for Plotly Dash

dash-loading-shimmer A shimmer pre-load component for Plotly Dash Installation Get it with pip: pip install dash-loading-extras Or maybe you prefer Pi

Lucas Durand 4 Oct 12, 2022
A set of useful perceptually uniform colormaps for plotting scientific data

Colorcet: Collection of perceptually uniform colormaps Build Status Coverage Latest dev release Latest release Docs What is it? Colorcet is a collecti

HoloViz 590 Dec 31, 2022
An open-source plotting library for statistical data.

Lets-Plot Lets-Plot is an open-source plotting library for statistical data. It is implemented using the Kotlin programming language. The design of Le

JetBrains 820 Jan 06, 2023
2D maze path solver visualizer implemented with python

2D maze path solver visualizer implemented with python

SS 14 Dec 21, 2022
flask extension for integration with the awesome pydantic package

Flask-Pydantic Flask extension for integration of the awesome pydantic package with Flask. Installation python3 -m pip install Flask-Pydantic Basics v

249 Jan 06, 2023
A tool for creating Toontown-style nametags in Panda3D

Toontown-Nametag Toontown-Nametag is a tool for creating Toontown Online/Toontown Rewritten-style nametags in Panda3D. It contains a function, createN

BoggoTV 2 Dec 23, 2021