当前位置:网站首页>Kubernetes 计算CPU 使用率
Kubernetes 计算CPU 使用率
2022-08-10 22:59:00 【InfoQ】
- container_spec_cpu_period
- 当对容器进行 CPU 限制时,CFS 调度的时间窗口,又称容器 CPU 的时钟周期通常是 100,000 微秒
- container_spec_cpu_quota
- 是指容器的使用 CPU 时间周期总量,如果 quota 设置的是 700,000,就代表该容器可用的 CPU 时间是 7*100,000 微秒,通常对应 kubernetes 的 resource.cpu.limits 的值
- container_spec_cpu_share
- 是指 container 使用分配主机 CPU 相对值,比如 share 设置的是 500m,代表窗口启动时向主机节点申请 0.5 个 CPU,也就是 50,000 微秒,通常对应 kubernetes 的 resource.cpu.requests 的值
- container_cpu_usage_seconds_total
- 统计容器的 CPU 在一秒内消耗使用率,应注意的是该 container 所有的 CORE
- container_cpu_system_seconds_total
- 统计容器内核态在一秒时间内消耗的 CPU
- container_cpu_user_seconds_total
- 统计容器用户态在一秒时间内消耗的 CPU
- 参考官方地址 https://docs.signalfx.com/en/latest/integrations/agent/monitors/cadvisor.html https://github.com/google/cadvisor/blob/master/docs/storage/prometheus.md
具体公式
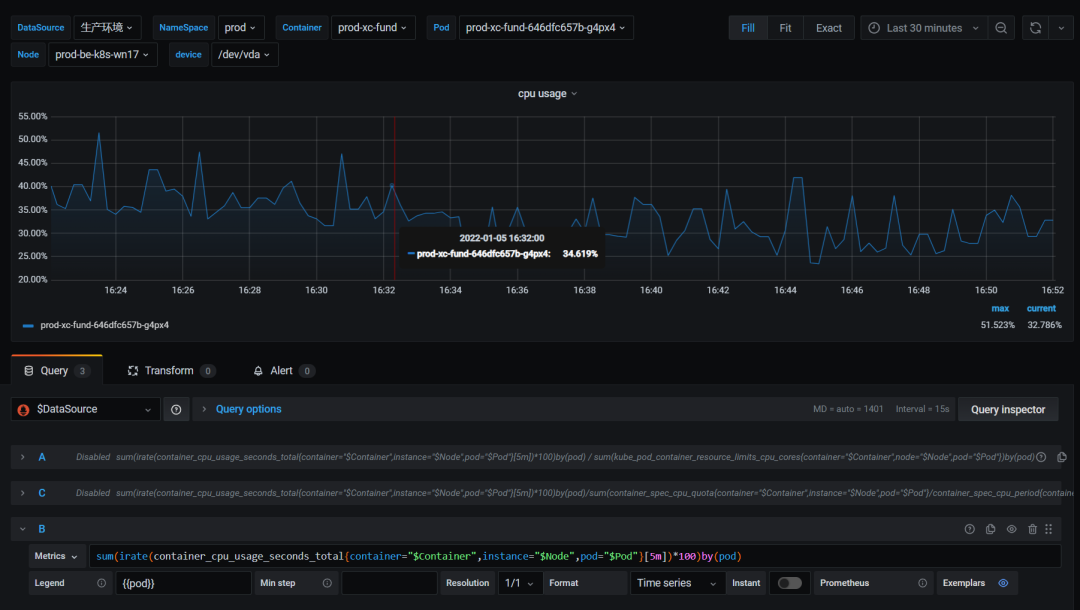
- 默认如果直接使用 container_cpu_usage_seconds_total 的话,如下
sum(irate(container_cpu_usage_seconds_total{container="$Container",instance="$Node",pod="$Pod"}[5m])*100)by(pod)- 默认统计的数据是该容器所有的 CORE 的平均使用率
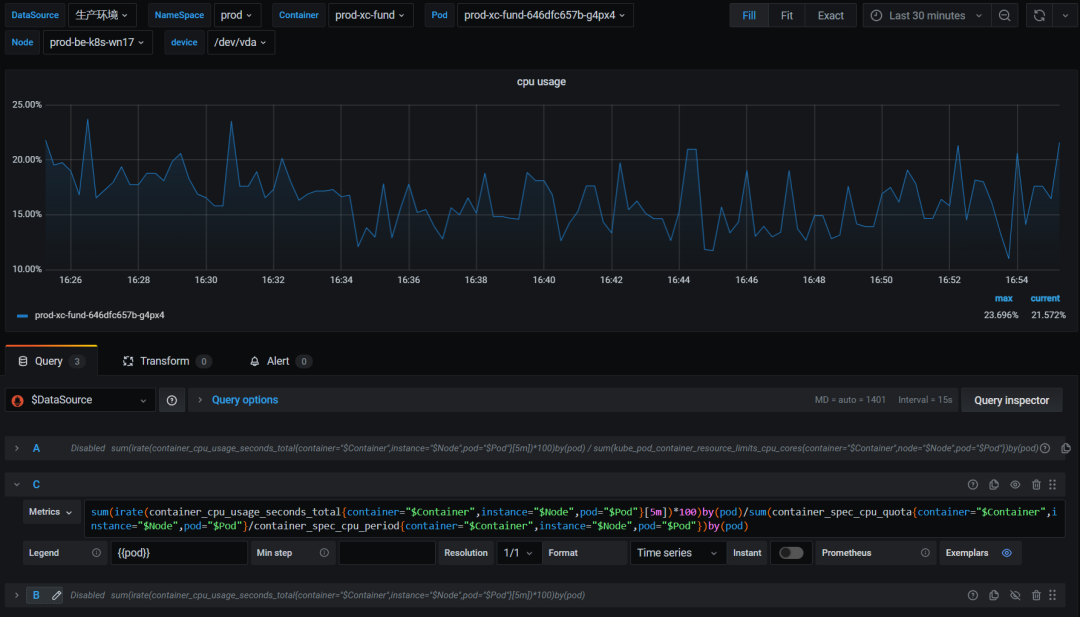
- 如果要精确计算每个容器的 CPU 使用率,使用 % 呈现的形式,如下
sum(irate(container_cpu_usage_seconds_total{container="$Container",instance="$Node",pod="$Pod"}[5m])*100)by(pod)/sum(container_spec_cpu_quota{container="$Container",instance="$Node",pod="$Pod"}/container_spec_cpu_period{container="$Container",instance="$Node",pod="$Pod"})by(pod)- 其中 container_spec_cpu_quota/container_spec_cpu_period,就代表该容器有多少个 CORE
- 参考官方 git issue
- https://github.com/google/cadvisor/issues/2026#issuecomment-415819667
docker stats
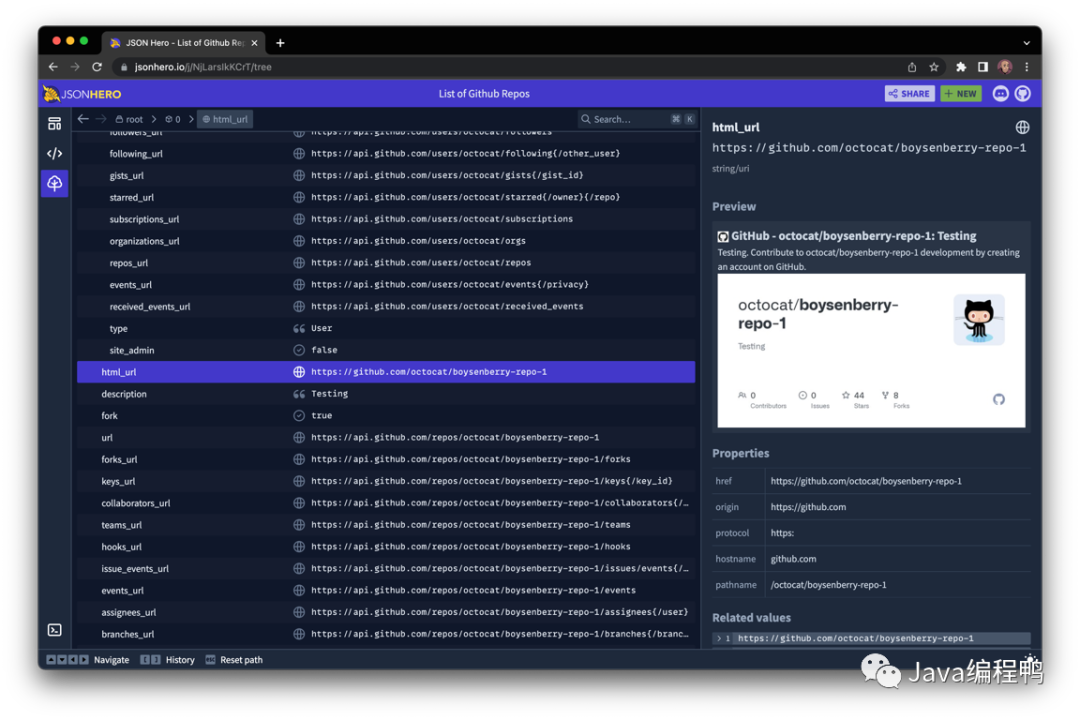
- 如何通过 Docker API 查看容器资源使用率,如下
$ curl -s --unix-socket /var/run/docker.sock "http://localhost/v1.40/containers/10f2db238edc/stats" | jq -r
{
 "read": "2022-01-05T06:14:47.705943252Z",
 "preread": "0001-01-01T00:00:00Z",
 "pids_stats": {
 "current": 240
 },
 "blkio_stats": {
 "io_service_bytes_recursive": [
 {
 "major": 253,
 "minor": 0,
 "op": "Read",
 "value": 0
 },
 {
 "major": 253,
 "minor": 0,
 "op": "Write",
 "value": 917504
 },
 {
 "major": 253,
 "minor": 0,
 "op": "Sync",
 "value": 0
 },
 {
 "major": 253,
 "minor": 0,
 "op": "Async",
 "value": 917504
 },
 {
 "major": 253,
 "minor": 0,
 "op": "Discard",
 "value": 0
 },
 {
 "major": 253,
 "minor": 0,
 "op": "Total",
 "value": 917504
 }
 ],
 "io_serviced_recursive": [
 {
 "major": 253,
 "minor": 0,
 "op": "Read",
 "value": 0
 },
 {
 "major": 253,
 "minor": 0,
 "op": "Write",
 "value": 32
 },
 {
 "major": 253,
 "minor": 0,
 "op": "Sync",
 "value": 0
 },
 {
 "major": 253,
 "minor": 0,
 "op": "Async",
 "value": 32
 },
 {
 "major": 253,
 "minor": 0,
 "op": "Discard",
 "value": 0
 },
 {
 "major": 253,
 "minor": 0,
 "op": "Total",
 "value": 32
 }
 ],
 "io_queue_recursive": [],
 "io_service_time_recursive": [],
 "io_wait_time_recursive": [],
 "io_merged_recursive": [],
 "io_time_recursive": [],
 "sectors_recursive": []
 },
 "num_procs": 0,
 "storage_stats": {},
 "cpu_stats": {
 "cpu_usage": {
 "total_usage": 251563853433744,
 "percpu_usage": [
 22988555937059,
 6049382848016,
 22411490707722,
 5362525449957,
 25004835766513,
 6165050456944,
 27740046633494,
 6245013152748,
 29404953317631,
 5960151933082,
 29169053441816,
 5894880727311,
 25772990860310,
 5398581194412,
 22856145246881,
 5140195759848
 ],
 "usage_in_kernelmode": 30692640000000,
 "usage_in_usermode": 213996900000000
 },
 "system_cpu_usage": 22058735930000000,
 "online_cpus": 16,
 "throttling_data": {
 "periods": 10673334,
 "throttled_periods": 1437,
 "throttled_time": 109134709435
 }
 },
 "precpu_stats": {
 "cpu_usage": {
 "total_usage": 0,
 "usage_in_kernelmode": 0,
 "usage_in_usermode": 0
 },
 "throttling_data": {
 "periods": 0,
 "throttled_periods": 0,
 "throttled_time": 0
 }
 },
 "memory_stats": {
 "usage": 8589447168,
 "max_usage": 8589926400,
 "stats": {
 "active_anon": 0,
 "active_file": 260198400,
 "cache": 1561460736,
 "dirty": 3514368,
 "hierarchical_memory_limit": 8589934592,
 "hierarchical_memsw_limit": 8589934592,
 "inactive_anon": 6947250176,
 "inactive_file": 1300377600,
 "mapped_file": 0,
 "pgfault": 3519153,
 "pgmajfault": 0,
 "pgpgin": 184508478,
 "pgpgout": 184052901,
 "rss": 6947373056,
 "rss_huge": 6090129408,
 "total_active_anon": 0,
 "total_active_file": 260198400,
 "total_cache": 1561460736,
 "total_dirty": 3514368,
 "total_inactive_anon": 6947250176,
 "total_inactive_file": 1300377600,
 "total_mapped_file": 0,
 "total_pgfault": 3519153,
 "total_pgmajfault": 0,
 "total_pgpgin": 184508478,
 "total_pgpgout": 184052901,
 "total_rss": 6947373056,
 "total_rss_huge": 6090129408,
 "total_unevictable": 0,
 "total_writeback": 0,
 "unevictable": 0,
 "writeback": 0
 },
 "limit": 8589934592
 },
 "name": "/k8s_prod-xc-fund_prod-xc-fund-646dfc657b-g4px4_prod_523dcf9d-6137-4abf-b4ad-bd3999abcf25_0",
"id": "10f2db238edc13f538716952764d6c9751e5519224bcce83b72ea7c876cc0475"- 如何计算
- 官方地址
- https://docs.docker.com/engine/api/v1.40/#operation/ContainerStats
- The
precpu_stats is the CPU statistic of the previous read, and is used to calculate the CPU usage percentage. It is not an exact copy of the cpu_stats field. - If either
precpu_stats.online_cpus or cpu_stats.online_cpus is nil then for compatibility with older daemons the length of the corresponding cpu_usage.percpu_usage array should be used. - To calculate the values shown by the
stats command of the docker cli tool the following formulas can be used: - used_memory =
memory_stats.usage - memory_stats.stats.cache - available_memory =
memory_stats.limit - Memory usage % =
(used_memory / available_memory) * 100.0 - cpu_delta =
cpu_stats.cpu_usage.total_usage - precpu_stats.cpu_usage.total_usage - system_cpu_delta =
cpu_stats.system_cpu_usage - precpu_stats.system_cpu_usage - number_cpus =
lenght(cpu_stats.cpu_usage.percpu_usage) or cpu_stats.online_cpus - CPU usage % =
(cpu_delta / system_cpu_delta) * number_cpus * 100.0
边栏推荐
- PlaidCTF 2022 Amongst Ourselves: Shipmate writeup
- 【软件测试】2022年最火的十大测试工具,你掌握了几个
- 性能不够,机器来凑;jvm调优实战操作详解
- 3598. Binary tree traversal (Huazhong University of Science and Technology exam questions)
- 二叉树 | 递归遍历 | leecode刷题笔记
- 确诊了!是Druid1.1.20的锅,查询无法映射LocalDateTime类型(带源码解析及解决方案)
- Kotlin 由浅入深,带你搞懂协程异常处理的那点事
- (PC+WAP)带手机端pbootcms模板园林景观类网站
- DC-7靶场下载及渗透实战详细过程(DC靶场系列)
- Glide缓存核心原理详解
猜你喜欢

金山云CEO王育林离职:正值冲刺港股之际 雷军曾送金砖
Android面试冲刺:2022全新面试题——剑指Offer(备战金九银十)
JS学习 2022080
vr虚拟仿真教学系统应用场景开发

3d虚拟现实数字化展厅给予参观者充分的交互性和空间感
Glide监听Activity生命周期源码分析
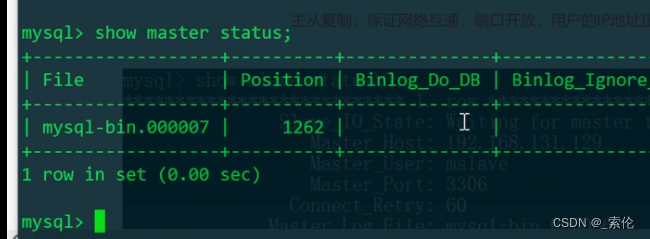
MySQL: MySQL Cluster - Principle and Configuration of Master-Slave Replication
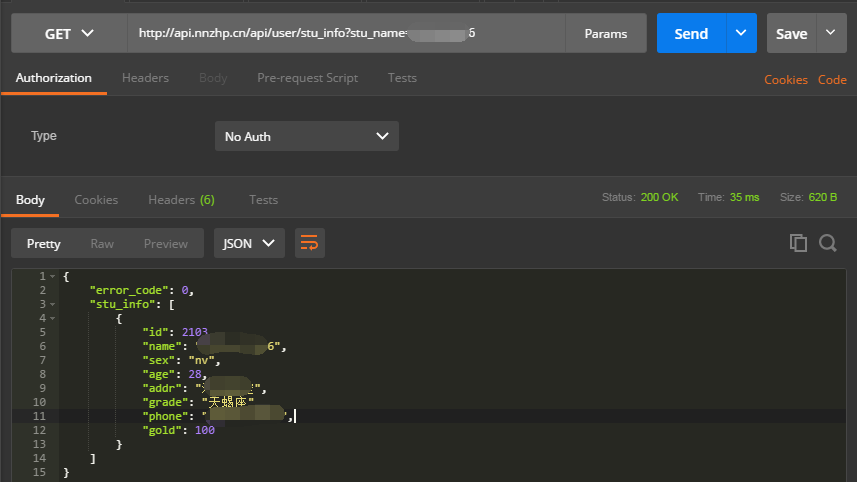
postman+jmeter接口实例
实例052:按位或
This visual tool artifact is more intuitive and easy to use!love so much
随机推荐
PyQt5 窗口自适应大小
高精度乘法
响应式pbootcms模板五金配件类网站
RecyclerView上下滑动时,不调用onBindViewHolder 导致列表的item不刷新
Tencent Cloud Lightweight Application Server Configuration and Website Building Tutorial
蓝帽杯 2022 web/misc writeup
web项目访问引用jar内部的静态资源
如何反弹shell
Leave a message with a prize | OpenBMB x Tsinghua University NLP: The update of the large model open class is complete!
【Maui正式版】创建可跨平台的Maui程序,以及有关依赖注入、MVVM双向绑定的实现和演示
HGAME 2022 复盘 writeup
十年架构五年生活-08 第一次背锅
MySQL之JDBC编程增删改查
HGAME 2022 Week1 writeup
服务器上行带宽和下行带宽指的是什么
windows10安装PostgreSQL14避坑分享
JS use regular expressions in g model and non g difference
postman+jmeter接口实例
二叉树 | 对称二叉树、相同的树、子树相同 | leecode刷题笔记
API服务网关