当前位置:网站首页>Detailed explanation of C language knowledge points -- first understanding of C language [1] - vs2022 debugging skills and code practice [1]
Detailed explanation of C language knowledge points -- first understanding of C language [1] - vs2022 debugging skills and code practice [1]
2022-04-23 15:02:00 【VelvetShiki_ Not_ VS】
VS2022 Debugging skills and precautions
- Code alignment : When editing code with the compiler , Programmers who don't pay attention to the cleanliness or format of the code may be confused by others , for example :
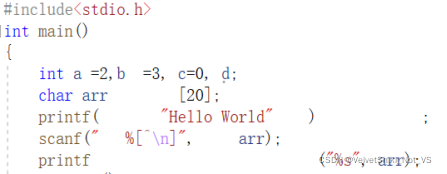
The code formats vary , As the command line increases, tidiness will affect the reading experience
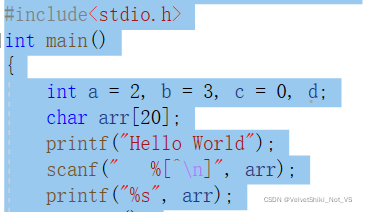
A quick and easy way is to Ctrl A Check all codes , Then press... In turn Ctrl K and Ctrl F You can quickly align code , And unify the format , After use, the effect of the above code is shown in the figure ( Note that the box is set in the format control character “” Spaces in will not be formatted uniformly , In this case scanf):
2. understand .cpp Source file : When creating a project, there are always two files under the root directory , One by .cpp Represents the code source file , It is a code editing record without function operation function , That is, it is just a text that can be opened with any text editing software ( If the compiler is read-only ,TEXT Text editor or notepad++), But it cannot be operated by the compiler ; The latter is a solution file , It is used to store specific information about the source code .c File solution settings , Provide graphical interface and related information for displaying management files . In other words, the source code text running with this suffix can perform various user-defined functions , And you can continue the last progress work every time you continue the development , Such as layout format , Function writing, etc .

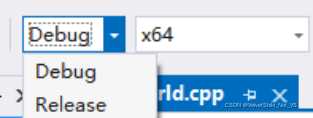
3. understand debug and release edition :debug Debug version for program , That is, the program code that is still in the test and development stage , Also not yet released code phase .Release For the release version of the code , Translate it into release Of .exe The program file is the final version that the programmer wants the customer to see , But not directly for sharing , And the actual size ratio debug Lower version .
4. Program execution and debugging shortcut key details :
①F5 And Ctrl F5 difference :F5 To debug a program , Attach a debugger while the code is running , The breakpoint set in the function can force the function to pause during the debugging run , And enable the debugger , Via shortcut key F10 Step by step or F11 Statement by statement debugging code , It's easier to find code errors bug, Or you can observe the execution time of statements and procedures , Optimize the code so that the time and space complexity of the code is less .
②Ctrl F5 To execute complete code without debugging , So this process only compiles and runs in the root directory of the code x64 Drop the target file and connect it .exe Executable program file , Ignore the setting of code break point and run the main function directly .
example : To print Hello World For example
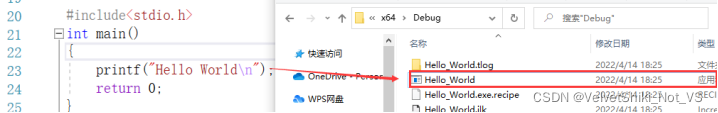
- Create a new project and add a project named Hello World.c Source code file for , At this time, the root directory is not only used to edit the source file of the program language text , There are no other documents .
- Reference header file and main function , Just use printf Perform formatted output Hello World In the code , Move the cursor to printf On the command line , Press F9 Shortcut key to set breakpoint ( You can also find the new breakpoint in the debug tab ), Then press Ctrl F7 Source files can be compiled , Generate target file .obj, Then press the Ctrl F5 Execution procedure , Get as shown :
-
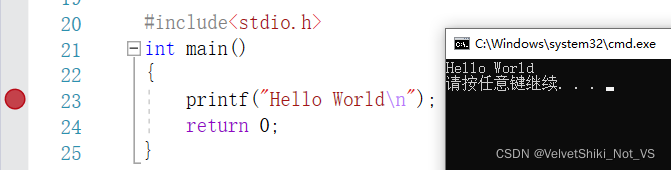
- Breakpoints are set, but the program is not printf stop , because Ctrl F5 Only the executable file connected by the target file is run .exe Without going through the debugging steps , So I won't stop and wait for the command to be issued .
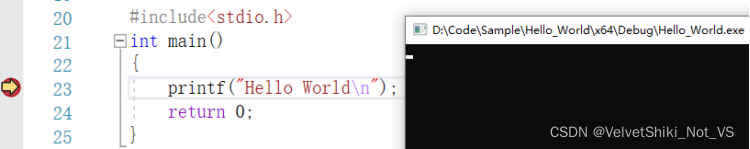
- If you want to make the program run item by item as expected , That is, enter the main function and wait for the command to be issued before printing Hello World, You can press the shortcut key of debugging directly after setting the breakpoint F5, Enter the debugging stage :
① In debugging, the main function consists of main Entrance access , By default, it runs to the first place where the breakpoint is set , Wait for the command to be issued before running the line change statement , Notice that there is a small arrow pointing to the line with the breakpoint set :
② At this time, issue a running instruction to the debugger , Press the process by process debugging instruction F10 Or debug instructions sentence by sentence , The program executes the current line , When finished, it goes to the next breakpoint ( If it exists ):
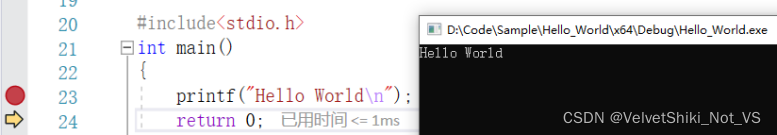
③ Press again F10, Program execution return 0, The main function has finished running , But at this time, the debugging is still in progress , Only wait until debugging The instruction completely jumped out of the main function range ( The entire function field referenced by braces ), Do not wait for user confirmation at this time , Straight out Program .
④ Close the program without waiting for user confirmation , This also happens when you directly run the executable generated by the source code .exe Or no parameter input without breakpoints during debugging , That is, program execution / Debug , But the user has no time to see and confirm , When the program is finished, it closes :
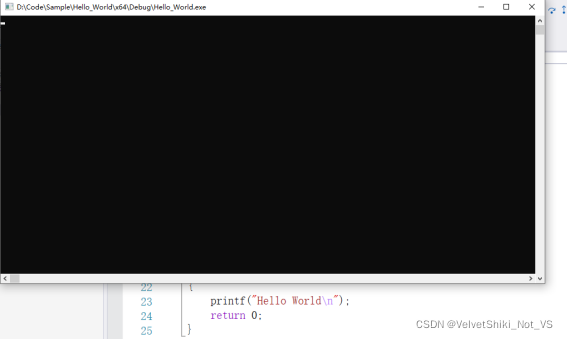
A direct debugging diagram quickly intercepted by hand
Directly execute executable programs , Because there is no breakpoint , So the program flashed by
5. In this case , It's not a test of eyesight and hand speed , There should be a more scientific approach , After concluding , share Three methods can be used :
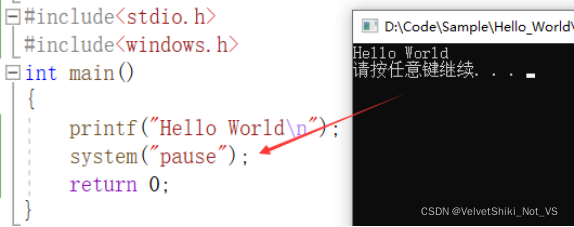
① Introduce system commands into the header file #include<windows.h>, And end the statement in the main function return 0; Add a sentence before System pause command system(“pause”);, You can stop the execution program or nonparametric debugging and wait for the observation results :
② The most common method , No need to introduce additional header files , Put the above system Change the command to getchar The implicit pause of the program can be realized , You can insert a breakpoint to observe the execution of the statement :
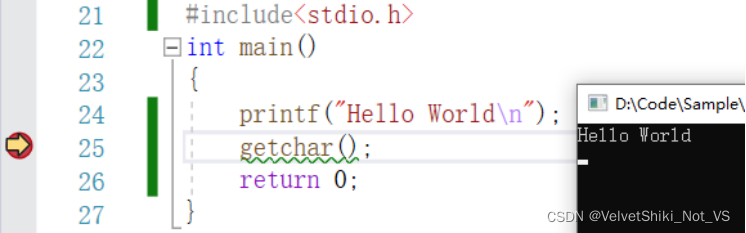
It can be seen that the program is waiting for the library function getchar Wait for the command , Press down F10 Execute function , The cursor stays on the next line , Wait for the user to enter a character before terminating the program .
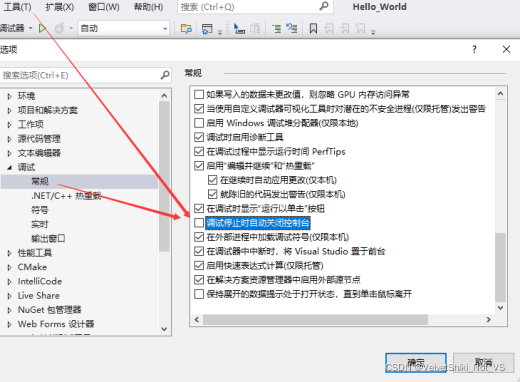
③ The most violent way , For the use of VS The user of the compiler can open the general... In the tool options , Automatically close the console and uncheck when debugging stops , But this method is only for debugging code , The official code run will still automatically close the console , For expediency .
Refer to the following articles for knowledge preheating at this stage , Coherent reading is easier to understand .
版权声明
本文为[VelvetShiki_ Not_ VS]所创,转载请带上原文链接,感谢
https://yzsam.com/2022/04/202204231411217195.html
边栏推荐
猜你喜欢
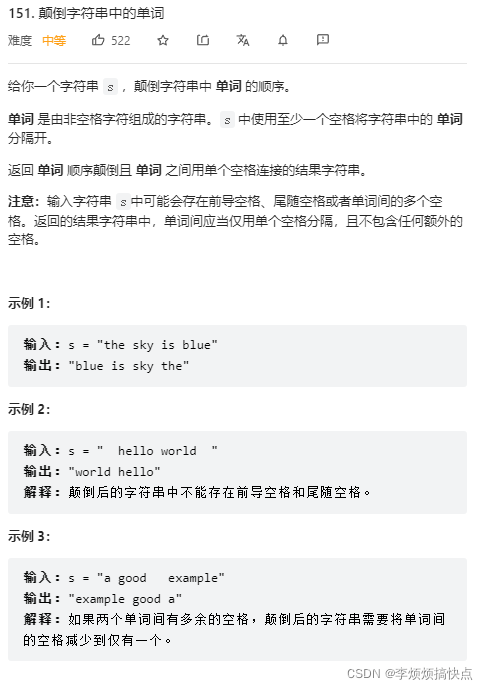
Leetcode151 - invert words in string - String - simulation

Mds55-16-asemi rectifier module mds55-16
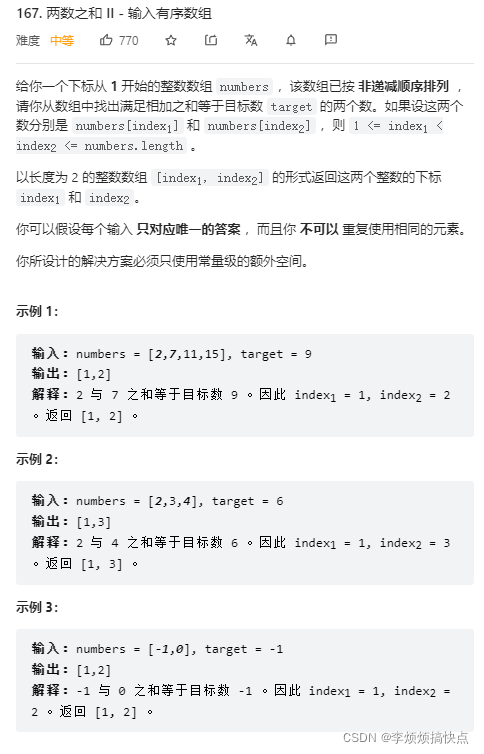
Leetcode167 - sum of two numbers II - double pointer - bisection - array - Search
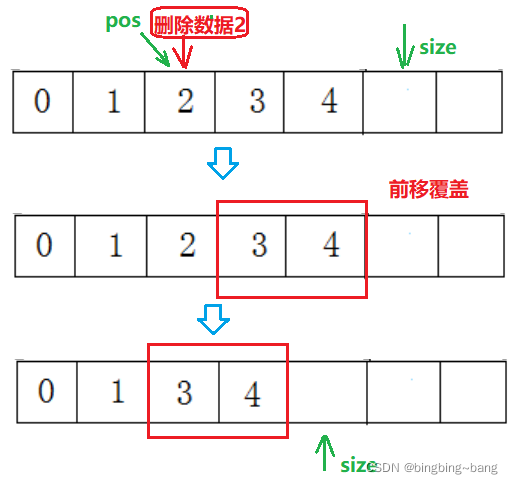
冰冰学习笔记:一步一步带你实现顺序表
你还不知道责任链模式的使用场景吗?
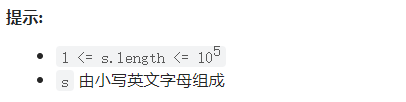
剑指 Offer II 019. 最多删除一个字符得到回文(简单)
你還不知道責任鏈模式的使用場景嗎?
在游戏世界组建一支AI团队,超参数的多智能体「大乱斗」开赛
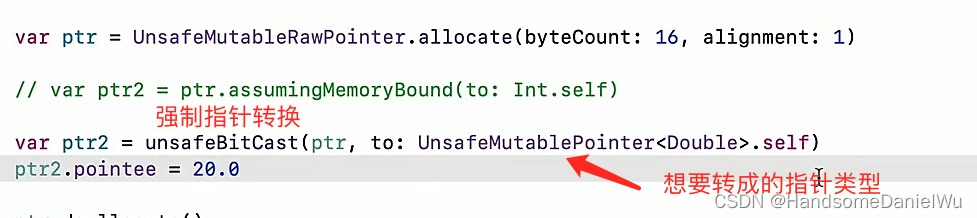
Do (local scope), initializer, memory conflict, swift pointer, inout, unsafepointer, unsafebitcast, success
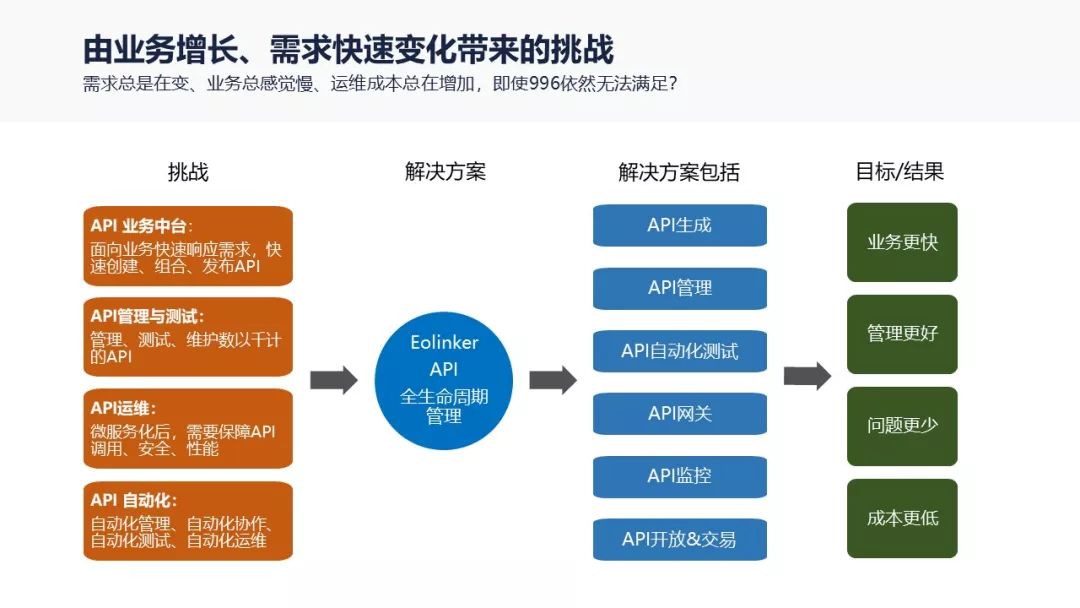
eolink 如何助力遠程辦公
随机推荐
剑指 Offer II 019. 最多删除一个字符得到回文(简单)
like和regexp差别
Explain TCP's three handshakes in detail
1 - first knowledge of go language
[untitled]
8.3 language model and data set
For 22 years, you didn't know the file contained vulnerabilities?
eolink 如何助力远程办公
do(Local scope)、初始化器、内存冲突、Swift指针、inout、unsafepointer、unsafeBitCast、successor、
多语言通信基础 06 go实现grpc的四种数据流模式实现
UML learning_ Day2
The art of automation
【工厂模式详解】工厂方法模式
GIS数据处理-cesium中模型位置设置
Frame synchronization implementation
Vous ne connaissez pas encore les scénarios d'utilisation du modèle de chaîne de responsabilité?
SQL中HAVING和WHERE的区别
Sword finger offer II 019 Delete at most one character to get palindrome (simple)
1-初识Go语言
Fill in the next right node pointer II of each node [classical hierarchy traversal | regarded as linked list]