当前位置:网站首页>Dump file generation, content, and analysis
Dump file generation, content, and analysis
2022-08-11 00:01:00 【idle cat】
The tools used in this article are just a brief introduction,Gives you a sense of awareness,The emphasis is on familiarity with the verification idea
为啥需要dump内存文件
服务器CPU,Memory footprint skyrocketed,或者GC频繁,The first thing to rule out is memory leaks,That is, the space for objects that are not in memory is not reclaimed in time.To detect memory leaks, you need to see which class occupies a larger share of memory,to locate the code,然后修改.
分析思路
1. cpu,mem 飙升,确认是否webService issues and recordspid
2. 查看GC情况,如果每次gcThe effect is not obvious indicating a memory leak
3. 导出dump,分析.定位占用top n的类
4. Analyze and find Where the classes created take up a lot
制作dump
jstack
打印线程的栈信息,制作线程Dump.
jstack <进程ID> >> <输出文件>
jstack 2316 >> c:\thread.txt
## Linux下使用KillCommand making threadDump,输出线程Dump到目标Java进程的标准输出
kill -quit <进程ID>
kill -3 <进程ID>
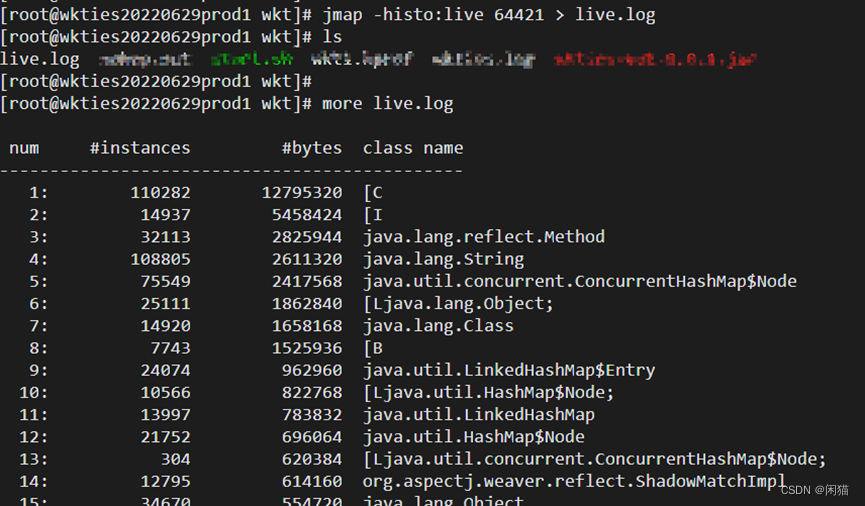
jmap
使用jmapcommand to make a heapDump
# Print the size and number of surviving objects
jmap -histo:live <pid>
jmap -histo:live 64421 > live.log
# Heap files are stored in binary mode
jmap -dump:format=b,file=文件名.hprof <进程ID>
Generate files in binary/opt/wkt/wkt1.hprof,进程PID=64421
jmap -dump:format=b,file=/opt/wkt/wkt1.hprof 64421

DumpBase padding before reading
Dump文件内容
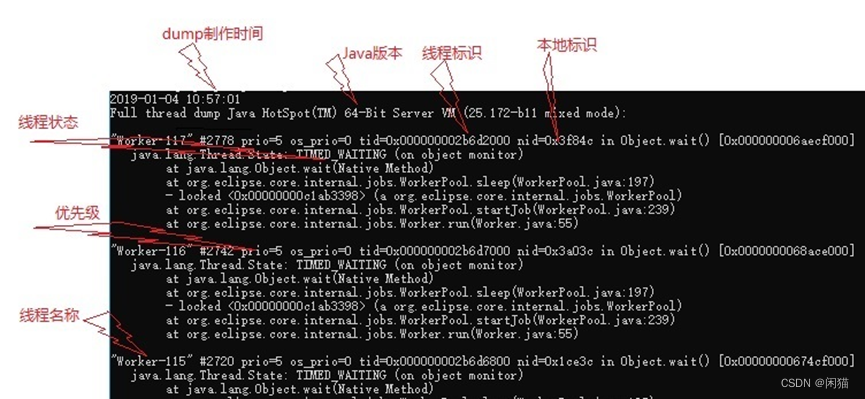
制作时间
Java 版本
线程信息:名称、优先级、标识、状态、堆栈
死锁信息:存在直接JavaIt is only included when the thread is deadlocked.
内存信息:使用killIncluded when making.
线程信息
线程状态
NEW: 未启动的.不会出现在Dump中.
RUNNABLE: 在虚拟机内执行的.
BLOCKED: 受阻塞并等待监视器锁.
WATING: 无限期等待另一个线程执行特定操作.
TIMED_WATING: 有时限的等待另一个线程的特定操作.
TERMINATED: 已退出的.
监视器(Monitor)
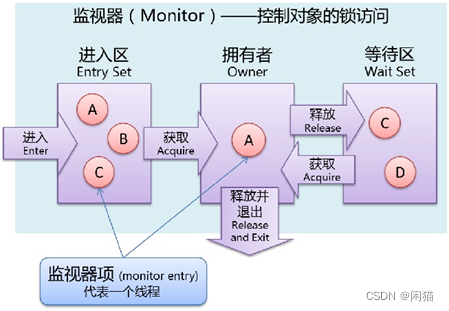
监视器:Access control structure for object locks.Also refers to an object's lock.
monitor item:Thread proxy.
进入区:表示线程通过synchronized要求获取对象的锁.如果对象未被锁住,then enters the owner;否则则Wait in the entry area.一旦对象锁被其他线程释放,立即参与竞争.
拥有者:表示某一线程成功竞争到对象锁.
等待区:表示线程通过对象的wait方法,释放对象的锁,并在等待区等待被唤醒.
调用修饰
locked <地址> 目标
waiting to lock <地址> 目标
waiting on <地址> 目标
parking to wait for <地址> 目标
实例锁: (a 类名)——synchronized对象.
类锁:(a Class for 类名)——静态synchronized方法
locked:通过synchronized关键字,成功获取到了对象的锁,成为监视器的拥有者,在临界区内操作.对象锁是可以线程重入的.
at oracle.jdbc.driver.PhysicalConnection.prepareStatement
- locked <0x00002aab63bf7f58> (a oracle.jdbc.driver.T4CConnection)
at oracle.jdbc.driver.PhysicalConnection.prepareStatement
- locked <0x00002aab63bf7f58> (a oracle.jdbc.driver.T4CConnection)
at com..datasource.PooledConnection.prepareStatement
synchronized (conn) { // conn的类型是T4CConnection
// Synchronized block operations
}
waiting to lock:通过synchronized关键字,没有获取到了对象的锁,线程在监视器的进入区等待.在调用栈顶出现,线程状态为Blocked.
at com..impl.CacheHolder.isVisibleIn(CacheHolder.java:165)
- waiting to lock <0x0000000097ba9aa8> (a CacheHolder)
at com..impl.CacheGroup$Index.findHolder
at com..impl.ContextImpl.find
at com..BaseDataCenter.findInfo
synchronized (holder) { // holder的类型是CacheHolder
// 临界区操作
}
waiting on:通过synchronized关键字,成功获取到了对象的锁后,调用了wait方法,Enter the waiting area of the object and wait.在调用栈顶出现,线程状态为WAITING或TIMED_WATING.
at java.lang.Object.wait(Native Method)
- waiting on <0x00000000da2defb0> (a WorkingThread)
at com..WorkingManager.getWorkToDo
- locked <0x00000000da2defb0> (a WorkingThread)
at com..WorkingThread.run
synchronized(thread) {
// Synchronized block operations……
try {
thread.wait();
catch(InterruptException e) { /* 中断异常处理 */ }
}
parking to wait for
at sun.misc.Unsafe.park(Native Method)
- parking to wait for <0x00000000eb8f35c8> (a FutureTask$Sync)
at java.util.concurrent.locks.LockSupport.park(LockSupport:156)
...
at java.util.concurrent.locks.ReentrantReadWriteLock$WriteLock.lock()
park是基本的线程阻塞原语,不通过监视器在对象上阻塞.
随concurrent包会出现的新的机制,与synchronized体系不同.
synchronizedModel-related call modifiers
1.locked <对象地址> (a 类名)
使用synchronized申请对象锁成功,监视器的拥有者.
2. waiting to lock <对象地址> (a 类名)
使用synchronized申请对象锁未成功,Wait in the entry area.
3. waiting on <对象地址> (a 类名)
使用synchronized申请对象锁成功后,Release the lock and wait in the waiting area
分析模式
wait on monitor entry 被阻塞的,肯定有问题
runnable 注意IO线程
in Object.wait() 注意非线程池等待
虚拟机执行Full GC时,会阻塞所有的用户线程.因此,即时获取到同步锁的线程也有可能被阻塞.
"wss-635" waiting for monitor entry
java.lang.Thread.State: BLOCKED (on object monitor)
at com..impl.CacheHolder.isVisibleIn(CacheHolder.java:165)
- locked <0x0000000097ba9aa8> (a com..CacheHolder)
分析工具
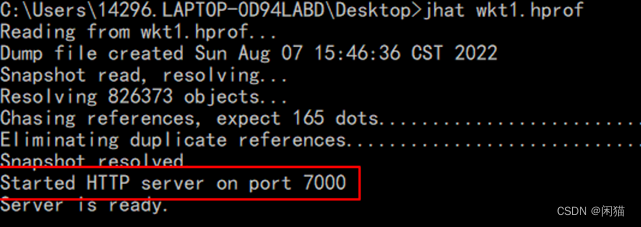
jhat
下载生成dump二进制文件wkt1.hprof,并下载到本地.
cmd中输入:jhat wkt1.hprof
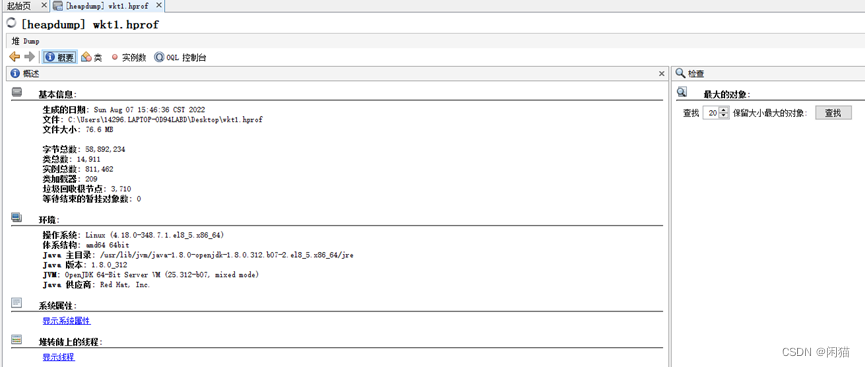
jvisualvm
window可视化界面,Ctr+R,CMD,输入jvisualvm回车,打开主界面后,点击【文件】下【装入】
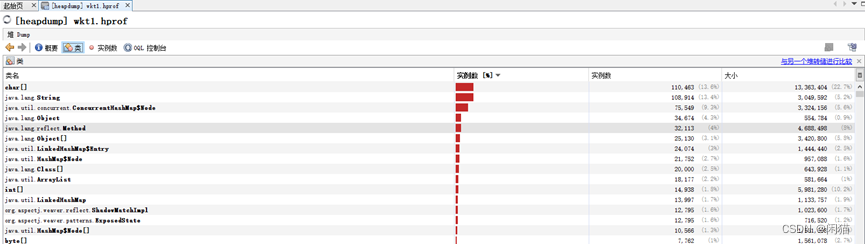
 查看类,You can see the memory size occupied by different classes:
Jvm.分析工具(jps,jmap,jstack,jinfo,jconsole,jvisualvm,arthas,jprofiler,mat)_闲猫的博客-CSDN博客
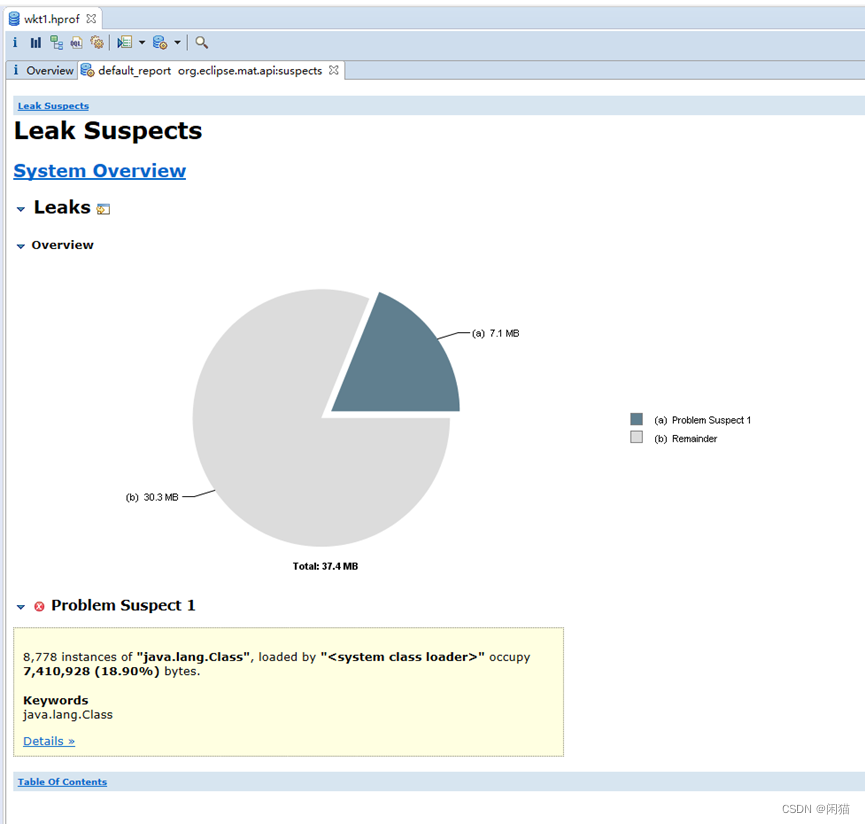
MAT
MAT(MemoryAnalyzerTool)是EclipseA memory analysis tool is provided,作为JavaA useful tool for memory analysis,掌握MATThe basic usage of is basically one of the most important basic skills in positioning problems.
下载地址:链接:https://pan.baidu.com/s/1Qyy1bJQtosNlJ9VOt9GzVA 提取码:8hgd
Jvm.分析工具(jps,jmap,jstack,jinfo,jconsole,jvisualvm,arthas,jprofiler,mat)_闲猫的博客-CSDN博客
边栏推荐
猜你喜欢
![[Excel知识技能] 将数值格式数字转换为文本格式](/img/fb/79d6928456f090d47f0fe7a5074979.png)

![[C language] Detailed explanation of data storage](/img/3f/3799a3ba0f2642272e15bd7a3e511f.png)
![[Excel知识技能] 将文本型数字转换为数值格式](/img/7e/16a068025ec2639b343436c7f5b245.png)
随机推荐
Rust从入门到精通05-语句和表达式
翻译软件哪个准确度高【免费】
VR全景+安全科普教育,让学生们提高安全意识
[C language articles] Expression evaluation (implicit type conversion, arithmetic conversion)
Parse method's parameter list (including parameter names)
C语言%(%d,%c...)
[Excel知识技能] 将数值格式数字转换为文本格式
[Excel知识技能] 将“假“日期转为“真“日期格式
13. 内容协商
工程师如何对待开源
In 22 years, the salary of programmers nationwide in January was released, only to know that there are so many with annual salary of more than 400,000?
Mathematical modeling preparation knowledge
Which translation software is more accurate [Free]
10. Notes on receiving parameters
Is there a way out in the testing industry if it is purely business testing?
Promise in detail
[C] the C language program design, dynamic address book (order)
SAS data processing technology (1)
深度学习 Transformer架构解析
Multilingual Translation - Multilingual Translation Software Free