当前位置:网站首页>Method 2 of drawing ROC curve in R language: proc package
Method 2 of drawing ROC curve in R language: proc package
2022-04-23 15:53:00 【zoujiahui_ two thousand and eighteen】
Introduce
pROC In bag roc() Can draw the classification problem roc curve , Created is S3 object ;ROCR Packages can also be drawn roc curve , But what was created was S4 object .
roc() Function introduction
roc(...)
## S3 method for class 'formula'
roc(formula, data, ...)
## S3 method for class 'data.frame'
roc(data, response, predictor,
ret = c("roc", "coords", "all_coords"), ...)
## Default S3 method:
roc(response, predictor, controls, cases,
density.controls, density.cases,
levels=base::levels(as.factor(response)), percent=FALSE, na.rm=TRUE,
direction=c("auto", "<", ">"), algorithm = 6, quiet = FALSE,
smooth=FALSE, auc=TRUE, ci=FALSE, plot=FALSE, smooth.method="binormal",
smooth.n=512, ci.method=NULL, density=NULL, ...)
roc_(data, response, predictor, ret = c("roc", "coords", "all_coords"), ...)
Parameter Introduction
-
response
Is the real classification
a factor, numeric or character vector of responses (true class), typically encoded with 0 (controls) and 1 (cases). Only two classes can be used in a ROC curve. If the vector contains more than two unique values, or if their order could be ambiguous, use levels to specify which values must be used as control and case value. If the first argument was a data.frame, response should be the name of the column in data containing the response, quoted for roc_, and optionally quoted for roc.data.frame (non-standard evaluation or NSE). -
predictor
The probability of prediction
a numeric or ordered vector of the same length than response, containing the predicted value of each observation. If the first argument was a data.frame, predictor should be the name of the column in data containing the predictor, quoted for roc_, and optionally quoted for roc.data.frame (non-standard evaluation or NSE). -
controls, cases
instead of response, predictor, the data can be supplied as two numeric or ordered vectors containing the predictor values for control and case observations. -
density.controls, density.cases
a smoothed ROC curve can be built directly from two densities on identical x points, as in smooth. -
formula, data
a formula of the type response~predictor. If mulitple predictors are passed, a named list of roc objects will be returned. Additional arguments data and subset, but not na.action are supported, see model.frame for more details. -
levels
the value of the response for controls and cases respectively. By default, the first two values of levels(as.factor(response)) are taken, and the remaining levels are ignored. It usually captures two-class factor data correctly, but will frequently fail for other data types (response factor with more than 2 levels, or for example if your response is coded “controls” and “cases”, the levels will be inverted) and must then be specified here. If your data is coded as 0 and 1 with 0 being the controls, you can safely omit this argument. -
percent
if the sensitivities, specificities and AUC must be given in percent (TRUE) or in fraction (FALSE, default). -
na.rm
if TRUE, the NA values will be removed (ignored by roc.formula). -
direction
in which direction to make the comparison? “auto” (default): automatically define in which group the median is higher and take the direction accordingly. “>”: if the predictor values for the control group are higher than the values of the case group (controls > t >= cases). “<”: if the predictor values for the control group are lower or equal than the values of the case group (controls < t <= cases). You should set this explicity to “>” or “<” whenever you are resampling or randomizing the data, otherwise the curves will be biased towards higher AUC values. -
algorithm
the method used to compute sensitivity and specificity, an integer of length 1 between 0 and 6. 1: a safe, well-tested, pure-R code that is efficient when the number of thresholds is low. It goes with O(T*N). 2: an alternative pure-R algorithm that goes in O(N). Typically faster than 1 when the number of thresholds of the ROC curve is above 1000. Less tested than 1. 3: a C++ implementation of 1, about 3-5x faster. Typically the fastest with ROC curves with less than 50-100 thresholds, but has a very bad worst-case when that number increases. 4 (debug only, slow): runs algorithms 1 to 3 and makes sure they return the same values. 5: select 2 or 3 based on the number of thresholds. 6 (default): quickly select the algorithm on the class of the data: 2 for numeric and 3 for ordered. 0: use microbenchmark to choose between 2 and 3. -
ret
for roc.data.frame only, whether to return the threshold sensitivity and specificity at all thresholds (“coords”), all the coordinates at all thresholds (“all_coords”) or the roc object (“roc”). -
quiet
set to TRUE to turn off messages when direction and levels are auto-detected. -
smooth
if TRUE, the ROC curve is passed to smooth to be smoothed. -
auc
compute the area under the curve (AUC)? If TRUE (default), additional arguments can be passed to auc. -
ci
compute the confidence interval (CI)? If set to TRUE, additional arguments can be passed to ci. -
plot
plot the ROC curve? If TRUE, additional arguments can be passed to plot.roc. -
smooth.method, smooth.n, ci.method
in roc.formula and roc.default, the method and n arguments to smooth (if smooth=TRUE) and of=“auc”) must be passed as smooth.method, smooth.n and ci.method to avoid confusions. -
density
density argument passed to smooth. -
…
further arguments passed to or from other methods, and especially:-
auc: partial.auc, partial.auc.focus, partial.auc.correct.
-
ci: of, conf.level, boot.n, boot.stratified, progress
-
ci.auc:, reuse.auc, method
-
ci.thresholds: thresholds
-
ci.se: sensitivities
-
ci.sp: specificities
-
plot.roc: add, col and most other arguments to the plot.roc function. See plot.roc directly for more details.
-
smooth: method, n, and all other arguments. See smooth for more details.
-
Return value
-
auc
if called with auc=TRUE, a numeric of class “auc” as defined in auc. -
ci
if called with ci=TRUE, a numeric of class “ci” as defined in ci. -
response
the response vector. Patients whose response is not %in% levels are discarded. If NA values were removed, a na.action attribute similar to na.omit stores the row numbers. -
predictor
the predictor vector converted to numeric as used to build the ROC curve. Patients whose response is not %in% levels are discarded. If NA values were removed, a na.action attribute similar to na.omit stores the row numbers. -
original.predictor, original.response
the response and predictor vectors as passed in argument. -
levels
the levels of the response as defined in argument. -
controls
the predictor values for the control observations. -
cases
the predictor values for the cases. -
percent
if the sensitivities, specificities and AUC are reported in percent, as defined in argument. -
direction
the direction of the comparison, as defined in argument. -
fun.sesp
the function used to compute sensitivities and specificities. Will be re-used in bootstrap operations. -
sensitivities
the sensitivities defining the ROC curve. -
specificities
the specificities defining the ROC curve. -
thresholds
the thresholds at which the sensitivities and specificities were computed. See below for details. -
call
how the function was called. See match.call for more details.
example
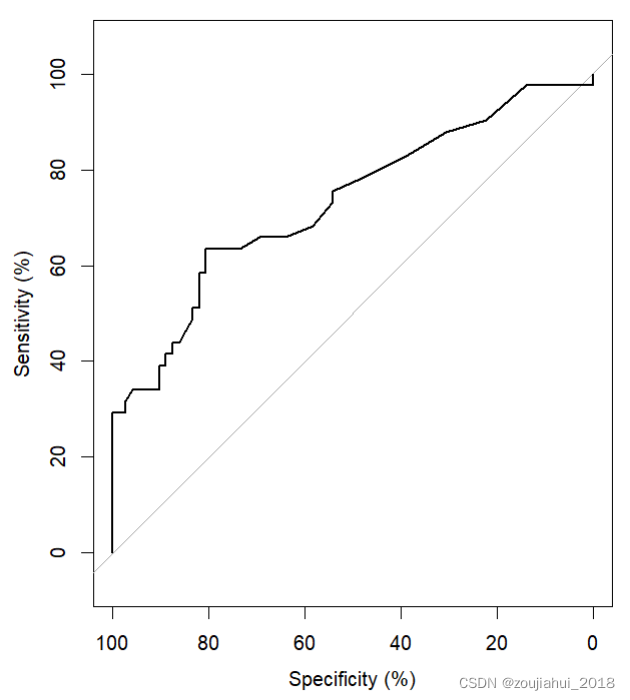
data(aSAH)
# With a formula:
roc(outcome ~ s100b, data=aSAH)
# Call:
# roc.formula(formula = outcome ~ s100b, data = aSAH)
#
# Data: s100b in 72 controls (outcome Good) < 41 cases (outcome Poor).
# Area under the curve: 0.7314
# Plot and CI (see plot.roc and ci for more options):
roc(aSAH$outcome, aSAH$s100b,
percent=TRUE, plot=TRUE, ci=TRUE)
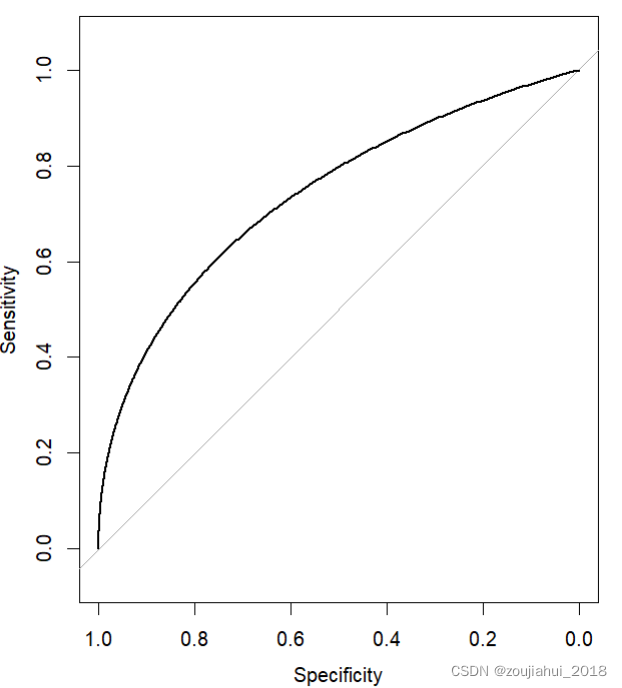
# Smoothed ROC curve
roc(aSAH$outcome, aSAH$s100b, plot=TRUE,smooth=TRUE)
版权声明
本文为[zoujiahui_ two thousand and eighteen]所创,转载请带上原文链接,感谢
https://yzsam.com/2022/04/202204231547288881.html
边栏推荐
- 腾讯Offer已拿,这99道算法高频面试题别漏了,80%都败在算法上
- Go concurrency and channel
- 小程序知识点积累
- Neodynamic Barcode Professional for WPF V11.0
- New developments: new trends in cooperation between smartmesh and meshbox
- leetcode-396 旋转函数
- One brush 312 - simple repetition set - Sword finger offer 03 Duplicate number in array (E)
- Cookie&Session
- 北京某信护网蓝队面试题目
- Spark 算子之coalesce与repartition
猜你喜欢
Unity Shader学习
Treatment of idempotency
Import address table analysis (calculated according to the library file name: number of imported functions, function serial number and function name)
【现代电子装联期末复习要点】

Vision of building interstellar computing network
5分钟,把你的Excel变成在线数据库,神奇的魔方网表excel数据库
Single architecture system re architecture
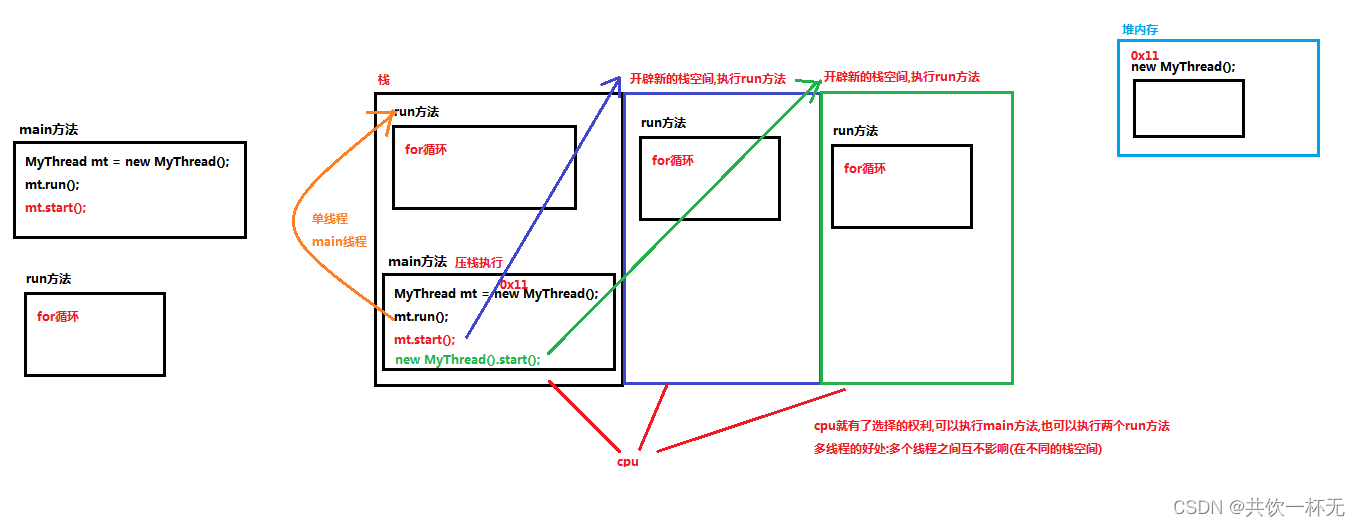
多线程原理和常用方法以及Thread和Runnable的区别

【AI周报】英伟达用AI设计芯片;不完美的Transformer要克服自注意力的理论缺陷
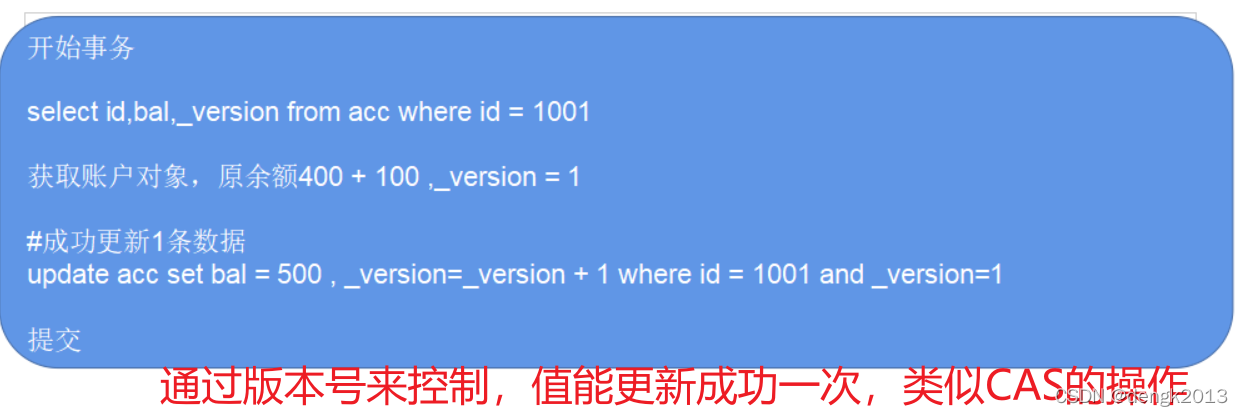
MySQL optimistic lock to solve concurrency conflict
随机推荐
New developments: new trends in cooperation between smartmesh and meshbox
负载均衡器
Merging of Shanzhai version [i]
Upgrade MySQL 5.1 to 5.66
Metalife established a strategic partnership with ESTV and appointed its CEO Eric Yoon as a consultant
Control structure (I)
js正则判断域名或者IP的端口路径是否正确
c语言---指针进阶
Single architecture system re architecture
Open source project recommendation: 3D point cloud processing software paraview, based on QT and VTK
Deletes the least frequently occurring character in the string
【开源工具分享】单片机调试助手(示波/改值/日志) - LinkScope
Spark 算子之coalesce与repartition
leetcode-396 旋转函数
[self entertainment] construction notes week 2
Go并发和通道
腾讯Offer已拿,这99道算法高频面试题别漏了,80%都败在算法上
js正則判斷域名或者IP的端口路徑是否正確
Distinct use of spark operator
Filter usage of spark operator