当前位置:网站首页>使用决策树对鸢尾花进行分类
使用决策树对鸢尾花进行分类
2022-08-10 13:30:00 【KylinSchmidt】
本文整理自《Python机器学习》
决策树
决策树可视为数据从顶向下划分的一种方法,通常为二叉树。
通过决策树算法,从树根开始,基于可获得的最大信息增益(Information Gain, IG)的特征对数据进行划分。
目标函数能够在每次划分时实现对信息增益的最大化,其定义如下:
IG ( D p , f ) = I ( D p ) − ∑ j = 1 m N j N p I ( D j ) \text{IG}(D_p,f)=I(D_p)-\sum_{j=1}^m\frac{N_j}{N_p}I(D_j) IG(Dp,f)=I(Dp)−j=1∑mNpNjI(Dj)
其中 f f f为将要进行划分的特征, D p D_p Dp与 D j D_j Dj分别为父节点和第 j j j个子节点, I I I为不纯度衡量标准, N p N_p Np为父节点中样本数量, N j N_j Nj为第 j j j个子节点中样本的数量。上式即表示,信息增益是父节点的不纯度与所有子节点不纯度总和之差,子节点的不纯度越低,信息增益越大。
对于二叉树(scikit-learn中的实现方式)有:
IG ( D p , a ) = I ( D p ) − N l e f t N p I ( D l e f t ) − N r i g h t N p I ( D r i g h t ) \text{IG}(D_p,a)=I(D_p)-\frac{N_{left}}{N_p}I(D_{left})-\frac{N_{right}}{N_p}I(D_{right}) IG(Dp,a)=I(Dp)−NpNleftI(Dleft)−NpNrightI(Dright)
二叉决策树主要有三类不纯度衡量标准。
熵(entropy):
I H ( t ) = − ∑ i = 1 c p ( i ∣ t ) log 2 p ( i ∣ t ) I_H(t)=-\sum_{i=1}^cp(i|t)\log_2p(i|t) IH(t)=−i=1∑cp(i∣t)log2p(i∣t)
基尼系数(Gini index):
I G ( t ) = 1 − ∑ i = 1 c p ( i ∣ t ) 2 I_G(t)=1-\sum_{i=1}^cp(i|t)^2 IG(t)=1−i=1∑cp(i∣t)2
误分类率(classification error)
I E = 1 − max { p ( i ∣ t ) } I_E=1-\max\{p(i|t)\} IE=1−max{ p(i∣t)}
p ( i ∣ t ) p(i|t) p(i∣t)为特定节点 t t t中,属于类别 i i i的样本占特定节点 t t t中样本总数的比例。
实践中,基尼系数和熵会产生非常相似的效果,不会花大量时间用不纯度评判决策树的好坏,而尝试使用不同的剪枝算法,误分类率是对于剪枝方法的一个很好的准则但不建议用于决策树的构建。
样本属于类别1,概率介于[0,1]情况下三种不纯度的图像可由如下代码构建:
import matplotlib.pyplot as plt
import numpy as np


def gini(p):
    return (p)*(1-(p)) + (1-p)*(1-(1-p))


def entropy(p):
    return -p*np.log2(p)-(1-p)*np.log2((1-p))


def error(p):
    return 1-np.max([p, 1-p])


x = np.arange(0, 1, 0.01)
giniVal=gini(x)
ent = [entropy(p) if p !=0 else None for p in x]
sc_ent = [e*0.5 if e else None for e in ent] # 按0.5比例缩放
err = [error(i) for i in x]
fig = plt.figure()
ax = plt.subplot(111)
for i, lab, ls, c in zip([ent, sc_ent, gini(x), err], ['Entropy', 'Entropy (scaled)', 'Gini Impurity', 'Missclassification Error'], ['-', '-', '--','-.'],['black','lightgray', 'red', 'green', 'cyan']):
    line = ax.plot(x, i, label=lab, linestyle=ls, lw=2, color=c)
ax.legend(loc='upper center', bbox_to_anchor=(0.5,1.15), ncol=3, fancybox=True, shadow=False)
ax.axhline(y=0.5, linewidth=1, color='k', linestyle='--') # horizon line
ax.axhline(y=1.0, linewidth=1, color='k', linestyle='--')
plt.ylim([0, 1.1])
plt.xlabel('p(i=1)')
plt.ylabel('Impurity Index')
plt.show()
所得结果如下:
使用scikit-learn中的决策树对鸢尾花进行分类
from sklearn import datasets
from sklearn.model_selection import train_test_split
from sklearn.preprocessing import StandardScaler
from matplotlib.colors import ListedColormap
import matplotlib.pyplot as plt
import numpy as np
from sklearn.tree import DecisionTreeClassifier
from sklearn.tree import export_graphviz


iris = datasets.load_iris()
X = iris.data[:, [2, 3]]
y = iris.target
X_train, X_test, y_train, y_test = train_test_split(X,y,test_size=0.3,random_state=0)

sc = StandardScaler()
sc.fit(X_train)
X_train_std = sc.transform(X_train)
X_test_std: object = sc.transform(X_test)


def plot_decision_regions(X, y, classifier, test_idx=None, resolution=0.02):
    markers = ('s', 'x', 'o', '^', 'v')
    colors = ('red', 'blue', 'lightgreen', 'gray', 'cyan')
    cmap = ListedColormap(colors[:len(np.unique(y))])
    x1_min, x1_max = X[:, 0].min() - 1, X[:, 0].max() + 1
    x2_min, x2_max = X[:, 1].min() - 1, X[:, 1].max() + 1
    xx1, xx2 = np.meshgrid(np.arange(x1_min, x1_max, resolution),
                           np.arange(x2_min, x2_max, resolution))
    Z = classifier.predict(np.array([xx1.ravel(), xx2.ravel()]).T)
    Z = Z.reshape(xx1.shape)
    plt.contourf(xx1, xx2, Z, alpha=0.4, cmap=cmap)
    plt.xlim(xx1.min(), xx1.max())
    plt.ylim = (xx2.min(), xx2.max())
    X_test, y_test = X[test_idx, :], y[test_idx]
    for idx, cl in enumerate(np.unique(y)):
        plt.scatter(x=X[y == cl, 0], y=X[y == cl, 1], alpha=0.8, c=cmap(idx), marker=markers[idx], label=cl)
    if test_idx:
        X_test, y_test = X[test_idx, :], y[test_idx]
        plt.scatter(X_test[:, 0], X_test[:, 1], c='black', alpha=0.8, linewidths=1, marker='o', s=10, label='test set')


tree = DecisionTreeClassifier(criterion='entropy', max_depth=3, random_state=0)
tree.fit(X_train, y_train)
X_combined=np.vstack((X_train, X_test))
y_combined=np.hstack((y_train, y_test))
plot_decision_regions(X_combined, y_combined,classifier=tree, test_idx=range(105, 150))
plt.xlabel('petal length [cm]')
plt.ylabel('petal width [cm]')
plt.legend(loc='upper left')
plt.show()

export_graphviz(tree, out_file='tree.dot',feature_names=['petal length', 'petal width']) # 导出为dot文件
分类结果如下:
对于输出的tree.dot文件,我们可以通过GraphViz在命令行中输入指令
dot -Tpng tree.dot -o tree.png
转换为决策树的直观图片: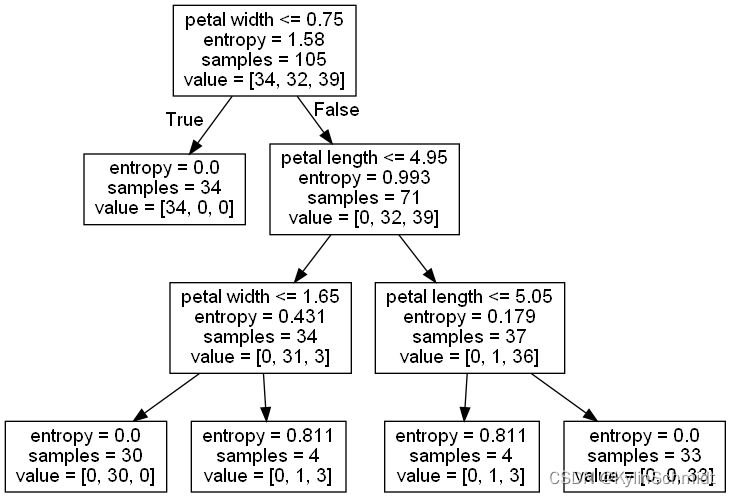
GraphViz可以在www.graphviz.org免费下载。
边栏推荐
- 进程和计划任务管理
- 第三方软件测评有什么作用?权威软件检测机构推荐
- 【219】慕课三千多的那个go工程师的培训课笔记 02 go语言的编程思想
- 一种能让大型数据聚类快2000倍的方法,真不戳
- 一种能让大型数据聚类快2000倍的方法,真不戳
- Jiugongge lottery animation
- AWS 安全基础知识
- Ethernet channel 以太信道
- mSystems | Zhongnong Wang Jie Group Reveals the Mechanisms Affecting Soil "Plastic Interstitial" Microbial Communities
- Efficient and Robust 2D-to-BEV Representation Learning via Geometry-guided Kernel Transformer 论文笔记
猜你喜欢

AWS Security Fundamentals

mSystems | Zhongnong Wang Jie Group Reveals the Mechanisms Affecting Soil "Plastic Interstitial" Microbial Communities
Stream通过findFirst()查找满足条件的一条数据

Jiugongge lottery animation
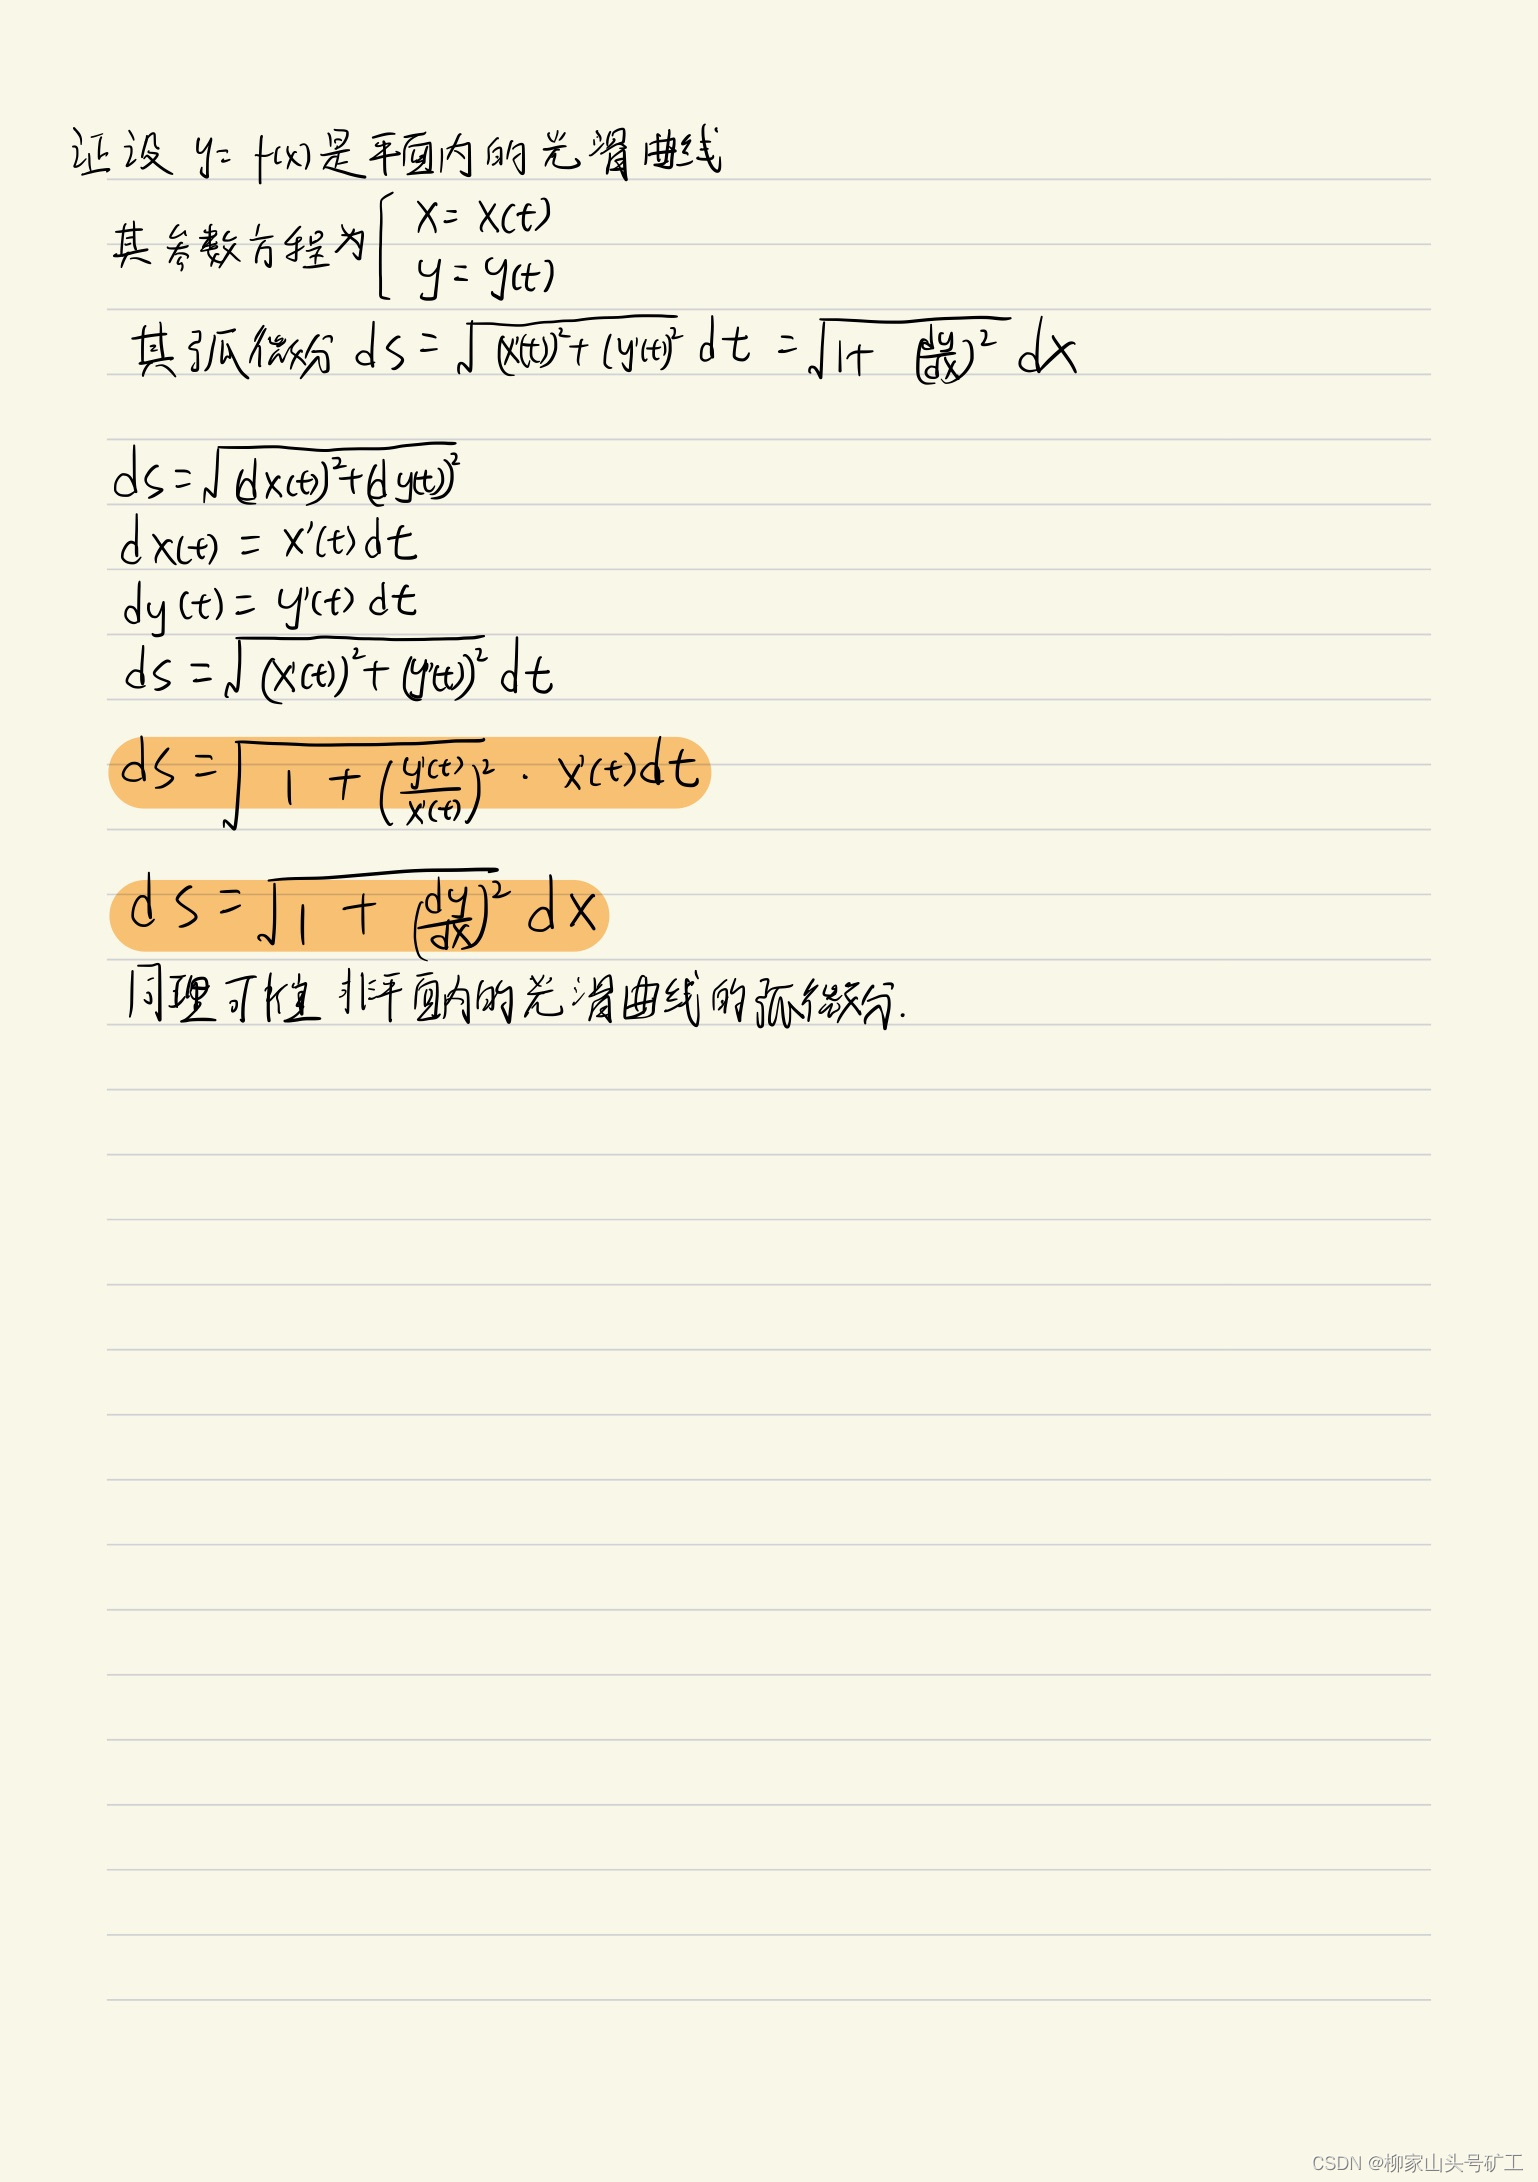
高数_证明_弧微分公式
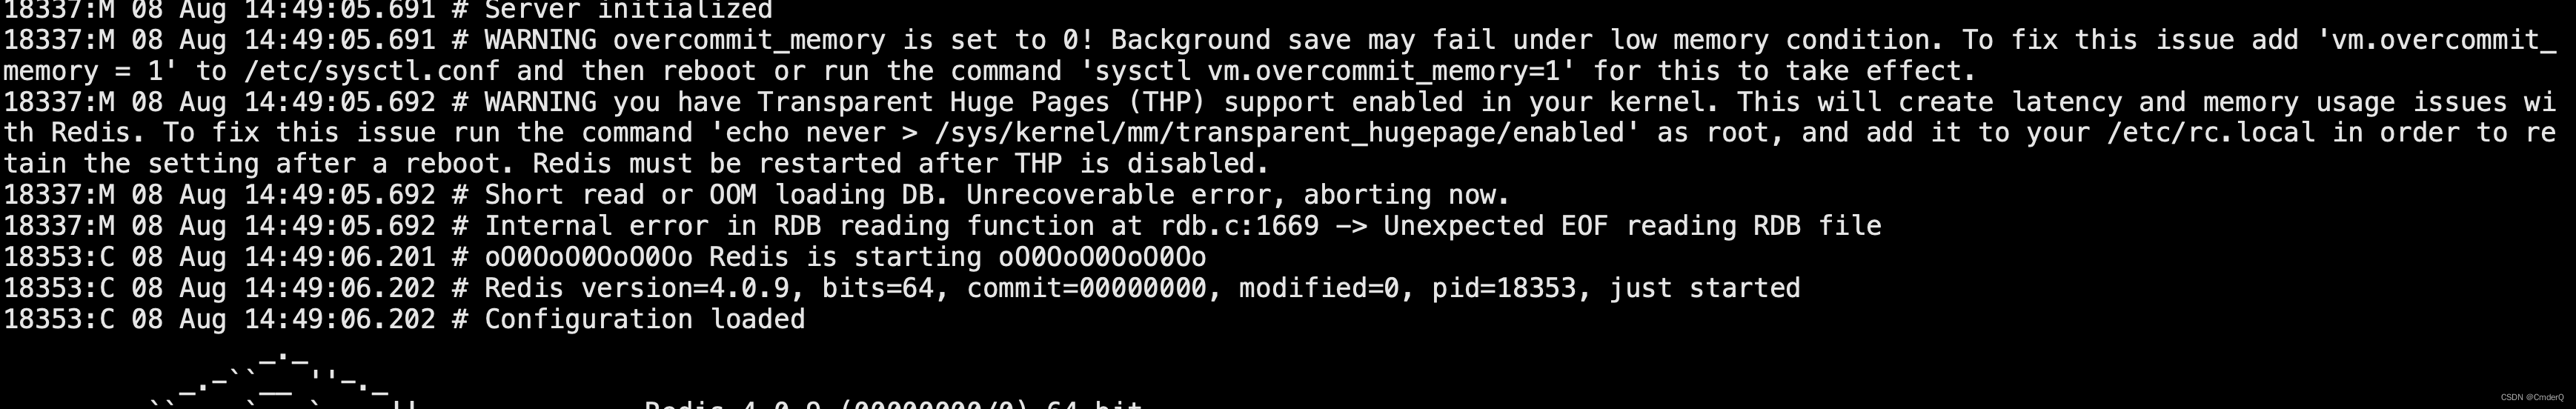
Short read or OOM loading DB. Unrecoverable error, aborting now

shell:常用小工具(sort、uniq、tr、cut)

Efficient and Robust 2D-to-BEV Representation Learning via Geometry-guided Kernel Transformer Paper Notes
Cloud Migration Practice of Redis

R语言实战应用案例:论文篇(一)-特殊柱形图绘制
随机推荐
代码随想录笔记_动态规划_70爬楼梯
NodeJs原理 - Stream(二)
[JS Advanced] Creating sub-objects and replacing this_10 in ES5 standard specification
A can make large data clustering method of 2000 times faster, don't poke
[target detection] small script: extract training set images and labels and update the index
递归递推之Fighting_小银考呀考不过四级
Fragment的show和hide
Reversing words in a string in LeetCode
学习日记8
什么?你还不会JVM调优?
用低代码驱动IT现代化
一种能让大型数据聚类快2000倍的方法,真不戳
C#WPF 图片在显示时没有问题,但在运行时图片显示不出来的解决
AWS 安全基础知识
A unit test report for CRM One Order Application log
作业
如何完成新媒体产品策划?
想通这点,治好 AI 打工人的精神内耗
作业8.9 构建TCP协议的服务器
“Oracle 封禁了我的账户”