当前位置:网站首页>在Istio中,到底怎么获取 Envoy 访问日志?
在Istio中,到底怎么获取 Envoy 访问日志?
2022-08-10 16:24:00 【InfoQ】
环境准备
httpbinkubectl apply -f samples/httpbin/httpbin.yamlsleepkubectl apply -f samples/sleep/sleep.yaml httpbinsleepkubectl -n istio-system edit configmap istiodata:
mesh: |-
accessLogEncoding: JSON
accessLogFile: /dev/stdoutaccessLogEncodingTEXTJSONTEXTJSONaccessLogFile测试访问日志
sleephttpbinexport SLEEP_POD=$(kubectl get pods -l app=sleep -o 'jsonpath={.items[0].metadata.name}')
kubectl exec "$SLEEP_POD" -c sleep -- curl -sS http://httpbin:8000/headers{
"headers": {
"Accept": "*/*",
"Host": "httpbin:8000",
"User-Agent": "curl/7.81.0-DEV",
"X-B3-Parentspanid": "ed0178f3e1f48dd1",
"X-B3-Sampled": "0",
"X-B3-Spanid": "6c38b689ee5ab0c8",
"X-B3-Traceid": "f17ce19c174cae85ed0178f3e1f48dd1",
"X-Envoy-Attempt-Count": "1",
"X-Forwarded-Client-Cert": "......"
}
}sleepkubectl logs -l app=sleep -c istio-proxysleephttpbin{
"authority": "httpbin:8000",
"bytes_received": 0,
"bytes_sent": 533,
"connection_termination_details": null,
"downstream_local_address": "172.24.146.239:8000",
"downstream_remote_address": "172.24.158.25:49350",
"duration": 3,
"method": "GET",
"path": "/headers",
"protocol": "HTTP/1.1",
"request_id": "ea40d320-348f-4f58-86d4-da157b0e0cca",
"requested_server_name": null,
"response_code": 200,
"response_code_details": "via_upstream",
"response_flags": "-",
"route_name": "default",
"start_time": "2022-07-04T10:00:09.401Z",
"upstream_cluster": "outbound|8000||httpbin.istio-demo.svc.cluster.local",
"upstream_host": "172.24.158.96:80",
"upstream_local_address": "172.24.158.25:41812",
"upstream_service_time": "2",
"upstream_transport_failure_reason": null,
"user_agent": "curl/7.81.0-DEV",
"x_forwarded_for": null
}httpbinkubectl logs -l app=httpbin -c istio-proxyhttpbinsleep{
"authority": "httpbin:8000",
"bytes_received": 0,
"bytes_sent": 533,
"connection_termination_details": null,
"downstream_local_address": "172.24.158.96:80",
"downstream_remote_address": "172.24.158.25:41812",
"duration": 2,
"method": "GET",
"path": "/headers",
"protocol": "HTTP/1.1",
"request_id": "ea40d320-348f-4f58-86d4-da157b0e0cca",
"requested_server_name": "outbound_.8000_._.httpbin.istio-demo.svc.cluster.local",
"response_code": 200,
"response_code_details": "via_upstream",
"response_flags": "-",
"route_name": "default",
"start_time": "2022-07-04T10:00:09.401Z",
"upstream_cluster": "inbound|80||",
"upstream_host": "172.24.158.96:80",
"upstream_local_address": "127.0.0.6:33665",
"upstream_service_time": "1",
"upstream_transport_failure_reason": null,
"user_agent": "curl/7.81.0-DEV",
"x_forwarded_for": null
}刨析Envoy日志
清理
httpbinsleepkubectl delete -f samples/httpbin/httpbin.yaml
kubectl delete -f samples/sleep/sleep.yaml 边栏推荐
猜你喜欢

How to use bitwise operators in C language
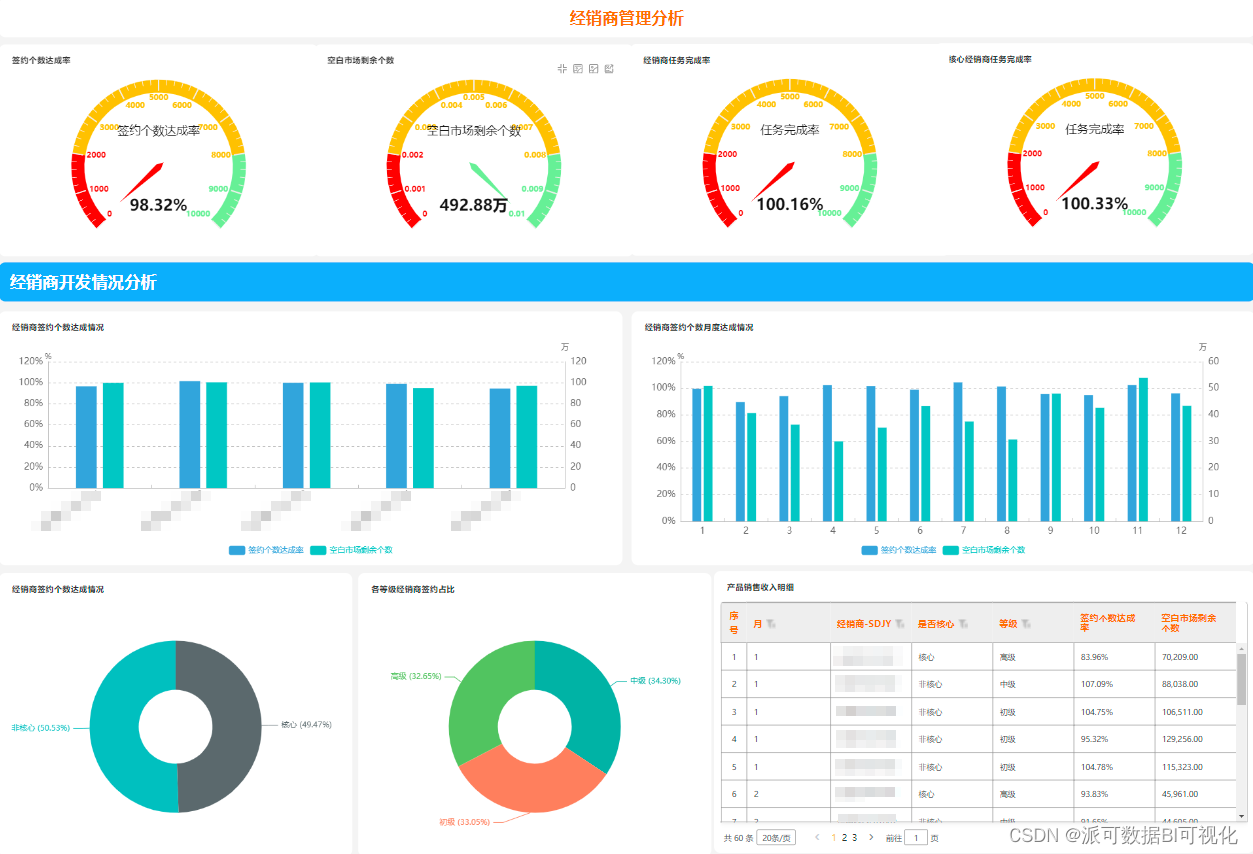
商业智能BI行业分析思维框架:铅酸蓄电池行业(二)
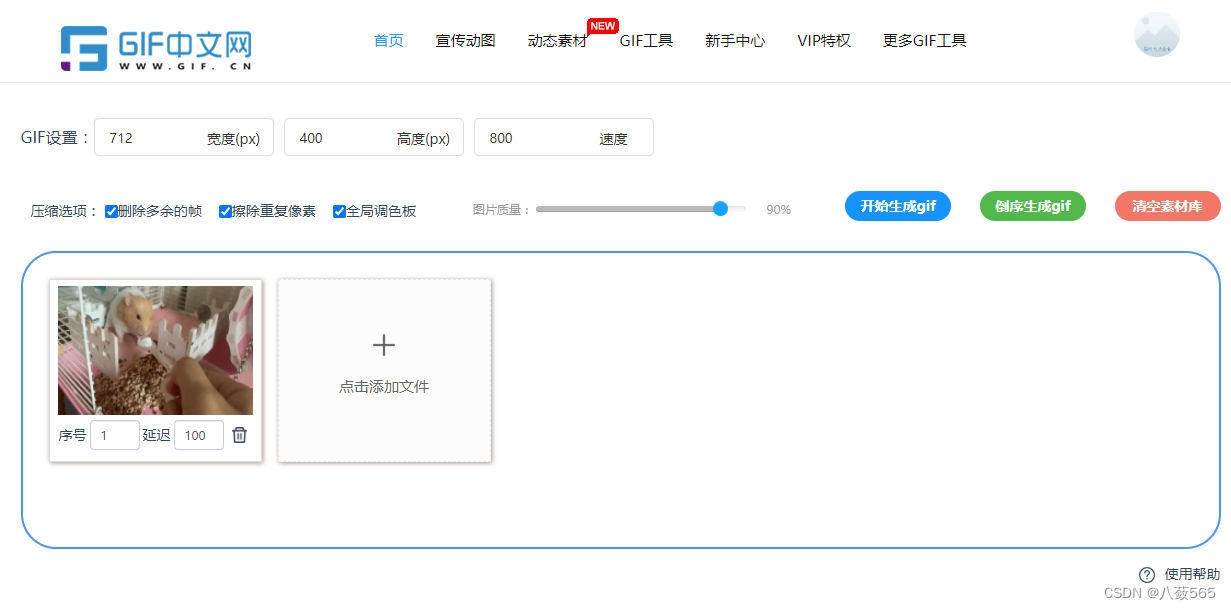
视频转gif怎样操作?1分钟在线视频转gif制作
Spike project harvest
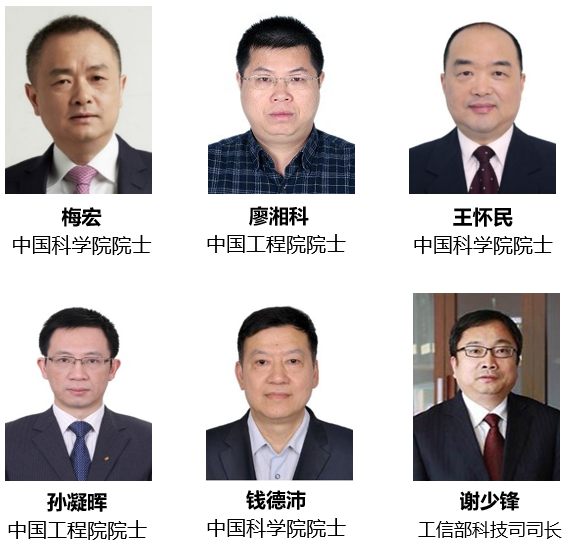
2022 CCF China Open Source Conference Notice (Fourth Round)
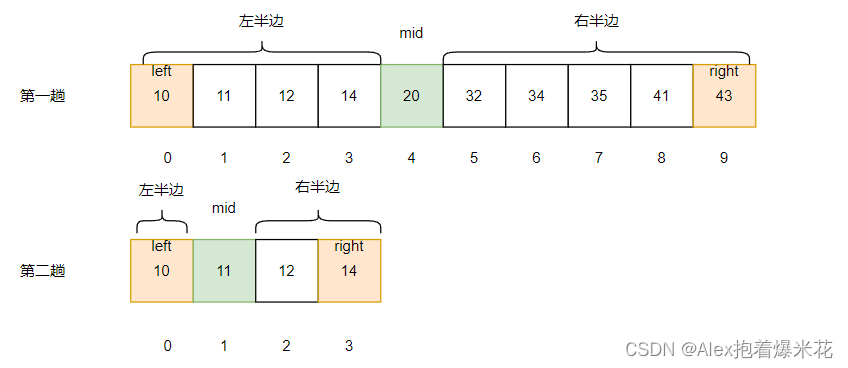
【21天学习挑战赛】折半查找
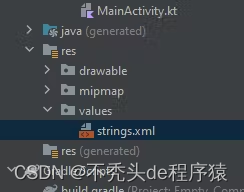
清理空的 Jetpack Compose 应用程序模板

开源生态与AI芯片的碰撞&Dragonfly基于P2P的镜像加速系统 | 第 39-40 期
8月Meetup | “数据调度+分析引擎”解锁企业数字化转型之路
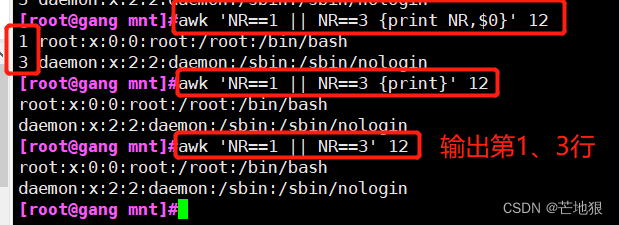
shell之正则表达式及三剑客awk命令
随机推荐
怎么学自动化测试
如何使用Swift Package插件生成代码
软件配置 | pip下载第三方库文件及配置pip源的不完全总结
CDF 图的含义
二维费用的背包问题 ← 模板题
LabView---双通道示波器(内含信号发生器)
基础填空以及编程题
清理空的 Jetpack Compose 应用程序模板
cube-studio配置镜像仓库并允许
64位 RT-Thread 移植到 Cortex-A53 系统 bug 修复笔记
v-for指令:根据数据生成列表结构
险资又做LP,一出手40亿
不同主机收不到组播消息原因分析
8月Meetup | “数据调度+分析引擎”解锁企业数字化转型之路
Redis存储验证码
PNG如何变gif?教你一招png秒变gif动图的方法
让页面滚动到指定位置
解决mpi4py导入报错ImportError: libmpi.so.40: cannot open shared object file: No such file or directory
生成树协议(STP---Spanning Tree Protocol)
LeetCode-337. House Robber III