当前位置:网站首页>Openlayers 5.0 thermal diagram
Openlayers 5.0 thermal diagram
2022-04-23 19:09:00 【GIS roast lamb leg is delicious】
import Vector from 'ol/source/Vector.js'
import { Heatmap as HeatmapLayer } from 'ol/layer.js'
import Feature from 'ol/Feature.js'
import Point from 'ol/geom/Point.js'
var webgissource={};
webgissource.heatmapsource=new Vector()
webgissource.heatmapvector = new HeatmapLayer({
    //  Vector data source
   source: webgissource.heatmapsource,
    blur:  parseInt(50, 10), //  Fuzzy size
    opacity: 1,
    radius: parseInt(30, 10) //  Hot spot radius
   })
map.addLayer(webgissource.heatmapvector);

static heatmaplayer(data){
//data data format {x:107.4,y108.5}  for Loop execution heatmaplayer()
   var points=new Point([data.x,data.y]);
   var iconFeature = new Feature({
      geometry:points,
      attributions:{
        feature:data,
        type:'rlt'
      }
    })
    webgissource.heatmapvector.getSource().addFeature(iconFeature)
  }
版权声明
本文为[GIS roast lamb leg is delicious]所创,转载请带上原文链接,感谢
https://yzsam.com/2022/04/202204231908120907.html
边栏推荐
- Esp01s with Arduino development environment
- mysql_linux版本的下載及安裝詳解
- openlayers 5.0 加载arcgis server 切片服务
- openlayers 5.0 当地图容器大小改变时,重新加载地图
- 12 examples to consolidate promise Foundation
- Click the input box to pop up the keyboard layout and move up
- mysql通过binlog恢复或回滚数据
- Codeforces Round #784 (Div. 4)
- openlayers 5.0 两种居中方式
- Oracle配置st_geometry
猜你喜欢
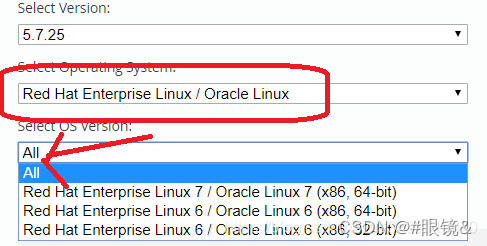
mysql_ Download and installation of Linux version

ArcMap连接 arcgis server
【C语言进阶11——字符和字符串函数及其模拟实现(2))】
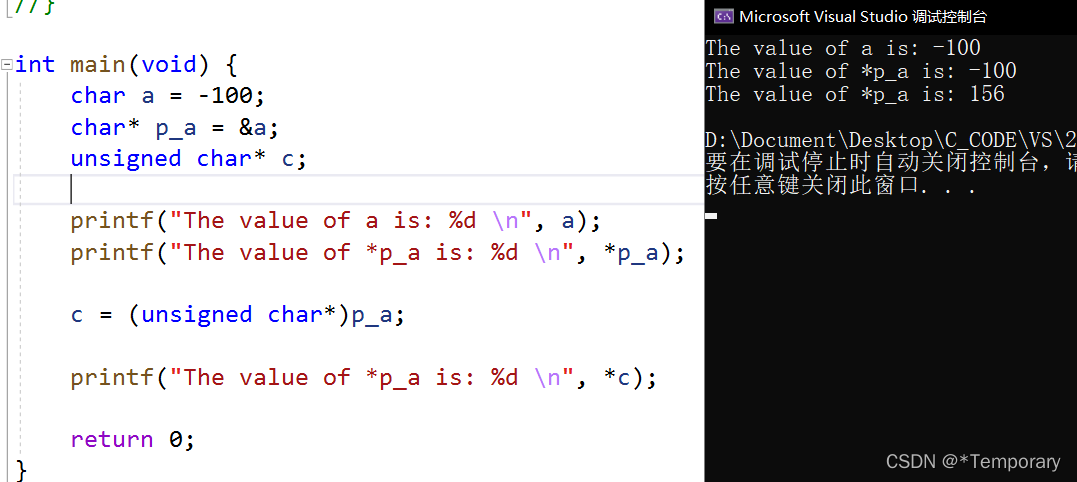
On the forced conversion of C language pointer
![[报告] Microsoft :Application of deep learning methods in speech enhancement](/img/29/2d2addd826359fdb0920e06ebedd29.png)
[报告] Microsoft :Application of deep learning methods in speech enhancement
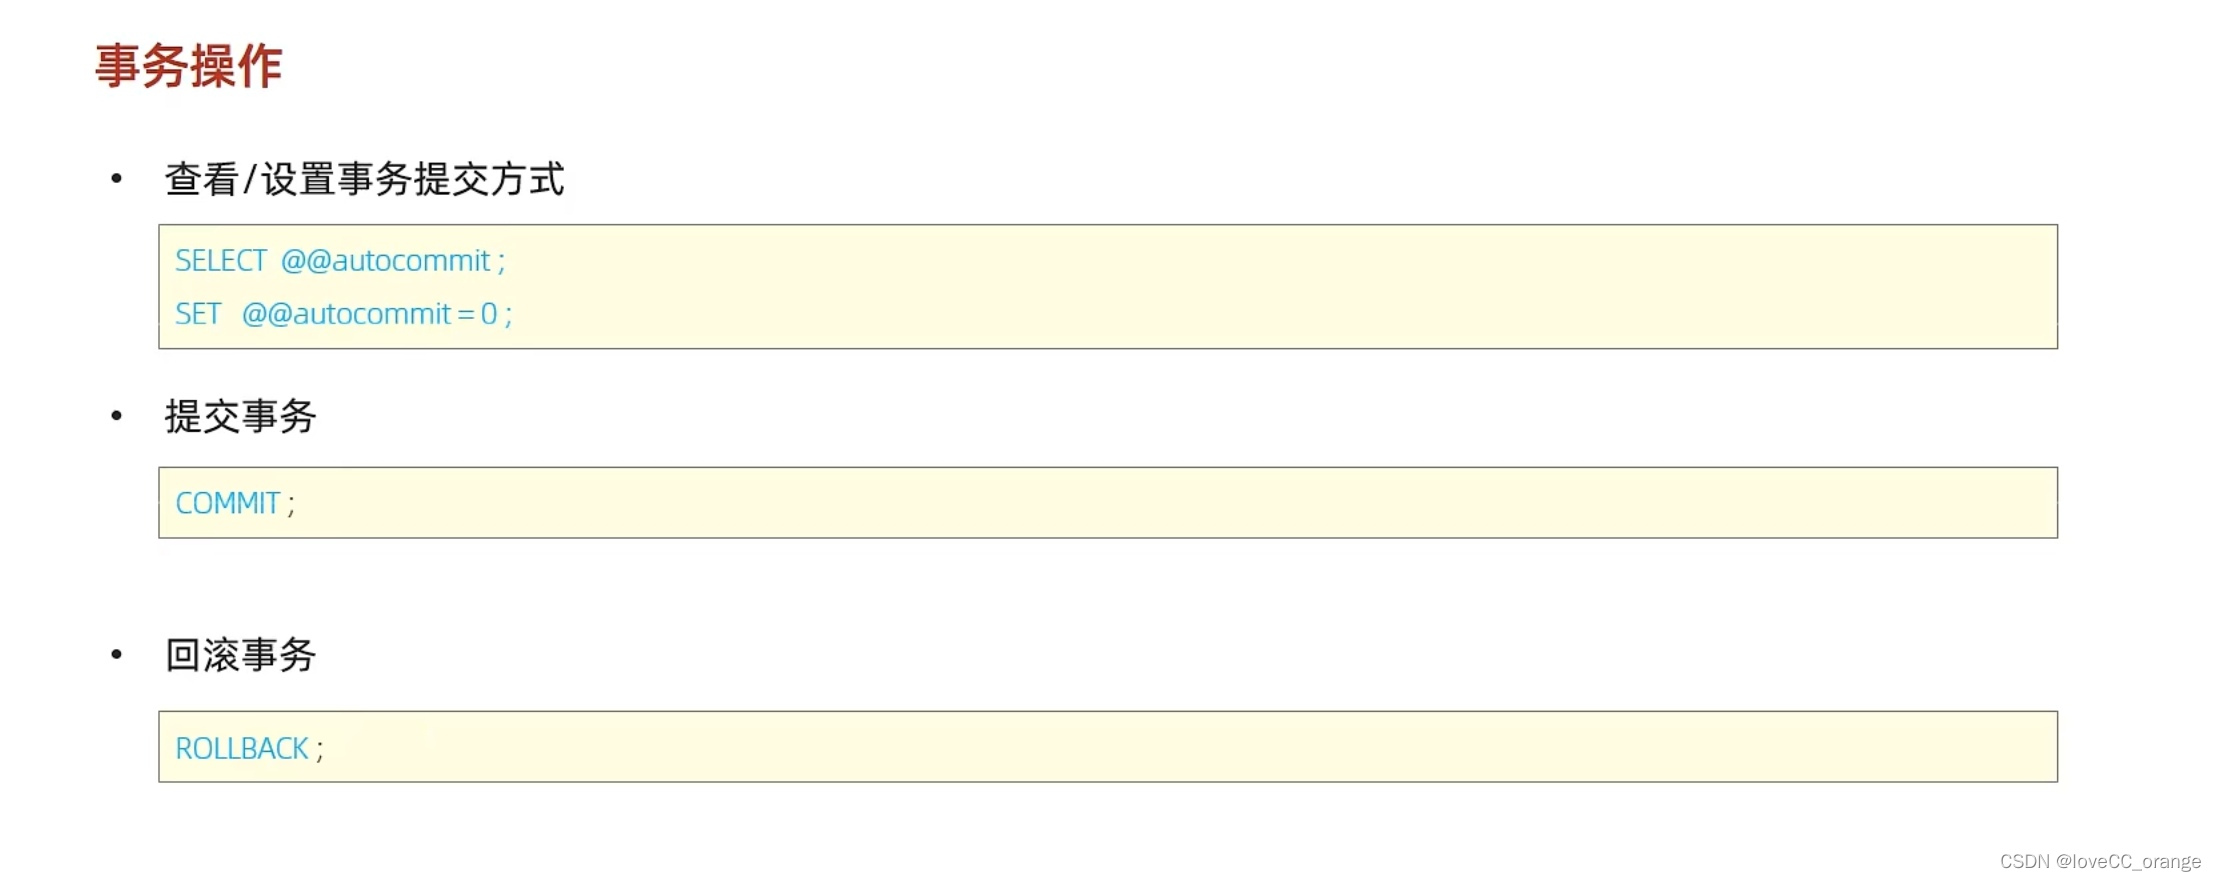
MySQL学习第五弹——事务及其操作特性详解

网络协议之:sctp流控制传输协议
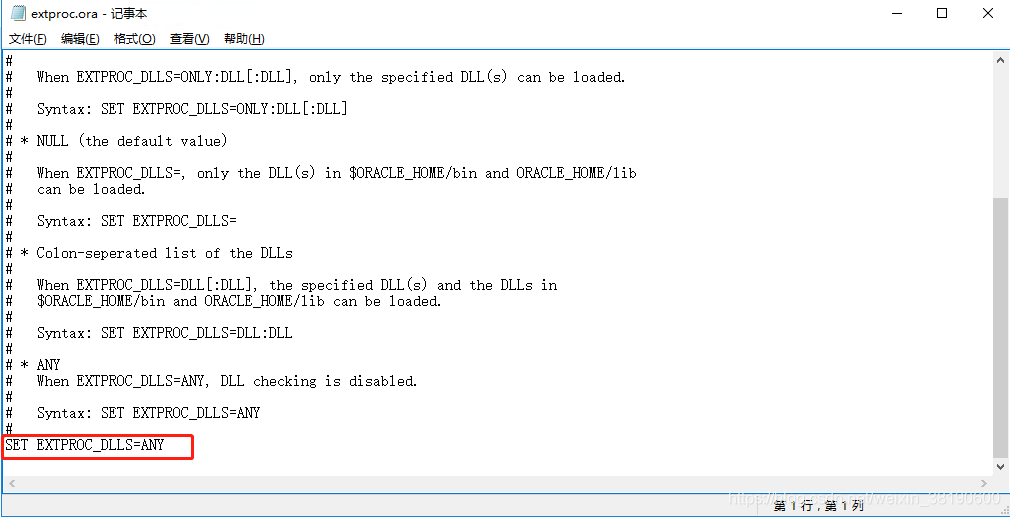
Oracle配置st_geometry

Client interns of a large factory share their experience face to face

2022.04.23(LC_714_买卖股票的最佳时机含手续费)
随机推荐
Some records used by VS2010
openlayers 5.0 热力图
Actual combat of Nacos as service configuration center
c#:泛型反射
Tencent map and high logo removal method
MVVM model
坐标转换WGS-84 转 GCJ-02 和 GCJ-02转WGS-84
高层次人才一站式服务平台开发 人才综合服务平台系统
Practice of Druid SQL and security in meituan review
: app: transformclasseswithrobustfordevrease meituan hot repair compilation error record
Click the input box to pop up the keyboard layout and move up
Go language GUI framework Fyne Chinese garbled or not displayed
Seata handles distributed transactions
Oracle配置st_geometry
[today in history] April 23: the first video uploaded on YouTube; Netease cloud music officially launched; The inventor of digital audio player was born
Get a list of recent apps
The type initializer for ‘Gdip‘ threw an exception
SSDB基础
Using bafayun to control the computer
7、 DOM (Part 2) - chapter after class exercises and answers