International Space Station data with Python research 🌎

Related tags

Data AnalysisISS_data
Overview

espaciador

International Space Station data with Python research 🌎

Plotting ISS trajectory, calculating the velocity over the earth and more.


Plotting trajectory:

We are going to make a graph of the trajectory of the ISS that is N minutes long. The N will be chosen by the user according to their preferences. This means that the program will run and keep points in a list for N minutes.
We will use an API to retrieve ISS current position in latitude and longitude:

http://open-notify.org/Open-Notify-API/ISS-Location-Now/

First we need to import the following python modules:

Pandas to read json data from ISS API, plotly to make the plot of the trajectory and time to time.sleep function
import pandas as pd
import plotly.express as px
import time

Second we must initialize the list that will preserve the latitude and longitude points (every sixty seconds). You also have to initialize the N variable with time in minutes

latitudes = []
longitudes = []
N = 60 # Sixty for one hour trajectory

Then we will create the following for loop to keep recording latitude-longitude points separated by one minute

We use for i in range(N), which is the time that the script will keep running (in hours) because we have a time.sleep(60) at the end
for i in range(N):  
    url = "http://api.open-notify.org/iss-now.json" # API URL

    df = pd.read_json(url) # Pandas read JSON data from API
    
    latitudes.append(df["iss_position"]["latitude"])  # We append latitude ISS position to latitudes list
    longitudes.append(df["iss_position"]["longitude"]) # We append longitude ISS position to longitudes list
    
    time.sleep(60) # This is used to separate de point records with one minute

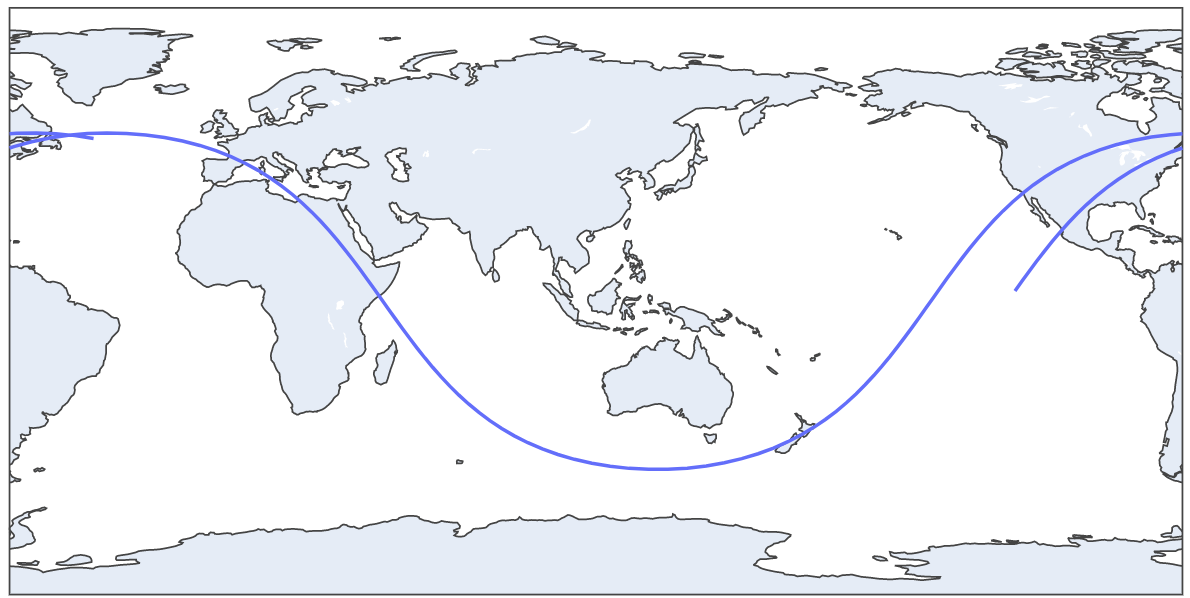
When the for loop finish the iterating we will have a record of N minutes ISS trajectory. Now we can plot this with Plotly (px.line_geo):

px.line_geo will create a plot with earth map
fig = px.line_geo(lat=latitudes, lon=longitudes) # Passing our latitudes and longitudes list as parameter
fig.show()  

image

This is a two hours trajectory plot

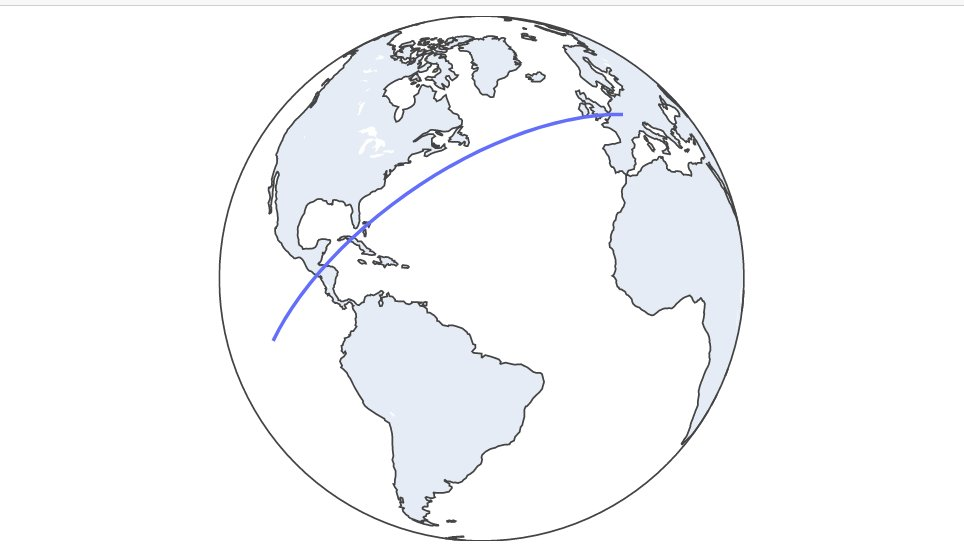
We can update our plot to orthographic projection with this code:

fig.update_geos(projection_type="orthographic")
fig.update_layout(height=300, margin={"r":0,"t":0,"l":0,"b":0})
fig.show()  

image

30 minutes trajectory plot

image

2 Hours trajectory plot GIF

Estimating ISS velocity:

We will estimate the ISS velocity using two diferent latitude-longitude points separated by one minute (sixty seconds). We can get the distance between that two points and then use phisics formula velocity(m/s) = distance(in meters)/time(in seconds)

First import the following python modules

import pandas as pd # Pandas to read API data
import time # Time for time.sleep
import geopy.distance # Geopy to get distance between two lat-lon points
import requests # Get another API data
import json # Read that data
We need to initialize two empty list to save latitudes and longitudes
lat = []
long = []
Next we will use a for loop to get the two latitude-longitude points separated by 60 seconds (time.sleep(60))
for i in range(2):  # for in range(2) because we want two lat-lon points

    url = "http://api.open-notify.org/iss-now.json" # API url

    df = pd.read_json(url) # Read API Json data with Pandas

    lat.append(df["iss_position"]["latitude"]) # Append latitude to lat list
    long.append(df["iss_position"]["longitude"]) # Append longitude to long list

    time.sleep(60) # Wait 60 seconds to record the second lat-lon point
When this for loop finish we will have a lat list with two latitude positions and one long list with two longitude positions. In conjuntion of this 4 numbers we have two lat-lon points in different time moments (separated by one minute)

Then we must get the distance between this points:

We create the two different points. The first one with lat[0] index and long[0]. The second one with lat[1] and long[0]
coords_1 = (lat[0], long[0]) 
coords_2 = (lat[1], long[1])
Then calculate distance with geopy library:
distance = (
geopy.distance.distance(coords_1, coords_2).m
) # Distance between the points in meters
But we must make a litle correction. Because ISS isn't moving in earth surface. It's orbiting aproximately 400Km above earth surface. So the radius is greater. The distance traveled is a litle bit more. To do this, we need to get ISS current altitud. Use the following code:

image

iss_alt_url = "https://api.wheretheiss.at/v1/satellites/25544"
r = requests.get(iss_alt_url)
r = r.text
r = json.loads(r)

iss_alt = int(r["altitude"]) # IN KM
Now apply phisics formula to make the correction
earth_radius = 6371 # in KM
distance_corrected = (distance * (earth_radius+iss_alt)/earth_radius)
Now finish the calculation with speed formula already explained:
speed = distancia_corrected/60 


print(round(speed*3.6, 3), "KM/H") # Multiplied by 3.6 to convert from m/s to km/h. Rounded by 3.

Output:

26367.118 KM/h
Owner
Facundo Pedaccio
Studying computer engineering and economics. I like computer science, physics, astrophysics, rocket science. Or rather the perfect combination of them.
Facundo Pedaccio
Get mutations in cluster by querying from LAPIS API

Cluster Mutation Script Get mutations appearing within user-defined clusters. Usage Clusters are defined in the clusters dict in main.py: clusters = {

neherlab 1 Oct 22, 2021
Describing statistical models in Python using symbolic formulas

Patsy is a Python library for describing statistical models (especially linear models, or models that have a linear component) and building design mat

Python for Data 866 Dec 16, 2022
PCAfold is an open-source Python library for generating, analyzing and improving low-dimensional manifolds obtained via Principal Component Analysis (PCA).

PCAfold is an open-source Python library for generating, analyzing and improving low-dimensional manifolds obtained via Principal Component Analysis (PCA).

Burn Research 4 Oct 13, 2022
This creates a ohlc timeseries from downloaded CSV files from NSE India website and makes a SQLite database for your research.

NSE-timeseries-form-CSV-file-creator-and-SQL-appender- This creates a ohlc timeseries from downloaded CSV files from National Stock Exchange India (NS

PILLAI, Amal 1 Oct 02, 2022
Hg002-qc-snakemake - HG002 QC Snakemake

HG002 QC Snakemake To Run Resources and data specified within snakefile (hg002QC

Juniper A. Lake 2 Feb 16, 2022
Using Data Science with Machine Learning techniques (ETL pipeline and ML pipeline) to classify received messages after disasters.

Using Data Science with Machine Learning techniques (ETL pipeline and ML pipeline) to classify received messages after disasters.

1 Feb 11, 2022
Flood modeling by 2D shallow water equation

hydraulicmodel Flood modeling by 2D shallow water equation. Refer to Hunter et al (2005), Bates et al. (2010). Diffusive wave approximation Local iner

6 Nov 30, 2022
PandaPy has the speed of NumPy and the usability of Pandas 10x to 50x faster (by @firmai)

PandaPy "I came across PandaPy last week and have already used it in my current project. It is a fascinating Python library with a lot of potential to

Derek Snow 527 Jan 02, 2023
A data structure that extends pyspark.sql.DataFrame with metadata information.

MetaFrame A data structure that extends pyspark.sql.DataFrame with metadata info

Invent Analytics 8 Feb 15, 2022
Generates a simple report about the current Covid-19 cases and deaths in Malaysia

Generates a simple report about the current Covid-19 cases and deaths in Malaysia. Results are delay one day, data provided by the Ministry of Health Malaysia Covid-19 public data.

Yap Khai Chuen 7 Dec 15, 2022
MotorcycleParts DataAnalysis python

We work with the accounting department of a company that sells motorcycle parts. The company operates three warehouses in a large metropolitan area.

NASEEM A P 1 Jan 12, 2022
Randomisation-based inference in Python based on data resampling and permutation.

Randomisation-based inference in Python based on data resampling and permutation.

67 Dec 27, 2022
A Python 3 library making time series data mining tasks, utilizing matrix profile algorithms

MatrixProfile MatrixProfile is a Python 3 library, brought to you by the Matrix Profile Foundation, for mining time series data. The Matrix Profile is

Matrix Profile Foundation 302 Dec 29, 2022
A CLI tool to reduce the friction between data scientists by reducing git conflicts removing notebook metadata and gracefully resolving git conflicts.

databooks is a package for reducing the friction data scientists while using Jupyter notebooks, by reducing the number of git conflicts between different notebooks and assisting in the resolution of

dataroots 86 Dec 25, 2022
Option Pricing Calculator using the Binomial Pricing Method (No Libraries Required)

Binomial Option Pricing Calculator Option Pricing Calculator using the Binomial Pricing Method (No Libraries Required) Background A derivative is a fi

sammuhrai 1 Nov 29, 2021
A program that uses an API and a AI model to get info of sotcks

Stock-Market-AI-Analysis I dont mind anyone using this code but please give me credit A program that uses an API and a AI model to get info of stocks

1 Dec 17, 2021
Methylation/modified base calling separated from basecalling.

Remora Methylation/modified base calling separated from basecalling. Remora primarily provides an API to call modified bases for basecaller programs s

Oxford Nanopore Technologies 72 Jan 05, 2023
PLStream: A Framework for Fast Polarity Labelling of Massive Data Streams

PLStream: A Framework for Fast Polarity Labelling of Massive Data Streams Motivation When dataset freshness is critical, the annotating of high speed

4 Aug 02, 2022
Driver Analysis with Factors and Forests: An Automated Data Science Tool using Python

Driver Analysis with Factors and Forests: An Automated Data Science Tool using Python 📊

Thomas 2 May 26, 2022