当前位置:网站首页>AT89C52 MCU frequency meter (1Hz ~ 20MHz) design, LCD1602 display, including simulation, schematic diagram, PCB and code, etc
AT89C52 MCU frequency meter (1Hz ~ 20MHz) design, LCD1602 display, including simulation, schematic diagram, PCB and code, etc
2022-04-23 14:25:00 【Jiang Yuzhi】
The design requirements
1. With MCS-51 Series single chip microcomputer is the control device , use C Language for program development , Combined with peripheral electronic circuits , Design a digital frequency meter ;
2. Can be right 1HZ~20MHZ Sine wave 、 Triangle wave 、 The frequency of periodic signals such as square wave signal is measured ;
3. Measurement error : lower than 0.1%;
4. The frequency measurement results are LCD1602 Liquid crystal display (LCD) ;
System Overview
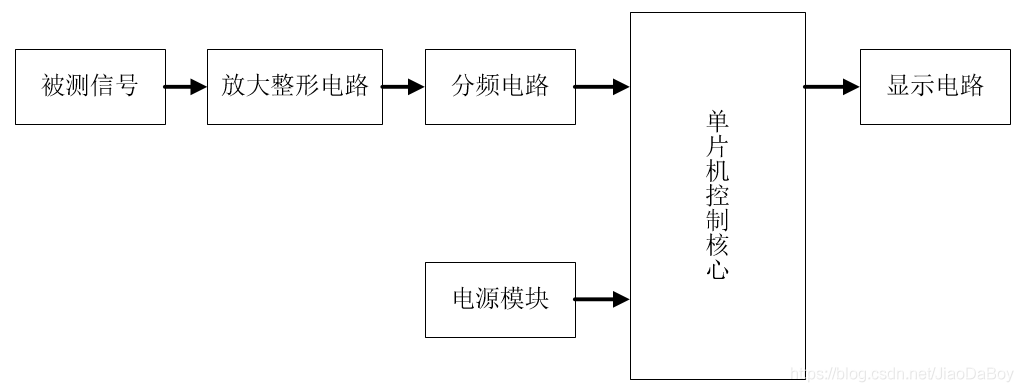
This design gives a method to AT89C52 The design scheme of digital frequency meter with single chip microcomputer as the control core . The plan is made up of 6 Component composition , They are power modules 、 Minimum system of single chip microcomputer 、 Signal amplification module 、 Shaping module 、 Frequency division module and display module .
Working principle is : The power module provides stable power supply for the whole system 5V Working voltage , The user inputs a periodic signal through the signal source , The input signal is amplified by triode circuit and shaped by Schmidt trigger , Become a square wave that can be recognized by single chip microcomputer , Complete the square wave division circuit 100 Double the frequency .
When the frequency of the input signal is lower than 200KHZ when , The single chip microcomputer directly reads and calculates the unit time before frequency division (1S) Number of signal pulses collected in , Is the signal frequency ;
When the frequency of the input signal exceeds 200KHZ when , The single chip microcomputer reads and calculates the number of signal pulses after frequency division , Then it is converted into the actual frequency through data processing .
Last , The single chip microcomputer outputs the frequency measurement value to LCD1602 Real time display on the display .
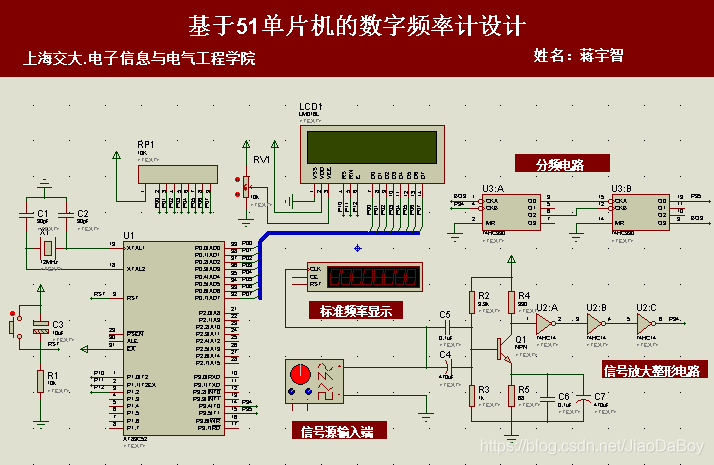
Simulation circuit diagram
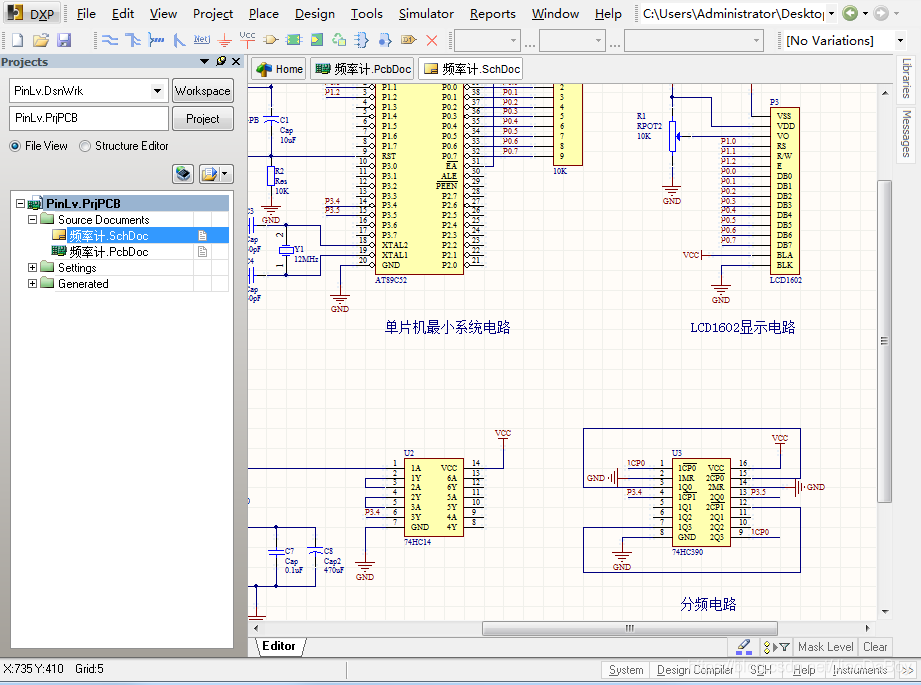
Schematic diagram
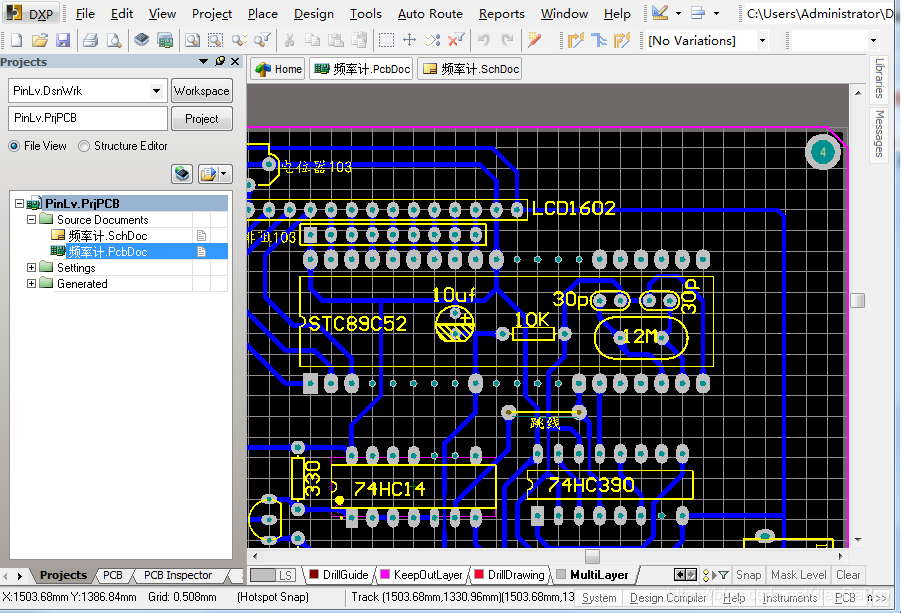
PCB chart
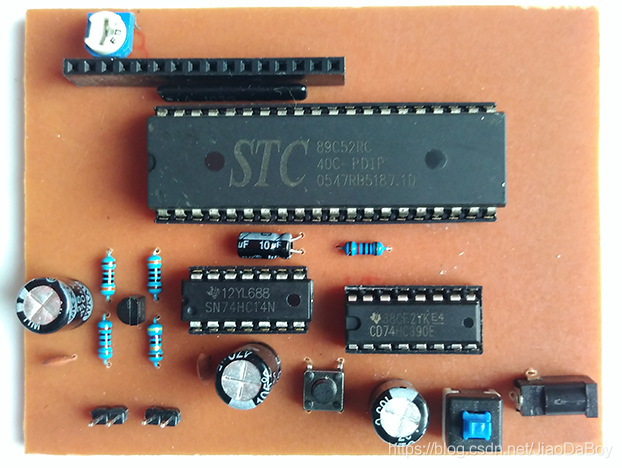
Physical drawing of frequency meter
Analysis of simulation results
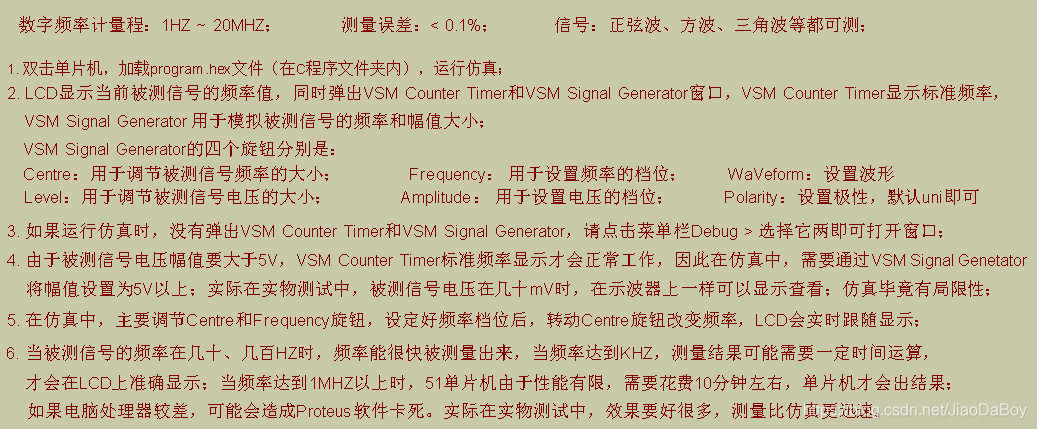
open Proteus Simulation file , File suffix DSN. Double click the MCU , load Program.hex file ( be located C In the program folder ), Run the simulation , The results are shown below , The frequency of the measured signal is 13HZ.
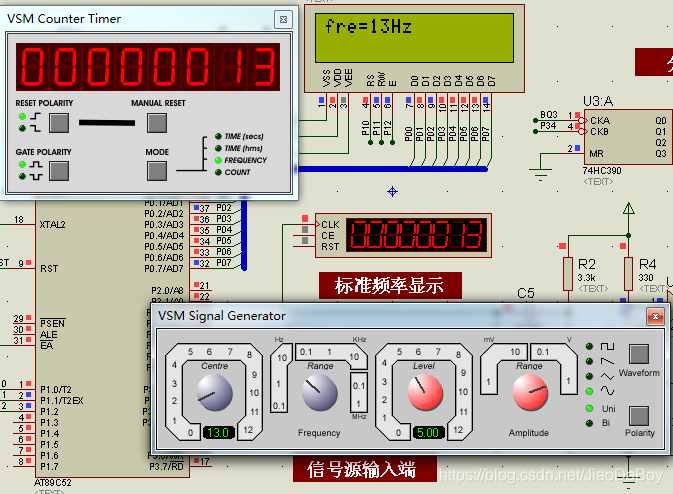
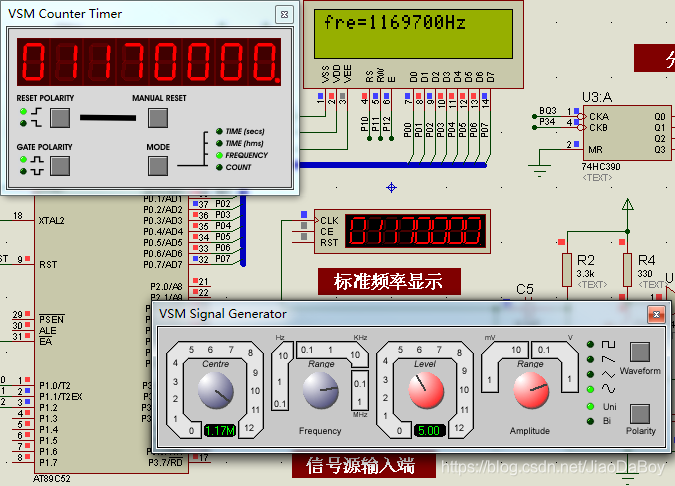
Simulation runtime , Will pop up VSMCounter Timer and VSM Signal Generator Two windows ,VSM Counter Timer Used to display the standard frequency .
In the simulation , When the measured signal voltage is greater than 5V when ,VSM Counter Timer To work properly . It doesn't mean that , In the physical test of the actual frequency meter , The measured signal source voltage shall be greater than 5V Talent .
actually , The measured signal voltage is in tens of mV, You can also check the display on the oscilloscope , It does not affect the measurement of frequency , This is just the limitation of simulation .
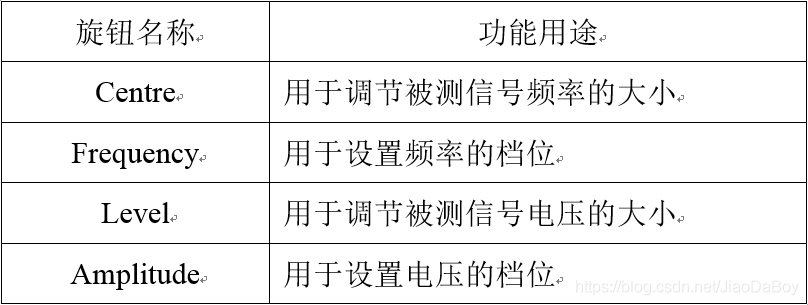
VSM Signal Generator Used to adjust the frequency of the measured signal , It has four knobs , Their functions and uses are shown in the table below .
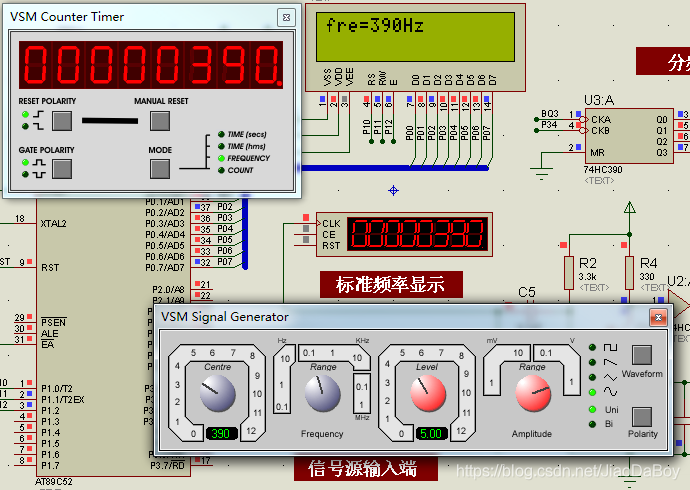
In the simulation , Mainly regulate Centre and Frequency knob , After setting the frequency gear , turn Centre The knob changes the frequency ,LCD1602 The display will follow the display .
When the measured signal frequency is 390HZ、5.6KHZ and 19063HZ when , The simulation results are as follows .

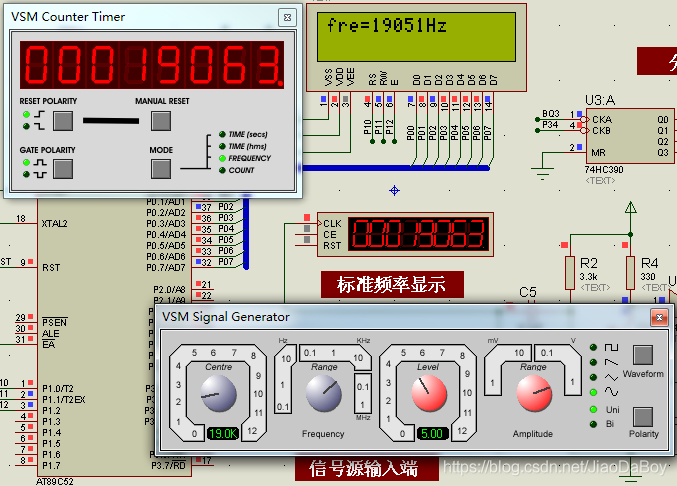
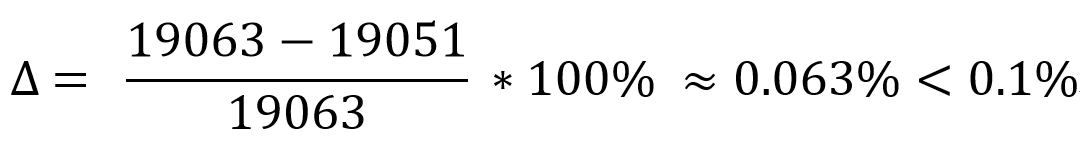
When the measured signal frequency is 19063HZ, The measurement result is 19051HZ, The frequency measurement error is calculated as :
The frequency of the measured signal is tens of 、 A few hundred HZ when , The frequency can be measured quickly ; When the frequency reaches KHZ when , Due to the limited computing performance of single chip microcomputer , It may take a few minutes to get the simulation results .
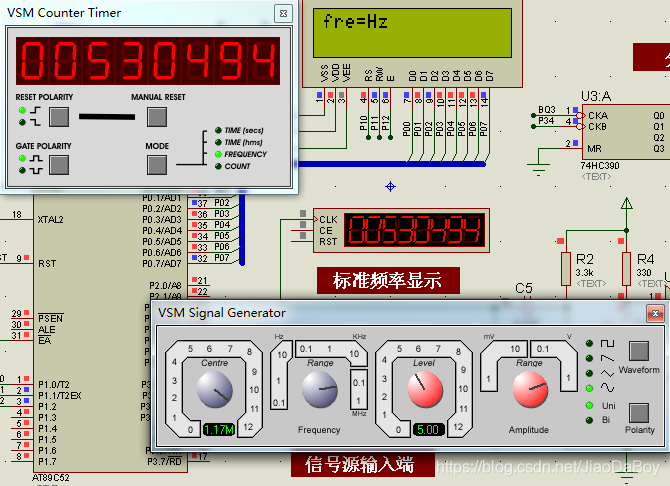
When the frequency reaches MHZ When above , For example, the frequency of the measured signal is set to 1.17MHZ when , Single chip microcomputer operation cost 12 About minutes , To calculate the frequency value . The operation process is as follows , The figure below 1 Because the single chip microcomputer is in the process of operation , The measurement results have not been obtained ; chart 2 by 1.17MHZ Set frequency of , The result measured by single chip microcomputer is 1169700HZ.
The frequency measurement error is calculated as :
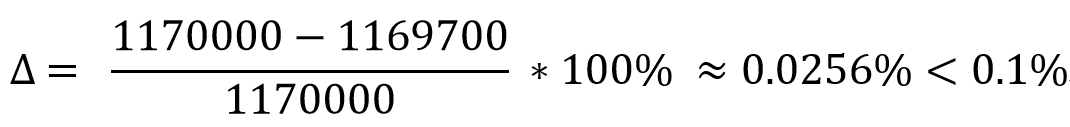
in summary , The frequency meter simulation design meets the range requirements 、 Error and other requirements .
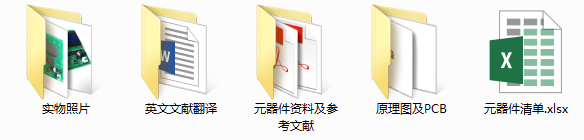
Resource content
(1) be based on 51 MCU digital frequency meter design paper complete version ;
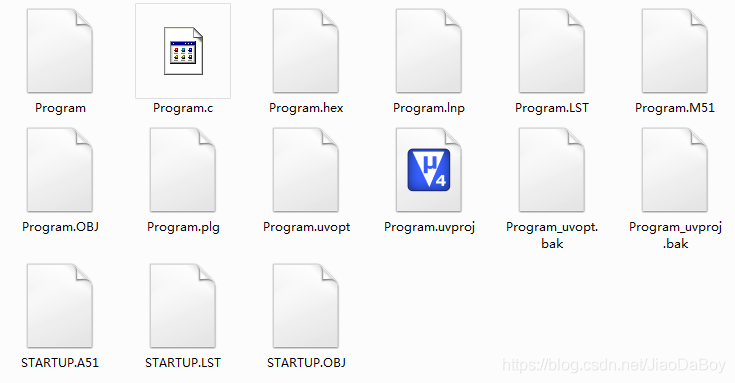
(2)C Program ;
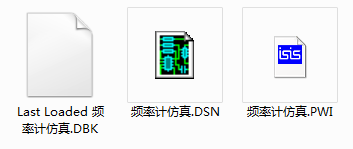
(3)Proteus Simulation ;
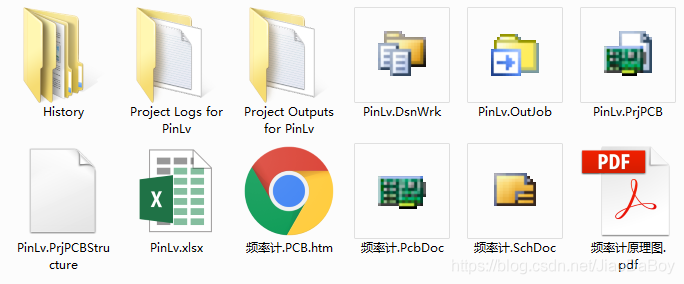
(4) Schematic diagram and PCB file ;
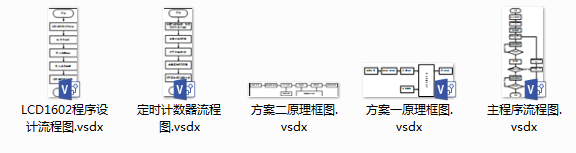
(5)Visio Flow chart file ;
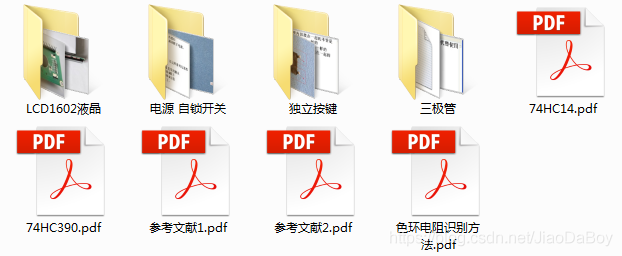
(6) List of components ;
(7) Translation of English documents ;
(8) References and Literature ;
Resource screenshot

Say the important thing again !!!
Because the frequency meter design is my original design , Get a full set of information ,
WeChat search for my official account : Jiaoyuan Xiaozhi
版权声明
本文为[Jiang Yuzhi]所创,转载请带上原文链接,感谢
https://yzsam.com/2022/04/202204231412471864.html
边栏推荐
猜你喜欢
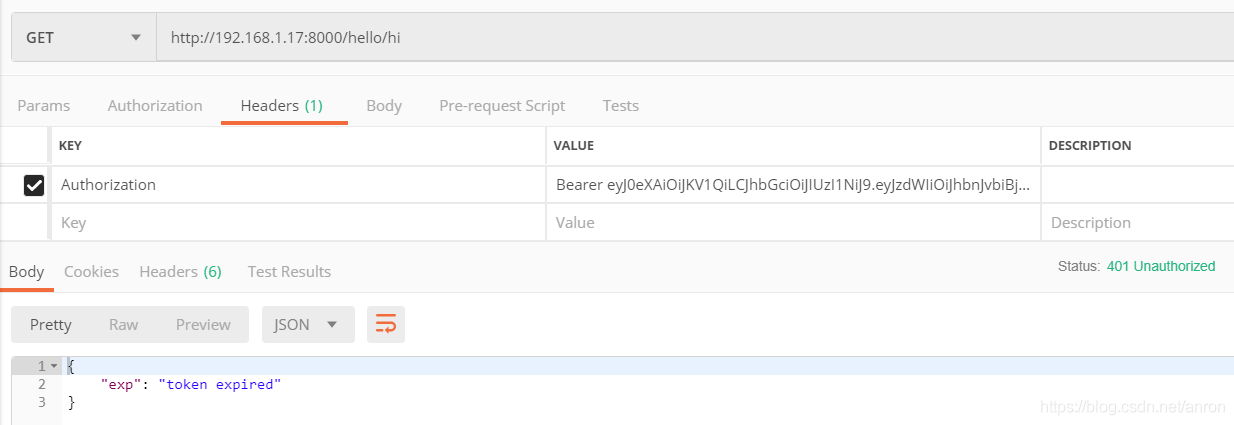
API gateway / API gateway (IV) - use of Kong - Integrated JWT and fuse plug-in
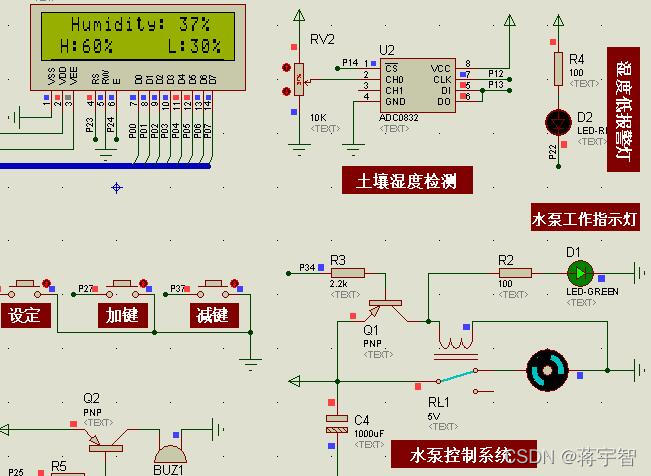
51单片机的花卉、农田自动浇水灌溉系统开发,Proteus仿真,原理图和C代码
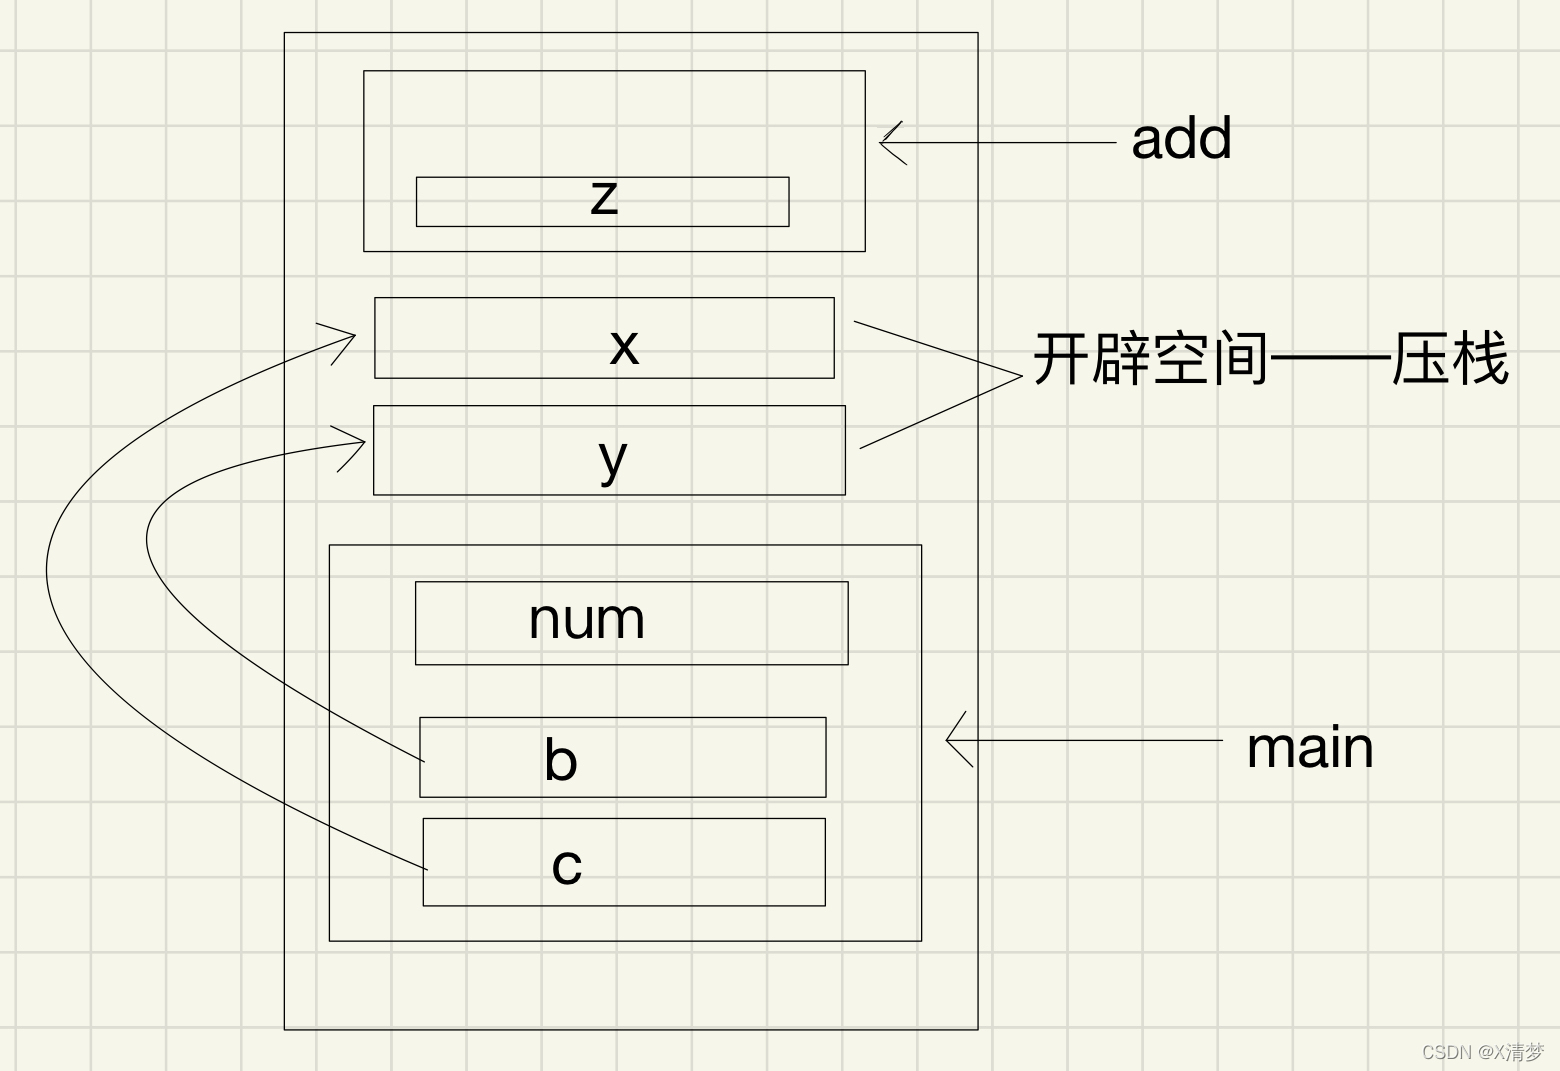
c语言在结构体传参时参数压栈问题

51单片机+LCD12864液晶显示的俄罗斯方块游戏,Proteus仿真、AD原理图、代码、论文等
进入新公司,运维工程师从下面这几项了解系统的部署
redis的五种数据类型
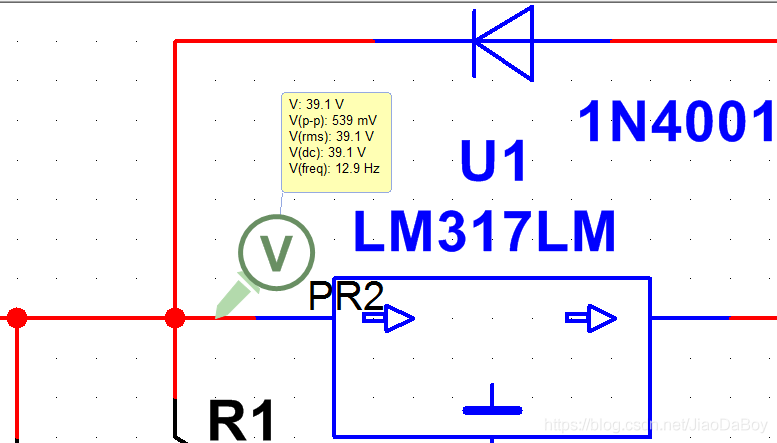
LM317的直流可调稳压电源Multisim仿真设计(附仿真+论文+参考资料)
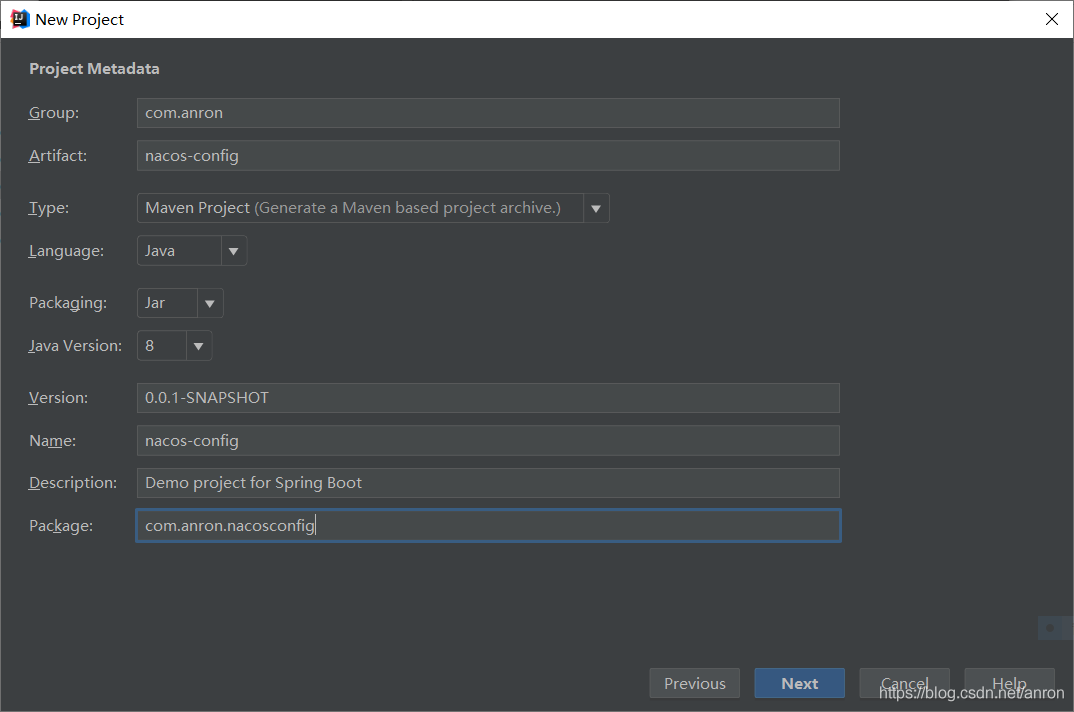
Nacos uses demo as configuration center (IV)
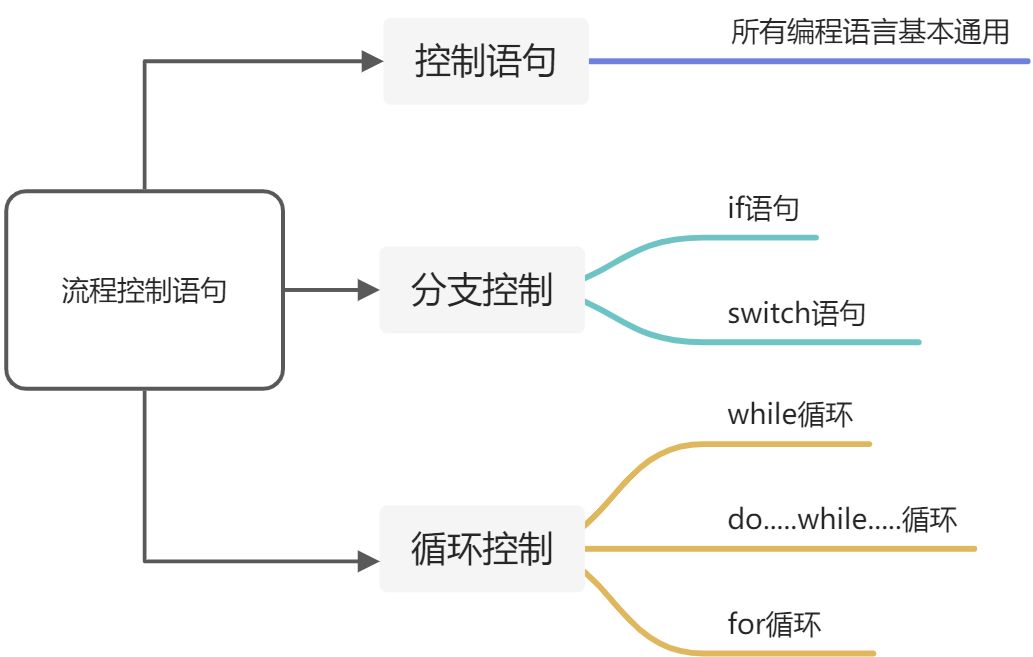
流程控制之分支语句
xx项目架构随记
随机推荐
Introduction to loan market quotation interest rate (LPR) and loan benchmark interest rate
循环队列的基本操作,你学会了吗?
Qt界面优化:Qt去边框与窗体圆角化
基于单片机的DS18B20的数字温度监控报警系统设计【LCD1602显示+Proteus仿真+C程序+论文+按键设置等】
浅谈skiplist在LevelDB的应用
Flop effect
man man随记和crontab的@reboot用法
KVM学习资源
SED 学以致用
一些小小小小记录~
百度笔试2022.4.12+编程题目:简单整数问题
Usage of BC
编译Openssl
MySQL基础知识
bc的用法
逻辑卷创建与扩容
微信小程序将原生请求通过es6的promise来进行优化
差分隐私(背景介绍)
Detailed explanation of SAR command
Redis源码分析之PSYNC同步