当前位置:网站首页>Waymo数据集使用介绍(waymo-open-dataset)
Waymo数据集使用介绍(waymo-open-dataset)
2022-08-11 05:23:00 【zhSunw】
关于waymo数据集的介绍很多博客都有详细说明了,但是具体有哪些数据?waymo可视化工具如何使用?这些信息又如何读取?浏览了一圈发现寥寥无几,这里简单做个整理,方便读者理解也方便自己以后所需。
1. Waymo数据集下载
2. Waymo Open Dataset Tutorial
去waymo可视化官网进行相关工具的安装与环境配置,这个不多赘述:
https://github.com/waymo-research/waymo-open-dataset.git
3. 数据信息的加载与获取
3.1 数据集加载
将FILENAME换成自己tfrecord的地址即可:
import os
import math
import numpy as np
import itertools
import tensorflow as tf
from waymo_open_dataset.utils import range_image_utils
from waymo_open_dataset.utils import transform_utils
from waymo_open_dataset.utils import  frame_utils
from waymo_open_dataset import dataset_pb2 as open_dataset
import matplotlib.pyplot as plt
import matplotlib.patches as patches

FILENAME = "your tfrecord file"
dataset = tf.data.TFRecordDataset(FILENAME, compression_type='')
dataset中是一个tfrecord中所有的帧数据,一般包含199帧,采样频率是10Hz,所以近似为20秒数据
3.2 信息读取
迭代采用遍历dataset,可以获取到每帧的信息,具体信息可以参考注释进行修改
for data in dataset:
	frame = open_dataset.Frame()
	frame.ParseFromString(bytearray(data.numpy()))
	#print(frame.laser_labels)
''' camera_labels: 5台摄像机检测到的对象的图像坐标,大小,类型等,从每帧0到4 context: 相机和激光雷达的内部和外部参数,光束倾斜度值 images: 图片 laser_labels: 激光雷达坐标系上物体的XYZ坐标,大小,行进方向,对象类型等等 lasers: 激光点 no_label_zones:非标记区域的设置(有关详细信息,请参阅文档) pose: 车辆姿势和位置 projected_lidar_labels: 投影由LIDAR检测到的对象时的图像坐标 timestamp_micros: 时间戳 '''
3.3 解析数据获得点云信息
(range_images, camera_projections, range_image_top_pose) = parse_range_image_and_camera_projection(frame)#解析数据帧
(point,cp_point) = convert_range_image_to_point_cloud(frame,range_images,camera_projections,range_image_top_pose)#获取激光点云
3.4 输出label的信息
!不要用testing的tfrecord文件(虽然是弱智行为,但是我就忘了),原因显而易见:testing的数据没有label
for data in dataset:
    frame = open_dataset.Frame()
    frame.ParseFromString(bytearray(data.numpy()))
    """ (range_images, camera_projections, range_image_top_pose) = frame_utils.parse_range_image_and_camera_projection(frame) points, cp_points = frame_utils.convert_range_image_to_point_cloud(frame, range_images, camera_projections, range_image_top_pose) """
    for label in frame.laser_labels:  # 获取当前帧所有obj标签
        obj_type = obj_types[label.type]
        x = label.box.center_x
        y = label.box.center_y
        z = label.box.center_z
        l = label.box.width
        w = label.box.length
        h = label.box.height
        r = label.box.heading
        v_x = label.metadata.speed_x
        v_y = label.metadata.speed_y
        # information of bounding box
        one_obj = obj_type + str(':'+'\n'
        + 'shape : {' + str(l) + ',' + str(w) + ',' + str(h) + '}\n'
        + 'position : {'+str(x)+',' + str(y) + ','+str(z) + '}\n'
        + 'angle : {' + str(r) + '}\n'
        + 'speed : {' + str(v_x) + ',' + str(v_y) + '}\n')
        print(one_obj+"\n")
顺便附上label的数据信息,需要什么数据在里面找并输出就可以了:
/* Copyright 2019 The Waymo Open Dataset Authors. All Rights Reserved.

Licensed under the Apache License, Version 2.0 (the "License");
you may not use this file except in compliance with the License.
You may obtain a copy of the License at

    http://www.apache.org/licenses/LICENSE-2.0

Unless required by applicable law or agreed to in writing, software
distributed under the License is distributed on an "AS IS" BASIS,
WITHOUT WARRANTIES OR CONDITIONS OF ANY KIND, either express or implied.
See the License for the specific language governing permissions and
limitations under the License.
==============================================================================*/

syntax = "proto2";

package waymo.open_dataset;

message Label {

  // Upright box, zero pitch and roll.
  message Box {

    // Box coordinates in vehicle frame.
    optional double center_x = 1;
    optional double center_y = 2;
    optional double center_z = 3;

    // Dimensions of the box. length: dim x. width: dim y. height: dim z.
    optional double length = 5;
    optional double width = 4;
    optional double height = 6;

    // The heading of the bounding box (in radians).  The heading is the angle
    // required to rotate +x to the surface normal of the box front face. It is
    // normalized to [-pi, pi).
    optional double heading = 7;

    enum Type {

      TYPE_UNKNOWN = 0;
      // 7-DOF 3D (a.k.a upright 3D box).
      TYPE_3D = 1;
      // 5-DOF 2D. Mostly used for laser top down representation.
      TYPE_2D = 2;
      // Axis aligned 2D. Mostly used for image.
      TYPE_AA_2D = 3;
    }
  }

  optional Box box = 1;

  message Metadata {

    optional double speed_x = 1;
    optional double speed_y = 2;
    optional double accel_x = 3;
    optional double accel_y = 4;
  }
  optional Metadata metadata = 2;

  enum Type {

    TYPE_UNKNOWN = 0;
    TYPE_VEHICLE = 1;
    TYPE_PEDESTRIAN = 2;
    TYPE_SIGN = 3;
    TYPE_CYCLIST = 4;
  }
  optional Type type = 3;
  // Object ID.
  optional string id = 4;

  // The difficulty level of this label. The higher the level, the harder it is.
  enum DifficultyLevel {

    UNKNOWN = 0;
    LEVEL_1 = 1;
    LEVEL_2 = 2;
  }

  // Difficulty level for detection problem.
  optional DifficultyLevel detection_difficulty_level = 5;
  // Difficulty level for tracking problem.
  optional DifficultyLevel tracking_difficulty_level = 6;

  // The total number of lidar points in this box.
  optional int32 num_lidar_points_in_box = 7;

}

// Non-self-intersecting 2d polygons. This polygon is not necessarily convex.
message Polygon2dProto {

  repeated double x = 1;
  repeated double y = 2;

  // A globally unique ID.
  optional string id = 3;
}
3.5 点云可视化
从帧信息中获取点云:
point包含5个方向的点云,将他们组合起来得到总的points_all
(range_images, camera_projections, range_image_top_pose) = frame_utils.parse_range_image_and_camera_projection(frame)
points, cp_points = frame_utils.convert_range_image_to_point_cloud(frame, range_images, camera_projections, range_image_top_pose)
points_all = np.concatenate(points, axis=0)
调用pc_show()进行显示:
def pc_show(points):
  fig = mlab.figure(bgcolor=(0, 0, 0), size=(640, 500))
  x = points[:,0]
  y = points[:,1]
  z = points[:,2]
  col = z
  print(x.shape)
  mlab.points3d(x, y, z,
                      col,  # Values used for Color
                      mode="point",
                      colormap='spectral',  # 'bone', 'copper', 'gnuplot'
                      # color=(0, 1, 0), # Used a fixed (r,g,b) instead
                      figure=fig,
                      )
  mlab.show()
效果: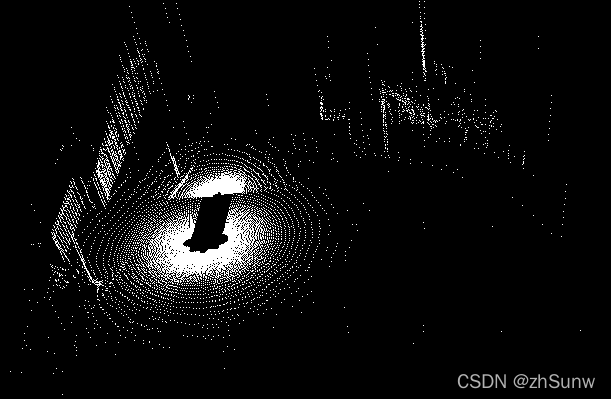
边栏推荐
猜你喜欢

随机推荐
GBase 8s与Oracle存储对比
C语言字节对齐,看这篇就够了
GBase 8s存储结构简介及空间管理
GBase 8s分片技术介绍
LiDAR Snowfall Simulation for Robust 3D Object Detection
国内自媒体宣发.多媒体发稿的优势
常用的转义字符
若依分离版—移动端开发通知公告功能
云计算学习笔记——第四章 存储虚拟化
NAT模式 LVS负载均衡群集部署
写博客周志
DNS外带注入SQLMAP
《现代密码学》学习笔记——第三章 分组密码 [二] AES
GBase 8s集中式企业级安全事务型数据库
sand和mana两大元宇宙游戏,哪个更有潜力?
Fragment 和 CardView
mysql基本概念之事务
正则(三剑客和文本处理工具)
电脑推荐软件
查看电脑配置信息