当前位置:网站首页>Map basemap Library
Map basemap Library
2022-04-23 18:00:00 【Be happy to study today】
Basemap Study
api manual
https://matplotlib.org/basemap/api/basemap_api.html
install basemap library
First installation geos library
pip install geos
Then install basemap library , Install at basemap Of whl file ( Note that version )
https://www.lfd.uci.edu/~gohlke/pythonlibs/#basemap
And then use pip Command after installation , You can use
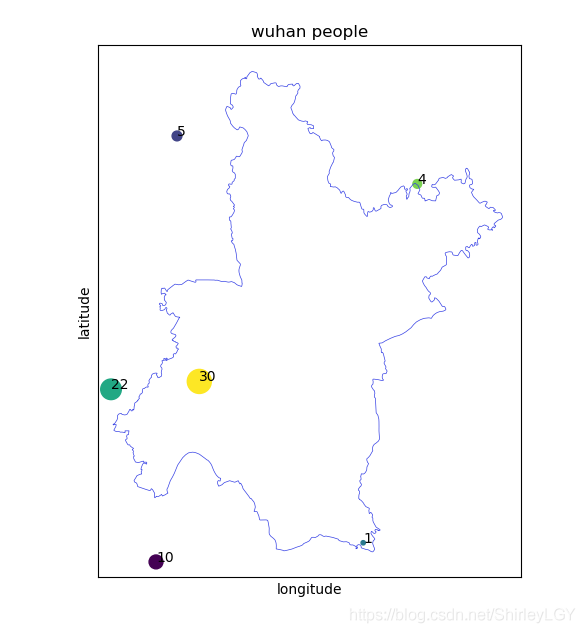
Make a map
import matplotlib.pyplot as plt
from mpl_toolkits.basemap import Basemap
import numpy as np

# To create a geographic point list
long=[113.8,114,114.5,113.7,114.8,114]
lat=[30,31.2,30,30.5,31,30.5]
gridid=[1,2,3,4,5,6]
count=[10,5,1,22,4,30]

# Drawing base map
map = Basemap(llcrnrlon="113.6",llcrnrlat="29.971819",urcrnrlon="115.2",urcrnrlat="31.362913",\
            resolution='h',projection='aea',\
            lat_1=25,lat_2=47,lon_0=105,lat_0=30)

# Load vector basemap
filepath = r"E:\code\test5\wuhan.shp"
file = map.readshapefile(filepath[:-4],"Shp",default_encoding='gbk',color="#3641e5")
# Draw points
x, y = map(long, lat)
pointsize = (count-np.min(count)/(np.max(count)-np.min(count)))*10 #  Calculate the size of each point
map.scatter(x, y, marker='o',c=range(len(gridid)),s=pointsize)
for a,b,c in zip(x,y,count):
  plt.text(a,b,c,ha='left', fontsize=10)
plt.xlabel('longitude')
plt.ylabel('latitude')
plt.title('wuhan people')
plt.show()
#plt.savefig('wuhanpeople.jpg', dpi=120)
Result chart
版权声明
本文为[Be happy to study today]所创,转载请带上原文链接,感谢
https://yzsam.com/2022/04/202204230545528401.html
边栏推荐
- Nat Commun|在生物科学领域应用深度学习的当前进展和开放挑战
- C1小笔记【任务训练篇二】
- 2022制冷与空调设备运行操作判断题及答案
- Go的Gin框架学习
- Summary of floating point double precision, single precision and half precision knowledge
- JS forms the items with the same name in the array object into the same array according to the name
- On the problem of V-IF display and hiding
- C language array processing batch data
- 20222 return to the workplace
- C [file operation] read TXT text by line
猜你喜欢
C language loop structure program

2022江西光伏展,中国分布式光伏展会,南昌太阳能利用展

On the problem of V-IF display and hiding
Scikit learn sklearn 0.18 official document Chinese version
Element calculation distance and event object

云原生虚拟化:基于 Kubevirt 构建边缘计算实例

Examination question bank and online simulation examination of the third batch (main person in charge) of special operation certificate of safety officer a certificate in Guangdong Province in 2022

Halo open source project learning (II): entity classes and data tables
MySQL 中的字符串函数
Flask项目的部署详解

随机推荐
Error in created hook: "referenceerror:" promise "undefined“
MySQL 中的字符串函数
Type judgment in [untitled] JS
Implementation of object detection case based on SSD
C# 网络相关操作
Basic usage of crawler requests
Summary of common server error codes
This point in JS
Yolov4 pruning [with code]
Process management command
.105Location
Go file operation
Halo 开源项目学习(二):实体类与数据表
Go language JSON package usage
Using files to save data (C language)
列表的使用-增删改查
C1小笔记【任务训练篇二】
Go's gin framework learning
Timestamp to formatted date
Transfer learning of five categories of pictures based on VGg