当前位置:网站首页>QT curve / oscilloscope customplot control
QT curve / oscilloscope customplot control
2022-04-23 18:22:00 【Things will turn when they reach the extreme 1024】
1、 Use
Official website :http://www.qcustomplot.com/
hold qcustomplot.cpp and qcustomplot.h Copy to the project directory , Then, the two files are introduced into the project, and the existing files can be added by right clicking in the project , Add two files to the project . At this time pro The file will be added qcustomplot.cpp and qcustomplot.h, What needs to be added at this time is
QT += widgets printsupport
stay UI Drag the file into a Widget, Name it Plot , Operations in subsequent procedures qcustomplot It's all him . Then promoted to QCustomPlot,.h The file with the same name automatically becomes lowercase
2、 mapping
    ui->Plot->addGraph();// Add curves
    ui->Plot->graph(0)->setPen(QPen(Qt::blue));// Set the curve color
    qDebug()<<ui->Plot->graph(0)->name();// Read curve name     Because it is not set now , The read name is  "Graph 1"
    ui->Plot->graph(0)->setName(QString("New graph "));// Set curve name     Now read again is New graph
    ui->Plot->graph(0)->setData(x, y0);// Write data
	ui->Plot->graph(0)->addData(x,y0);// Add data
	ui->Plot->graph(0)->data().data()->clear();// Clear the data retention curve
/* Axis */
    ui->Plot->xAxis2->setVisible(true);// Display above X Axis
    ui->Plot->xAxis2->setTickLabels(true);// Display above X Axis   scale
    ui->Plot->yAxis2->setVisible(true);// Show the right side Y Axis
    ui->Plot->yAxis2->setTickLabels(false);// Do not display the right side Y Axis   scale
    ui->Plot->xAxis->setVisible(true);// Show below X Axis
    ui->Plot->xAxis->setTickLabels(true);// Show below X Axis   scale
    ui->Plot->yAxis->setVisible(true);// Display left side Y Axis
    ui->Plot->yAxis->setTickLabels(false);// Do not show left side Y Axis   scale
    ui->Plot->setInteractions(QCP::iRangeDrag | QCP::iRangeZoom | QCP::iSelectPlottables);// Zoom in, drag, select, etc
	ui->Plot->xAxis->setRange(0, 100);                         // At present X The range of the axis display
	ui->Plot->yAxis->setRange(0, 10);                          // At present Y The range of the axis display
	ui->Plot->graph(0)->rescaleAxes();// Axis adaptation
ui->Plot->graph(1)->rescaleAxes(ture);//nlyEnlarge  Default false, Indicates that the range can be reduced or enlarged , If true Can only be magnified , Without narrowing the scope .
	// Since the adaptive axis will only change the lower and left axes , This ensures consistency from top to bottom , Right and left
     connect(ui->Plot->xAxis, SIGNAL(rangeChanged(QCPRange)), ui->Plot->xAxis2, SLOT(setRange(QCPRange)));
     connect(ui->Plot->yAxis, SIGNAL(rangeChanged(QCPRange)), ui->Plot->yAxis2, SLOT(setRange(QCPRange)));
     QCPRange XAxis_Range=ui->Plot->xAxis->range();// Get the value of the coordinate axis before adjustment
/* legend */
	ui->Plot->legend->setVisible(true);// Set the legend visible
//  Set the routine priority of the diagram     The default icons are arranged vertically , This is horizontal
    ui->Plot->legend->setFillOrder(QCPLayoutGrid::foColumnsFirst);
//  Set six legend auto wrap
    ui->Plot->legend->setWrap(6);
//  Set legend position , The selection here is displayed in QCPAxisRect below , Similarly, it can be set to display in QCustomPlot Anywhere in , And proportion
    ui->Plot->plotLayout()->addElement(1 , 0, ui->Plot->legend);
//  Set the display scale , The size of the box where the legend is located
    ui->Plot->plotLayout()->setRowStretchFactor(1, 0.001);
//  Set border hide , There is a frame between the legend and the curve
    ui->Plot->legend->setBorderPen(Qt::NoPen);
// Zoom in, drag, select, etc
enum Interaction { iRangeDrag         = 0x001 // Left click to drag
                   ,iRangeZoom        = 0x002 // The range can be scaled with the mouse wheel
                   ,iMultiSelect      = 0x004 // Select multiple curves in the
                   ,iSelectPlottables = 0x008 // Lines can be selected
                   ,iSelectAxes       = 0x010 // Axes are optional
                   ,iSelectLegend     = 0x020 // Legend is optional
                   ,iSelectItems      = 0x040 // Optional items ( rectangular 、 arrow 、 Text items, etc
                   ,iSelectOther      = 0x080 // All other objects are optional
                 };
    // Set canvas background color
        QLinearGradient plotGradient;
        plotGradient.setStart(0, 0);
        plotGradient.setFinalStop(0, 350);
        plotGradient.setColorAt(0, QColor(80, 80, 80));
        plotGradient.setColorAt(1, QColor(50, 50, 50));
    ui->Plot->setBackground(plotGradient);
3. Expand functions
3.1 Set the legend to synchronize with the curve
stay maindows in , Define the slot function selectionChanged.
//H file
private slots:
    void selectionChanged();
//cpp file
void MainWindow::selectionChanged()
{
      //  Synchronize the selection of graphics and the selection of corresponding legend items :
      for (int i=0; i<ui->Plot->graphCount(); ++i)
      {
        QCPGraph *graph = ui->Plot->graph(i);
        QCPPlottableLegendItem *item = ui->Plot->legend->itemWithPlottable(graph);
        if (item->selected() || graph->selected())
        {
          item->setSelected(true);        // Complete legend selection
          graph->setSelection(QCPDataSelection(graph->data()->dataRange())); // Complete the curve selection
        }
      }
}
//MainWindow Link signal and slot function in function
connect(ui->Plot, SIGNAL(selectionChangedByUser()), this, SLOT(selectionChanged()));
3.2 Change the original left key translation full key area zoom to left key translation , Right click zoom
1、 Because the official default left button is the translation curve , Let's change the pan function to right click first ( Or the middle key of the scroll wheel , According to your preference ) Up , Directly in this function
void QCPAxisRect::mousePressEvent(QMouseEvent *event, const QVariant &details) Just change it , hold Qt::LeftButton Change to Qt::RightButton that will do .
2、 stay QCustomPlot Class private Variable :( searchable class QCP_LIB_DECL QCustomPlot)
private:
  QRubberBand *rb;
  QPoint startPos;
  bool cancelRb;
3、 stay QCustomPlot Of 3 Add code to a mouse event function
//0、 In the constructor QCustomPlot::QCustomPlot(QWidget *parent) Add... To the initialization list of :
  ,rb(new QRubberBand(QRubberBand::Rectangle, this))
  ,startPos(0, 0)
//1、 When the left key is pressed , Record the coordinate starting point
     stay QCustomPlot::mousePressEvent(QMouseEvent *event) Add :
    if(event->buttons() & Qt::LeftButton)
    {
        startPos = event->pos();
        cancelRb = false;
        rb->resize(0, 0);
        rb->show();
    }

//2、 When the left key is pressed and moved , Draw rectangle
     stay void QCustomPlot::mouseMoveEvent(QMouseEvent *event) Add :

    if(event->buttons() & Qt::LeftButton)
    {
        QRect normalRect = QRect(startPos, event->pos()).normalized();// Any two points define a rectangle
        rb->setGeometry(normalRect);
    }
//3、 When the left button pops up , Record end coordinates , And enlarge the curve to 【 The starting point 、 End 】 In a rectangular box surrounded by
     stay void QCustomPlot::mouseReleaseEvent(QMouseEvent *event) Add :

    if(event->button() == Qt::LeftButton)
    {
        rb->hide();
        if(!cancelRb)
        {
            QRect normalRect = QRect(startPos, event->pos()).normalized();
            rb->setGeometry(normalRect);
            this->xAxis->setRange(xAxis->pixelToCoord(normalRect.left()),
                                  xAxis->pixelToCoord(normalRect.right()));

            this->yAxis->setRange(yAxis->pixelToCoord(normalRect.bottom()),
                                  yAxis->pixelToCoord(normalRect.top()));
            this->replot();// Refresh the image now
        }
    }
3.3 Axis oscilloscope type movement
             /* Set up X Shaft fixed length , Oscilloscope propulsion */
             if(ui->spinBox_X_Lenth->value()!=0)
             {
                 QCPRange XAxis_Range=ui->Plot->xAxis->range();// Get the value of the coordinate axis before adjustment
                 if(XAxis_Range.upper-XAxis_Range.lower>ui->spinBox_X_Lenth->value())
                 {
                    XAxis_Range.lower=XAxis_Range.upper-ui->spinBox_X_Lenth->value();
                    ui->Plot->xAxis->setRange(XAxis_Range);
                 }
             }
3.4 Change the curve style
/* routine */
connect(ui->spinBox_Line_Style_Point_Size,static_cast<void (QSpinBox::*)(const QString &)>(&QSpinBox::valueChanged),[=](){
        ui->Plot->graph(ui->comboBox_Line_Style_LineNum->currentIndex())->setScatterStyle(QCPScatterStyle(QCPScatterStyle::ScatterShape(ui->comboBox_Line_Style_Point->currentIndex()),ui->spinBox_Line_Style_Point_Size->value()));
        ui->Plot->replot();
    });
/* notes */
QCPScatterStyle::ScatterShape(ui->comboBox_Line_Style_Point->currentIndex() Corresponding
==》QCPScatterStyle::ssDisc// This is the way to take enumeration     QCPScatterStyle class ScatterShape
/* primary */
ui->Plot->graph(0)->setScatterStyle(QCPScatterStyle(QCPScatterStyle::ssDisc,5));
//QCPScatterStyle::ssDisc Point style
setScatterStyle(QCPScatterStyle( Point style , Point size ));
版权声明
本文为[Things will turn when they reach the extreme 1024]所创,转载请带上原文链接,感谢
https://yzsam.com/2022/04/202204210610057259.html
边栏推荐
- Nodejs installation
- WiFi ap6212 driver transplantation and debugging analysis technical notes
- 【ACM】455. Distribute Biscuits (1. Give priority to big biscuits to big appetite; 2. Traverse two arrays with only one for loop (use subscript index -- to traverse another array))
- 深度学习经典网络解析目标检测篇(一):R-CNN
- Serialization scheme of serde - trust
- Rust: shared variable in thread pool
- CISSP certified daily knowledge points (April 14, 2022)
- Rust: a simple example of TCP server and client
- Daily CISSP certification common mistakes (April 11, 2022)
- Test post and login function
猜你喜欢
Custom prompt box MessageBox in QT
Halo 开源项目学习(七):缓存机制

Solution to Chinese garbled code after reg file is imported into the registry

C medium? This form of
深度学习经典网络解析目标检测篇(一):R-CNN

From introduction to mastery of MATLAB (2)
Resolves the interface method that allows annotation requests to be written in postman
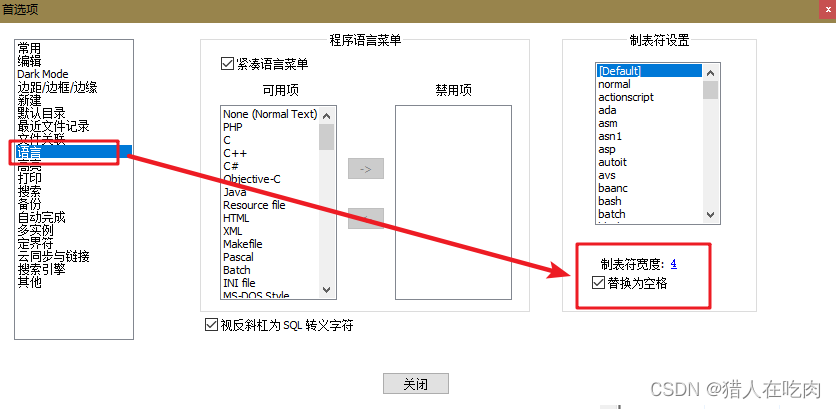
Notepad + + replaces tabs with spaces

powerdesigner各种字体设置;preview字体设置;sql字体设置
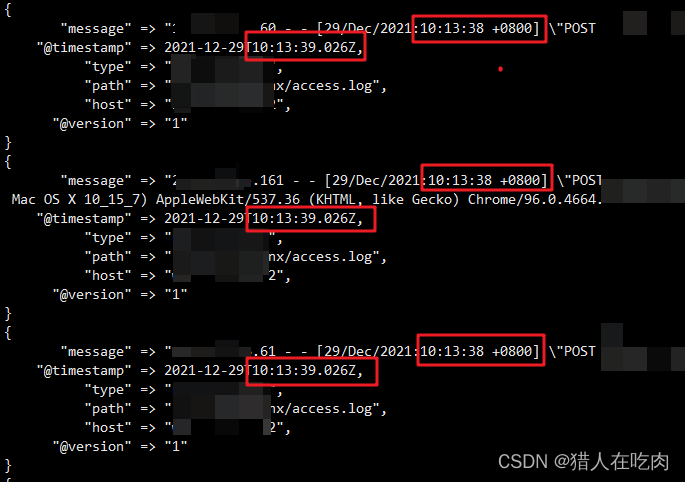
logstash 7. There is a time problem in X. the difference between @ timestamp and local time is 8 hours
随机推荐
Dock installation redis
QT reading and writing XML files (including source code + comments)
QT notes on qmap container freeing memory
SSD硬盘SATA接口和M.2接口区别(详细)总结
Deep learning classic network analysis and target detection (I): r-cnn
Interpretation and compilation of JVM
Daily CISSP certification common mistakes (April 11, 2022)
Daily network security certification test questions (April 12, 2022)
【ACM】455. Distribute Biscuits (1. Give priority to big biscuits to big appetite; 2. Traverse two arrays with only one for loop (use subscript index -- to traverse another array))
Closure type of rust (difference between FN, fnmut and fnone)
The vivado project corresponding to the board is generated by TCL script
Docker installation MySQL
Visualization of residential house prices
Queue solving Joseph problem
What are the relationships and differences between threads and processes
Solution to Chinese garbled code after reg file is imported into the registry
Daily network security certification test questions (April 15, 2022)
Function recursion and solving interesting problems
Reptile efficiency improvement method
powerdesigner各种字体设置;preview字体设置;sql字体设置