当前位置:网站首页>【科研绘图】琴图 +箱型图混合 matplotlib库和seabsorn库的使用
【科研绘图】琴图 +箱型图混合 matplotlib库和seabsorn库的使用
2022-08-10 03:21:00 【九久呀】
绘图结果
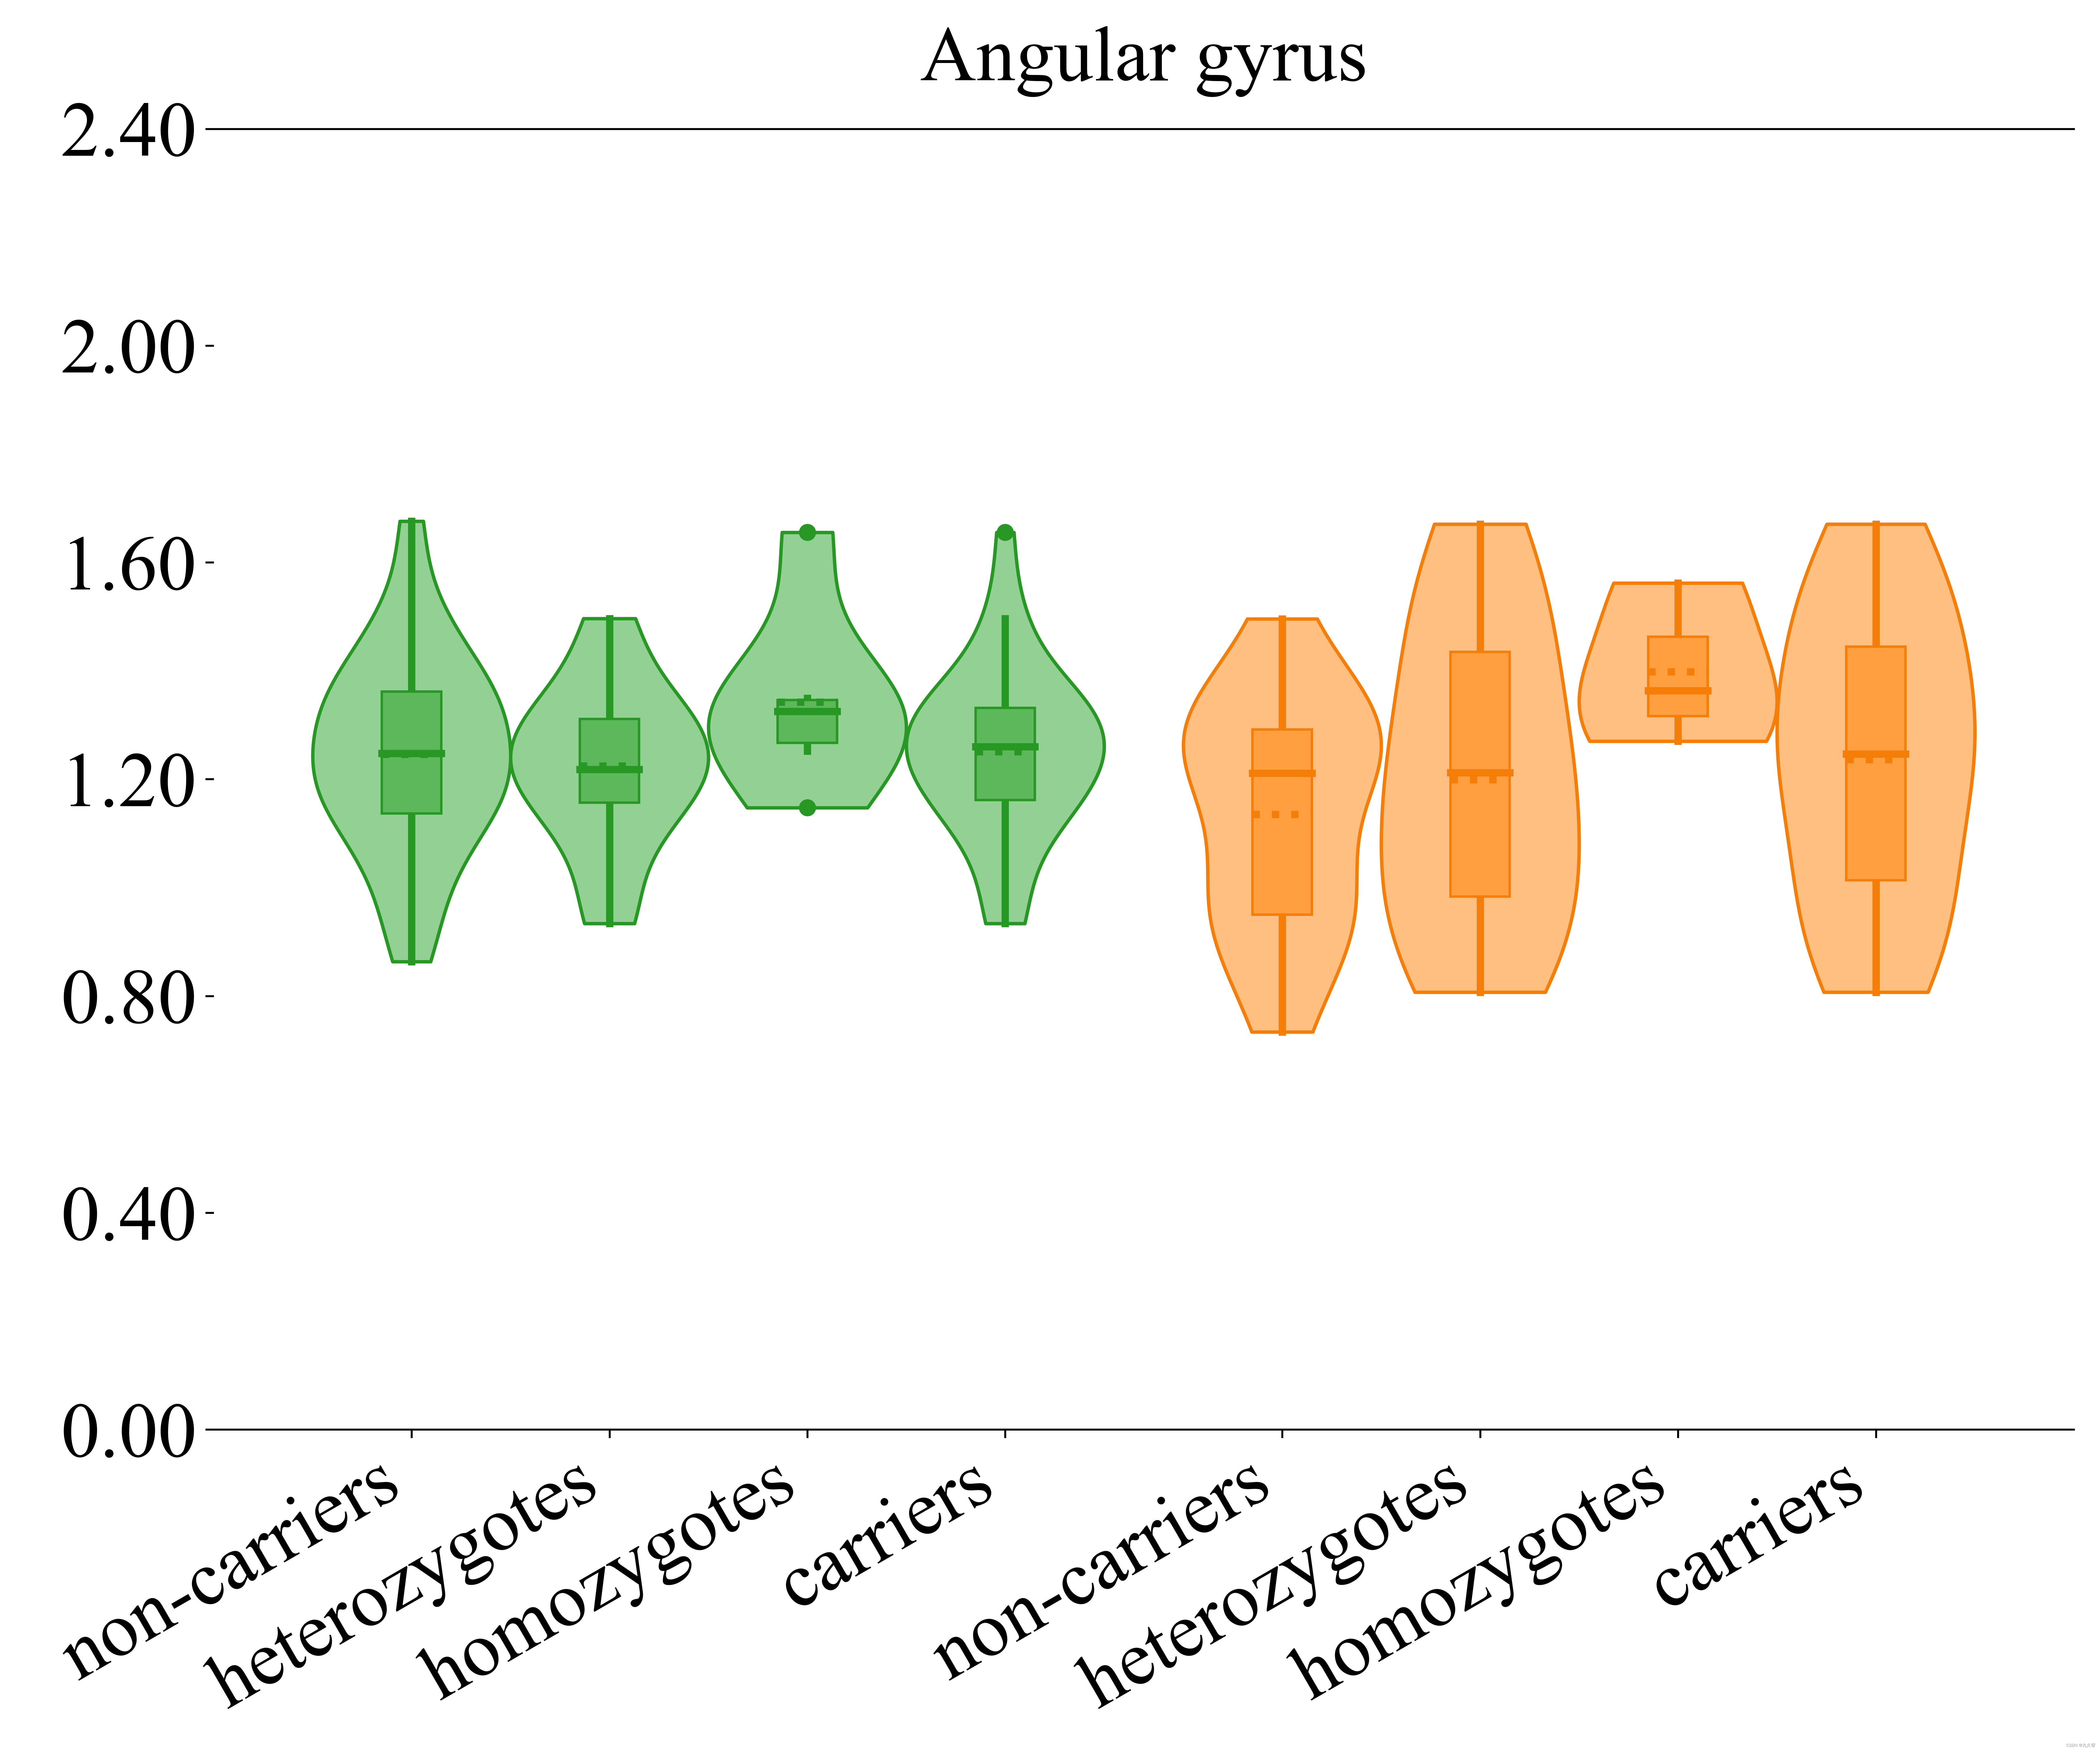
上面这张图是琴图+箱型图
Tips:
箱型图是用于看数据分布情况。琴图+箱型图的组合也越来越多的应用于论文绘图中。
更多的图片和代码请参考:
链接:https://pan.baidu.com/s/1olkdo0NFbPOWL4JIxZcAAw?pwd=vvj1
提取码:vvj1
–来自百度网盘超级会员V5的分享
绘制箱型图+琴图
导入相关库函数
这里使用matplotlib库
import matplotlib.pyplot as plt
import scipy.stats as st
import pandas as pd
import seaborn as sns
import numpy as np
from scipy import stats
import logging
import os
from matplotlib.pyplot import MultipleLocator
import matplotlib.ticker as ticker
数据导入和图片存储名称:
newROIs = ['Amygdala', 'Caudate', 'Putamen', 'Hippocampus', 'ParaHippocampal', 'Cingulate', 'Precuneus',
           'Angular', 'SupraMarginal', 'Temporal_INF', 'Temporal_MID', 'Frontal']

figName = {
    'Amygdala':'Amygdala', 'Caudate':'Caudate', 'Putamen':'Putamen', 'Hippocampus':'Hippocampus',
           'ParaHippocampal':'Parahippocampal gyrus', 'Cingulate':'Posterior cingulate gyrus', 'Precuneus':'Precuneus',
            'Angular':'Angular gyrus', 'SupraMarginal':'Supramarginal gyrus', 'Temporal_INF':'Inferior temporal gyrus',
          'Temporal_MID':'Middle temporal gyrus', 'Frontal':'Superior frontal gyrus'}
dst = 't1'
if os.path.exists(dst) == False:
    os.makedirs(dst)
roi = newROIs[0]


if not os.path.exists('logging'):
    os.mkdir('logging')
hi2 = pd.read_csv('C:/Users/28411/python/limpid/Data_XM_BL&FU/test_0414/{0}/{1}.csv'.format(dst, roi), sep=',')
logging进行写入日志
logging.basicConfig(level=logging.INFO, format='%(asctime)s - %(message)s [%(filename)s:%(lineno)d]',
                        filename='logging/'+'{0}.log'.format(dst), datefmt='%Y-%m-%d %H:%M:%S')

logging.info("\nStart!Reading {0}.csv".format(roi))
设置图形颜色
emci_color = '#8dbada'
lmci_color = '#ffbf81'


emciEdgeColor = '#1a71af'
lmciEdgeColor = '#f57e09'


emciBoxFaceColor = '#5298c7'
lmciBoxFaceColor = '#ff9f40'


for i in range(4):
    edgeColor.append(emciEdgeColor)
    seaborn_color2.append(emci_color)
    whiskers_color2.append(emciEdgeColor)
    whiskers_color2.append(emciEdgeColor)
    boxFaceColor.append(emciBoxFaceColor)
for i in range(4):
    edgeColor.append(lmciEdgeColor)
    seaborn_color2.append(lmci_color)
    whiskers_color2.append(lmciEdgeColor)
    whiskers_color2.append(lmciEdgeColor)
    boxFaceColor.append(lmciBoxFaceColor)
inx2 = ['non-carriers', 'heterozygotes', 'homozygotes', 'carriers']
index2 = inx2 * 2

BG_WHITE = "#fbf9f4"
GREY_LIGHT = "#b4aea9"
GREY50 = "#7F7F7F"
BLUE_DARK = "#1B2838"
BLUE = "#2a475e"
BLACK = "#282724"
GREY_DARK = "#747473"
RED_DARK = "#850e00"
将数据进行转化
y_data = []
for i in range(hi2.shape[1]):
    da = []
    x = hi2.iloc[:, i].values
    for xi in x:
        if(str(xi)) == 'nan':
            continue
        da.append(xi.astype(float))
    y_data.append(da)
设置位置下标
POSITIONS = [1,1.5,2,2.5,  3.2,3.7,4.2,4.7]
posi = np.array([1,1.5,2,2.5,  3.2,3.7,4.2,4.7])
开始画图
plt.rc('font', family='Times New Roman') # 设置字体
fig, ax = plt.subplots(figsize=(12, 10), dpi=600) # 使用subplot进行画图
ax.spines['right'].set_visible(False) # 设置坐标轴是否可见
# ax.spines['left'].set_visible(False)
violins = ax.violinplot( # 绘制小提琴图
    y_data,
    positions=POSITIONS,
    # bw_method="silverman",
    # showmeans=False,
    # showmedians=,
    showextrema=False
)

for i in range(8): # 上色
    ax.get_children()[i].set_color(seaborn_color2[i])

for pc in violins["bodies"]:
    pc.set_alpha(1)
    pc.set_linewidth(1.4)

violins["bodies"][0].set_edgecolors(emciEdgeColor) # 因为小提琴图是以字典形式返回的,所以这里也使用字典形式进行添加绘制信息
violins["bodies"][1].set_edgecolors(emciEdgeColor)
violins["bodies"][2].set_edgecolors(emciEdgeColor)
violins["bodies"][3].set_edgecolors(emciEdgeColor)

violins["bodies"][4].set_edgecolors(lmciEdgeColor)
violins["bodies"][5].set_edgecolors(lmciEdgeColor)
violins["bodies"][6].set_edgecolors(lmciEdgeColor)
violins["bodies"][7].set_edgecolors(lmciEdgeColor)

medianprops = dict(
    linewidth=1,
    # color='',
    solid_capstyle="butt"
)
whiskerprops = dict(
    linewidth=1
)

boxprops = dict(
    linewidth=1,
    # color=seaborn_color2,
)

flierprops = dict(marker='o')

bplot = ax.boxplot( # 绘制箱型图
    y_data,
    widths=0.15,
    positions=POSITIONS,
    flierprops=flierprops,

    showfliers=True,
    labels=index2,
    # labels=['EMCI','MCI', 'LMCI','EMCI','MCI', 'LMCI','EMCI','MCI', 'LMCI'],
    # medianprops= medianprops,
    # whiskerprops = whiskerprops,
    # boxprops = boxprops,
    showmeans=True,
    patch_artist=True,
    meanline=True,
    showcaps=False

)

for patch, c in zip(bplot['boxes'], edgeColor):
    patch.set_color(c)

for patch, c in zip(bplot['boxes'], boxFaceColor):
    patch.set(facecolor=c)

for patch, c in zip(bplot['whiskers'], whiskers_color2):
    patch.set_color(c)
    patch.set_linewidth(3)
for patch, c in zip(bplot['medians'], edgeColor):
    patch.set_color(c)
    patch.set_linewidth(3)

for patch, c in zip(bplot['means'], edgeColor):
    patch.set_color(c)
    patch.set_linewidth(3)
    patch.set_linestyle(':')

for patch, c in zip(bplot['fliers'], edgeColor):
    patch.set_markeredgecolor(c)
    patch.set_markerfacecolor(c)

y_t = ax.get_yticks()

plt.gca().yaxis.set_major_formatter(ticker.FormatStrFormatter('%.2f'))

plt.tick_params(labelsize=32)
if dst == 'av45':
    ax.set_ylabel('${^1}$${^8}$F-AV45 PET SUVR', fontsize=26)
if dst == 'fdg':
    ax.set_ylabel('${^1}$${^8}$F-FDG PET SUVR', fontsize=26)
if dst == 't1':
    ax.set_ylabel('Gray matter density', fontsize=32)
y_major_locator = MultipleLocator(0.2)
ax.yaxis.set_major_locator(y_major_locator)

ax.set_title('{0}'.format(figName[roi]), fontsize=32, pad=20)
ax.set_xticklabels(index2, rotation=30, horizontalalignment='right')

ax.set_ylim(0, 0.8)


plt.tight_layout() # 这行代码很重要,进行图片大小调整
升级版
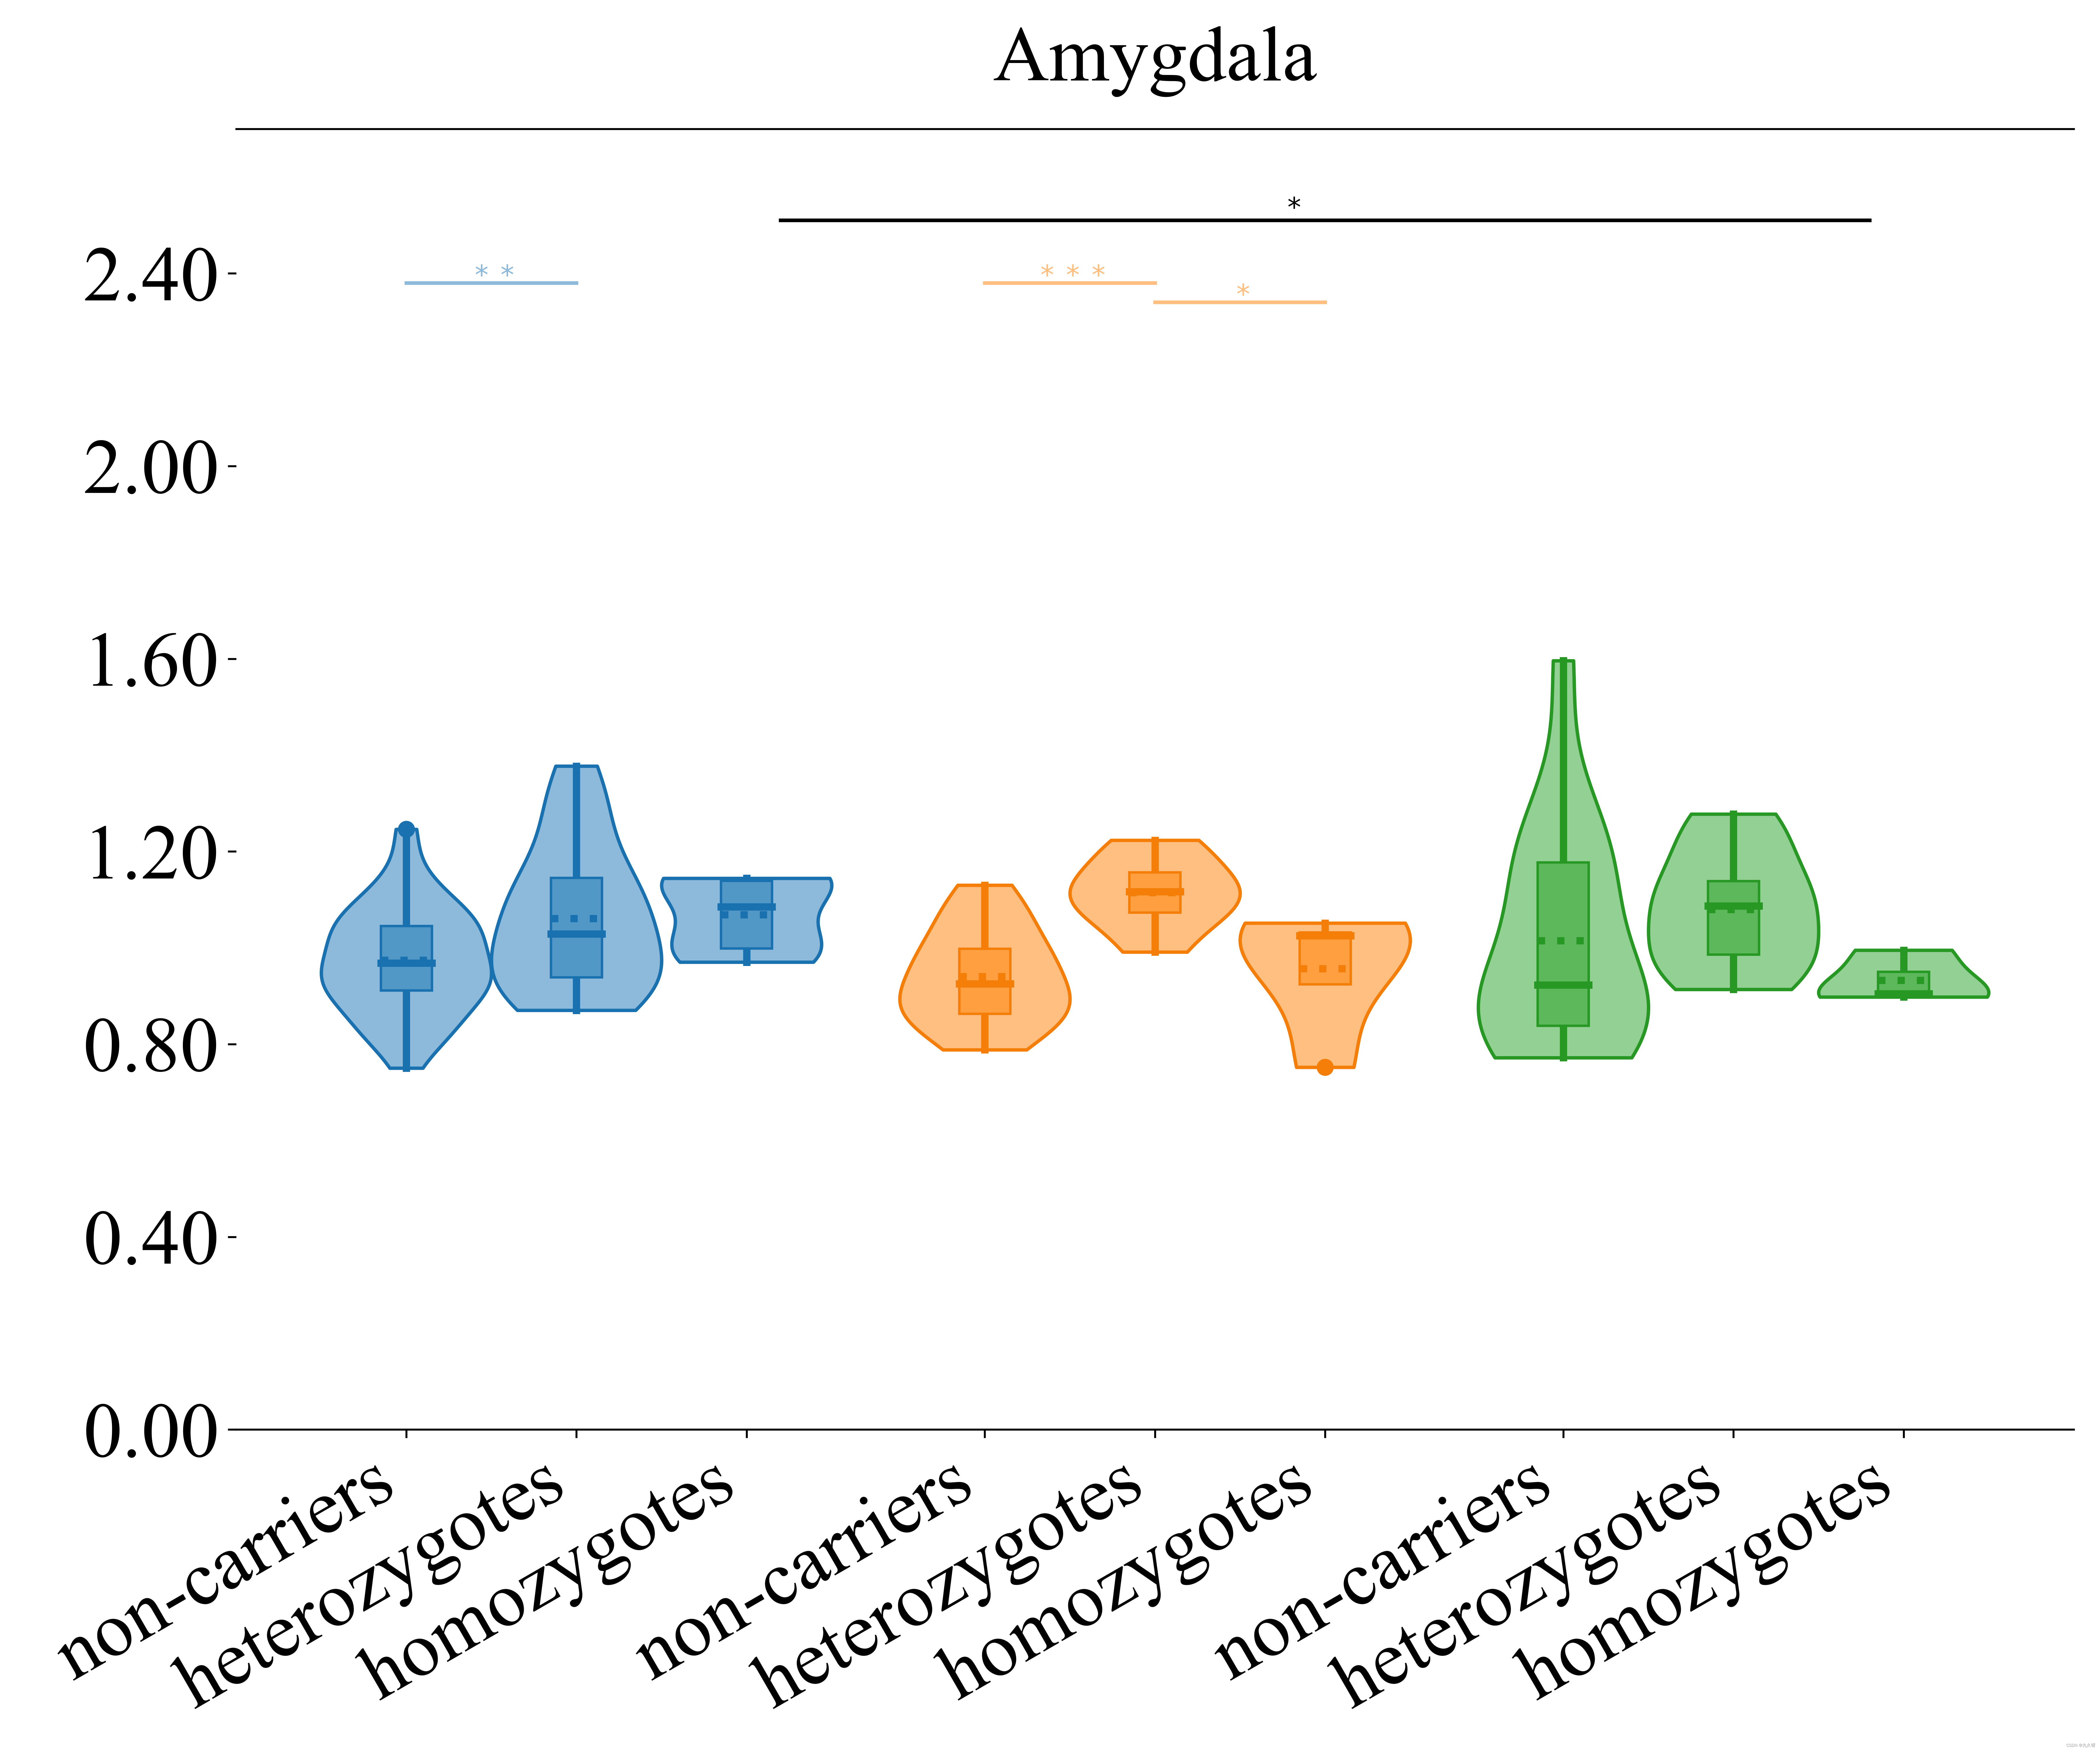
画图代码
import matplotlib.pyplot as plt
import scipy.stats as st
import pandas as pd
import seaborn as sns
import numpy as np
from scipy import stats
import logging
import os
from matplotlib.pyplot import MultipleLocator
import matplotlib.ticker as ticker


newROIs = ['Amygdala', 'Caudate', 'Putamen', 'Hippocampus', 'ParaHippocampal', 'Cingulate', 'Precuneus',
           'Angular', 'SupraMarginal', 'Temporal_INF', 'Temporal_MID', 'Frontal']

figName = {
    'Amygdala':'Amygdala', 'Caudate':'Caudate', 'Putamen':'Putamen', 'Hippocampus':'Hippocampus',
           'ParaHippocampal':'Parahippocampal gyrus', 'Cingulate':'Posterior cingulate gyrus', 'Precuneus':'Precuneus',
            'Angular':'Angular gyrus', 'SupraMarginal':'Supramarginal gyrus', 'Temporal_INF':'Inferior temporal gyrus',
          'Temporal_MID':'Middle temporal gyrus', 'Frontal':'Superior frontal gyrus'}
dst = 'fdg'
if os.path.exists(dst) == False:
    os.makedirs(dst)
roi = newROIs[8]


if not os.path.exists('logging'):
    os.mkdir('logging')
hi2 = pd.read_csv('C:/Users/28411/Desktop/limpid/Data_XM/ROIs/BaseLineROIs/{0}/{1}.csv'.format(dst, roi), sep=',')

logging.basicConfig(level=logging.INFO, format='%(asctime)s - %(message)s [%(filename)s:%(lineno)d]',
                        filename='logging/'+'{0}.log'.format(dst), datefmt='%Y-%m-%d %H:%M:%S')

logging.info("\nStart!Reading {0}.csv".format(roi))

seaborn_color2 = []
whiskers_color2 = []
edgeColor = []
boxFaceColor = []

emci_color = '#8dbada'
mci_color = '#ffbf81'
lmci_color = '#93d094'

emciEdgeColor = '#1a71af'
mciEdgeColor = '#f57e09'
lmciEdgeColor = '#279824'

emciBoxFaceColor = '#5298c7'
mciBoxFaceColor = '#ff9f40'
lmciBoxFaceColor = '#5db85b'

for i in range(3):
    edgeColor.append(emciEdgeColor)
    seaborn_color2.append(emci_color)
    whiskers_color2.append(emciEdgeColor)
    whiskers_color2.append(emciEdgeColor)
    boxFaceColor.append(emciBoxFaceColor)

for i in range(3):
    edgeColor.append(mciEdgeColor)
    seaborn_color2.append(mci_color)
    whiskers_color2.append(mciEdgeColor)
    whiskers_color2.append(mciEdgeColor)
    boxFaceColor.append(mciBoxFaceColor)

for i in range(3):
    edgeColor.append(lmciEdgeColor)
    seaborn_color2.append(lmci_color)
    whiskers_color2.append(lmciEdgeColor)
    whiskers_color2.append(lmciEdgeColor)
    boxFaceColor.append(lmciBoxFaceColor)
inx2 = ['non-carriers', 'heterozygotes', 'homozygotes']
index2 = inx2 * 3

y_data = []
for i in range(hi2.shape[1]):
    da = []
    x = hi2.iloc[:, i].values
    for xi in x:
        if(str(xi)) == 'nan':
            continue
        da.append(xi.astype(float))
    y_data.append(da)

POSITIONS = [1,1.5,2, 2.7,3.2,3.7, 4.4,4.9,5.4]
BG_WHITE = "#fbf9f4"
GREY_LIGHT = "#b4aea9"
GREY50 = "#7F7F7F"
BLUE_DARK = "#1B2838"
BLUE = "#2a475e"
BLACK = "#282724"
GREY_DARK = "#747473"
RED_DARK = "#850e00"

posi = np.array([1,1.5,2,  2.7,3.2,3.7,  4.4,4.9,5.4])

plt.rc('font', family='Times New Roman')
fig, ax = plt.subplots(figsize=(12, 10), dpi=600)
ax.spines['right'].set_visible(False)
ax.spines['left'].set_visible(False)
violins = ax.violinplot(
    y_data,
    positions=POSITIONS,
    # bw_method="silverman",
    # showmeans=False,
    # showmedians=,
    showextrema=False
)

for i in range(9):
    ax.get_children()[i].set_color(seaborn_color2[i])

for pc in violins["bodies"]:
    pc.set_alpha(1)
    pc.set_linewidth(1.4)

# violins["bodies"][0].set_label('EMCI')
# violins["bodies"][3].set_label('MCI')
# violins["bodies"][6].set_label('LMCI')

violins["bodies"][0].set_edgecolors(emciEdgeColor)
violins["bodies"][1].set_edgecolors(emciEdgeColor)
violins["bodies"][2].set_edgecolors(emciEdgeColor)

violins["bodies"][3].set_edgecolors(mciEdgeColor)
violins["bodies"][4].set_edgecolors(mciEdgeColor)
violins["bodies"][5].set_edgecolors(mciEdgeColor)

violins["bodies"][6].set_edgecolors(lmciEdgeColor)
violins["bodies"][7].set_edgecolors(lmciEdgeColor)
violins["bodies"][8].set_edgecolors(lmciEdgeColor)

medianprops = dict(
    linewidth=1,
    # color='',
    solid_capstyle="butt"
)
whiskerprops = dict(
    linewidth=1
)

boxprops = dict(
    linewidth=1,
    # color=seaborn_color2,
)

flierprops = dict(marker='o')

bplot = ax.boxplot(
    y_data,
    widths=0.15,
    positions=POSITIONS,
    flierprops=flierprops,

    showfliers=True,
    labels=index2,
    # labels=['EMCI','MCI', 'LMCI','EMCI','MCI', 'LMCI','EMCI','MCI', 'LMCI'],
    # medianprops= medianprops,
    # whiskerprops = whiskerprops,
    # boxprops = boxprops,
    showmeans=True,
    patch_artist=True,
    meanline=True,
    showcaps=False

)

for patch, c in zip(bplot['boxes'], edgeColor):
    patch.set_color(c)

for patch, c in zip(bplot['boxes'], boxFaceColor):
    patch.set(facecolor=c)

for patch, c in zip(bplot['whiskers'], whiskers_color2):
    patch.set_color(c)
    patch.set_linewidth(3)
for patch, c in zip(bplot['medians'], edgeColor):
    patch.set_color(c)
    patch.set_linewidth(3)

for patch, c in zip(bplot['means'], edgeColor):
    patch.set_color(c)
    patch.set_linewidth(3)
    patch.set_linestyle(':')

for patch, c in zip(bplot['fliers'], edgeColor):
    patch.set_markeredgecolor(c)
    patch.set_markerfacecolor(c)

y_t = ax.get_yticks()


plt.gca().yaxis.set_major_formatter(ticker.FormatStrFormatter('%.2f'))


plt.tick_params(labelsize=32)
# if dst == 'av45':
# ax.set_ylabel('${^1}$${^8}$F-AV45 PET SUVR', fontsize=26)
# if dst == 'fdg':
# ax.set_ylabel('${^1}$${^8}$F-FDG PET SUVR', fontsize=26)
# if dst == 't1':
# ax.set_ylabel('Gray matter volume', fontsize=26)
y_major_locator = MultipleLocator(0.4)
ax.yaxis.set_major_locator(y_major_locator)

ax.set_title('{0}'.format(figName[roi]), fontsize=32, pad=20)
ax.set_xticklabels(index2, rotation=30, horizontalalignment='right')

ax.set_ylim(0, 2.4+0.3)

highhh = 2.3

# y_labels = np.linspace(0, highhh, 6)
#
# ax.set_yticklabels(y_labels, fontsize=16)
# plt.legend()

plt.tight_layout()


def plotLine(num, posiOne, posiTwo, pValue):

    if pValue<0.001:
        labelp = '${^*}$${^*}$${^*}$'
    elif pValue <0.01:
        labelp = '${^*}$${^*}$'
    elif pValue<0.05:
        labelp = '${^*}$'

    # inner group
    if posiTwo - posiOne == 0.5 or posiTwo - posiOne == 1:

        if posiTwo <= 2:
            if posiOne == 1.0 and posiTwo == 2.0:
                ax.plot([1.0, 1.0, 2.0, 2.0], [highhh+0.12, highhh+0.12, highhh+0.12, highhh+0.12], c=emci_color)
                ax.text(1.5, highhh+0.07, labelp, fontsize=16, va="bottom", ha="center", c=emci_color)
            if posiOne == 1 and posiTwo == 1.5:
                ax.plot([1.0, 1.0, 1.5, 1.5], [highhh+0.08, highhh+0.08, highhh+0.08, highhh+0.08], c=emci_color)
                ax.text(1.25, highhh+0.03, labelp, fontsize=16, va="bottom", ha="center", c=emci_color)
            if posiOne == 1.5 and posiTwo == 2.0:
                ax.plot([1.5, 1.5, 2.0, 2.0], [highhh+0.04, highhh+0.04, highhh+0.04, highhh+0.04], c=emci_color)
                ax.text(1.75, highhh-0.01, labelp, fontsize=16, va="bottom", ha="center", c=emci_color)

        elif posiTwo <= 3.7:
            if posiOne == 2.7 and posiTwo == 3.7:
                ax.plot([2.7, 2.7, 3.7, 3.7], [highhh+0.12, highhh+0.12, highhh+0.12, highhh+0.12], c=mci_color)
                ax.text(3.2, highhh+0.07, labelp, fontsize=16, va="bottom", ha="center", c=mci_color)
            if posiOne == 2.7 and posiTwo == 3.2:
                ax.plot([2.7, 2.7, 3.2, 3.2], [highhh+0.08, highhh+0.08, highhh+0.08, highhh+0.08], c=mci_color)
                ax.text(2.95, highhh+0.03, labelp, fontsize=16, va="bottom", ha="center", c=mci_color)
            if posiOne == 3.2 and posiTwo == 3.7:
                ax.plot([3.2, 3.2, 3.7, 3.7], [highhh+0.04, highhh+0.04, highhh+0.04, highhh+0.04], c=mci_color)
                ax.text(3.45, highhh-0.01, labelp, fontsize=16, va="bottom", ha="center", c=mci_color)

        elif posiTwo <= 5.4:
            if posiOne == 4.4 and posiTwo == 5.4:
                ax.plot([4.4, 4.4, 5.4, 5.4], [highhh+0.12, highhh+0.12, highhh+0.12, highhh+0.12], c=lmci_color)
                ax.text(4.9, highhh+0.07, labelp, fontsize=16, va="bottom", ha="center", c=lmci_color)
            if posiOne == 4.4 and posiTwo == 4.9:
                ax.plot([4.4, 4.4, 4.9, 4.9], [highhh+0.08, highhh+0.08, highhh+0.08, highhh+0.08], c=lmci_color)
                ax.text(4.65, highhh+0.03, labelp, fontsize=16, va="bottom", ha="center", c=lmci_color)
            if posiOne == 4.9 and posiTwo == 5.4:
                ax.plot([4.9, 4.9, 5.4, 5.4], [highhh+0.04, highhh+0.04, highhh+0.04, highhh+0.04], c=lmci_color)
                ax.text(5.15, highhh-0.01, labelp, fontsize=16, va="bottom", ha="center", c=lmci_color)
    else:
        up = num * 0.07

        if up == 0.07:
            up += 0.09

        # print('plotLine from {0} to {1}'.format(posiOne, posiTwo))

        ax.plot([posiOne + 0.1, posiOne + 0.1, posiTwo - 0.1, posiTwo - 0.1],
                [highhh + up, highhh + up, highhh + up, highhh + up],
                c="black")
        x_label = (posiOne+posiTwo-0.2)/2
        y_label = highhh+up-0.04
        print(num, labelp)
        ax.text(x_label, y_label, labelp, fontsize=16, va="bottom", ha="center", c='k')
        # print(x_label, y_label)

    return

y = y_data
emci_0 = y[0]
emci_1 = y[1]
emci_2 = y[2]

mci_0 = y[3]
mci_1 = y[4]
mci_2 = y[5]

lmci_0 = y[6]
lmci_1 = y[7]
lmci_2 = y[8]

nine={
    'emci_0': emci_0, 'emci_1': emci_1,'emci_2': emci_2, 'mci_0': mci_0, 'mci_1': mci_1, 'mci_2': mci_2,
      'lmci_0': lmci_0, 'lmci_1': lmci_1, 'lmci_2': lmci_2}
nine_name = ['emci_0', 'emci_1', 'emci_2', 'mci_0', 'mci_1', 'mci_2', 'lmci_0', 'lmci_1', 'lmci_2']
边栏推荐
猜你喜欢


随机推荐
同样是初级测试,凭什么他比我薪资高 5000 块?
金融口译,口译中金融高频词有哪些
MongoDB 常用查询语句
《天才基本法》:平行时空的第二次选择,小演员的表现意外出圈
mediaserver创建
2022/08/09 学习笔记 (day26) IO流
小程序分包及分包预下载
sql优化
NFG电商系统在元宇宙趋势下做什么?
flutter 制作嵌套列表
质量小议13 -- 侥幸
嵌入式分享合集32
笔试题记录
golang中的URL 的编码和解码(转)
所谓软件测试工作能力强,其实就是这 5 点
二进制与内存
flutter异步
使用注解实现限流
如何使用腾讯字体,已经在什么场合下可以使用该字体?TTTGB-Medium
互联网公司高频面试题精讲:测试计划和测试方案有什么区别?