当前位置:网站首页>Your brain expands and shrinks over time — these charts show how
Your brain expands and shrinks over time — these charts show how
2022-04-23 16:58:00 【Lily's autumn】
Don't copy sentence by sentence , Use it Yicat The whole translation is then exported .
Based on more than 120,000 brain scans, the charts are still preliminary. But researchers hope they could one day be used as a routine clinical tool by physicians.
When neuroscientist Jakob Seidlitz took his 15-month-old son to the paediatrician for a check-up last week, he left feeling unsatisfied. There wasn’t anything wrong with his son — the youngster seemed to be developing at a typical pace, according to the height and weight charts the physician used. What Seidlitz felt was missing was an equivalent metric to gauge how his son’s brain was growing. “It is shocking how little biological information doctors have about this critical organ,” says Seidlitz, who is based at the University of Pennsylvania in Philadelphia.
Soon, he might be able to change that. Working with colleagues, Seidlitz has amassed more than 120,000 brain scans — the largest collection of its kind — to create the first comprehensive growth charts for brain development. The charts show visually how human brains expand quickly early in life and then shrink slowly with age. The sheer magnitude of the study, published in Nature on 6 April1, has stunned neuroscientists, who have long had to contend with reproducibility issues in their research, in part because of small sample sizes. Magnetic resonance imaging (MRI) is expensive, meaning that scientists are often limited in the number of participants they can enrol in experiments.
“The massive data set they assembled is extremely impressive and really sets a new standard for the field,” says Angela Laird, a cognitive neuroscientist at Florida International University in Miami.
Even so, the authors caution that their database isn’t completely inclusive — they struggled to gather brain scans from all regions of the globe. The resulting charts, they say, are therefore just a first draft, and further tweaks would be needed to deploy them in clinical settings.
If the charts are eventually rolled out to paediatricians, great care will be needed to ensure that they are not misinterpreted, says Hannah Tully, a paediatric neurologist at the University of Washington in Seattle. “A big brain is not necessarily a well-functioning brain,” she says.
These charts can show ---- Your brain expands over time and eventually shrinks
Based on more than 120,000 A brain scan , These charts are still in their infancy . But researchers hope that one day they can be used as routine clinical tools for doctors .
Be a psychiatrist Jakob Seidlitz Take him 15 My six month old son went to the pediatrician for examination last week , He was not satisfied when he left . His son has no problem at all —— According to the height and weight table used by the doctor , This little guy seems to be developing at an average level . Give Way Seidlitz What is missing is that there is no equivalent standard to measure his son's brain growth .Seidlitz say , It's a shock , Doctors have so little biological information about such an important organ ,Seidlitz At the University of Pennsylvania in Philadelphia .
soon , He may change the situation .Seidlitz Collected more than... With colleagues 120,000 A brain scan —— The largest collection under this category —— To create the first comprehensive growth chart of brain development . These charts visually show how the human brain grows rapidly early in life and slowly shrinks with age . Published in 4 month 6 The no. Nature The scale of the study shocked neuroscientists , For a long time , They have to deal with the problem of recurrence in research , Part of the reason is that the sample size is too small . MRI is too expensive , It means that scientists often limit the number of people who can participate in experiments .
Cognitive neuroscientist at Florida International University in Miami Angela Laird say , The massive data sets they collect are very useful , Set new standards for this field .
even so , The authors warn that their data set does not contain complete , They struggle to collect brain scans from all regions of the world . They say , This result chart is only the first draft of the first edition , It needs further adjustment before it can be deployed in clinic .
Hannah Tully say , If this chart is eventually promoted to pediatricians , Great care needs to be taken to ensure that they are not misinterpreted , He is a pediatric neuroscientist at the University of Washington in Seattle . She said , A big brain doesn't have to be a well functioning brain .
No easy task
Because brain structure varies significantly from person to person, the researchers had to aggregate a huge number of scans to create an authoritative set of growth charts with statistical significance. That’s no easy task, says Richard Bethlehem, a neuroscientist at the University of Cambridge, UK, and a co-author of the study. Instead of running thousands of scans themselves, which would take decades and be prohibitively costly, the researchers turned to already-completed neuroimaging studies.
Bethlehem and Seidlitz sent e-mails to researchers all over the world asking if they would share their neuroimaging data for the project. The duo was amazed by the number of replies, which they attribute to the COVID-19 pandemic giving researchers less time in their laboratories and more time than usual with their e-mail inboxes.
In total, the team aggregated 123,894 MRI scans from 101,457 people, who ran the gamut from fetuses 16 weeks after conception to 100-year-old adults. The scans included brains from neurotypical people, as well as people with a variety of medical conditions, such as Alzheimer’s disease, and neurocognitive differences, including autism spectrum disorder. The researchers used statistical models to extract information from the images, and ensure that the scans were directly comparable, no matter what type of MRI machine had been used.
The end result is a set of charts plotting several key brain metrics by age. Some metrics, such as grey-matter volume and mean cortical thickness (the width of the grey matter) peak early in a person’s development, whereas the volume of white matter (found deeper in the brain) tends to peak by around age 30 (see ‘Brain change’). The data on ventricular volume (the amount of cerebrospinal fluid in the brain), in particular, surprised Bethlehem. Scientists knew that this volume increases with age, because it is typically associated with brain atrophy, but Bethlehem was shocked by how rapidly it tends to grow in late adulthood.
Not a simple task
Because the structure of the brain is very different from person to person , Researchers need to organize a large number of scans to create a statistically significant and authoritative set of growth charts . This is not a simple task , A neuroscientist at the University of Cambridge, England , And co-author of the study Richard Bethlehem say . Researchers turned to mature neuroimaging research , Instead of scanning themselves thousands of times, which can take decades and can be expensive .
Bethlehem and Seidlitz Email researchers around the world , Ask them if they can share neuroimaging for this project . These two people were surprised by the number of replies , Because of the new epidemic , Compared with the past , Researchers spend less time in their own laboratories , Spend more time in your email inbox .
Final , Team from 101,457 Someone collected 123,894 Share MRI scanning , These people from 16 Week's fetus to 100 Adult... Years old . These scans include people with typical nerves , And experience a variety of diseases, such as Alzheimer's disease , There are also neurocognitive differences, including people with autism spectrum disorders . Researchers use statistical models to extract information from images , And make sure these scans are directly comparable , No matter what model is used MRI machine .
The end result is a set of graphs and tables , Draw several key brain indicators based on age . Some indicators , Such as gray matter volume and average cortical thickness ( Gray matter width ) Peak in early human development , White matter volume ( Deep in the brain ) Tend to be in 30 Peak around age ( See brain changes ). Ventricular volume ( The amount of cerebrospinal fluid in the brain ) The data of , Especially shocked Bethlehem. Scientists know that this volume increases with age , Because it is typically associated with brain atrophy , however Bethlehem It's amazing how fast it grows in late adulthood .
A first draft
The study comes on the heels of a bombshell paper published in Nature on 16 March2 showing that most brain-imaging experiments contain too few scans to reliably detect links between brain function and behaviour, meaning that their conclusions might be incorrect. Given this finding, Laird expects the field to move towards adopting a framework similar to the one used by Seidlitz and Bethlehem, to increase statistical power.
To amass so many data sets is akin to a “diplomatic masterpiece”, says Nico Dosenbach, a neuroscientist at Washington University in St. Louis, Missouri, who co-authored the 16 March study. He says this is the scale on which researchers should operate when aggregating brain images.
Despite the size of the data set, Seidlitz, Bethlehem and their colleagues acknowledge that their study suffers from a problem endemic to neuroimaging studies — a remarkable lack of diversity. The brain scans they collected come mainly from North America and Europe, and disproportionately reflect populations that are white, university-aged, urban and affluent. This limits the generalizability of the findings, says Sarah-Jayne Blakemore, a cognitive neuroscientist at the University of Cambridge. The study includes only three data sets from South America and one from Africa — accounting for around 1% of all the brain scans used in the study.
Billions of people worldwide lack access to MRI machines, making diverse brain-imaging data difficult to come by, Laird says. But the authors haven’t stopped trying. They have launched a website where they intend to update their growth charts in real time as they receive more brain scans.
first draft
The study was published in 3 month 16 Japan Nature After the last explosive paper , Most brain scans show too few articles , Can't reliably detect the link between brain function and behavior , It means that their conclusion may not be correct . Given this finding ,Laird It is expected that the field will move towards adopting similar Seidlitz and Bethlehem Use the frame to move forward , To increase statistical power .
Collecting so many data sets is similar to a “ Diplomatic masterpiece ”,Nico Dosenbach say , He is a neuroscientist at Washington University in St. Louis, Missouri , It's also 3 month 16 Co author of the Japanese article . He said , That's the number of brain images researchers should collect .
Remove data set size ,Seidlitz, Bethlehem And colleagues admit that their research also has a unique problem of neural images —— Very lack of difference . The brain scans they collected were mainly from North America and Europe , Disproportionately reflects white people , College age , Cities and wealthy people . The universality of this study is limited ,Sarah-Jayne Blakemore say , She is a cognitive neuroscientist at Cambridge University . The study included only three data sets from South America and one data set from Africa , About% of all brain scans used in the study 1%.
Laird say , Billions of people in the world have no access to MRI equipment , It makes it difficult to obtain the difference data of brain images . But the author didn't stop trying . They have posted a website , The plan is to update the growth chart in real time when more brain scans are received .
With big data sets, big responsibility
Another challenge was determining how to give proper credit to the owners of the brain scans used to construct the charts. Some of the scans came from open-access data sets, but others were closed to researchers. Most of the closed-data scans hadn’t yet been processed in a way that would allow them to be incorporated into the growth charts, so their owners did extra work to share them. These scientists were then named as authors of the paper.
Meanwhile, the owners of the open data sets received only a citation in the paper — which doesn’t hold as much prestige for researchers seeking funding, collaborations and promotions. Seidlitz, Bethlehem and their colleagues processed these data. In most cases, Bethlehem says that there was essentially no direct contact with the owners of these data sets. The paper lists about 200 authors and cites the work of hundreds of others who contributed brain scans.
There are a number of reasons that data sets might be closed: for instance, to protect the privacy of health data, or because researchers don’t have the resources to make them public. But this doesn’t make it fair that the researchers who opened their data sets didn’t get authorship, the authors say. In their paper’s Supplementary Information, they argue that the situation “perversely disincentivises open science, since the people who do most to make their data openly available could be least likely to merit recognition”. Bethlehem and Seidlitz contend that authorship guidelines from journals, including Nature — which say that each author is expected to have made “substantial contributions” to, for example, the analysis or interpretation of data — are an obstacle. (Nature’s news team is editorially independent of its publisher.)
A Nature spokesperson responds that the issue was “considered carefully by the editors and authors according to our authorship policies” and that “all datasets were appropriately credited per our data citation policy”.
Ultimately, these concerns can be traced back to how researchers are evaluated by the scientific enterprise, says Kaja LeWinn, a social epidemiologist at the University of California, San Francisco, who studies neurodevelopment. She says that it’s incumbent on all of the relevant stakeholders — including funders, journals and research institutions — to re-evaluate how brain science can be properly recognized and rewarded, especially as these types of large-scale study become more common.
Larger datasets , Greater responsibility
Another challenge is to determine how to give proper trust to the owner of the brain scan used to build the chart . Some scans come from open source data sets , Others are not open to researchers . Most closed scan datasets do not yet have a processing method that allows them to be incorporated into growth charts , So their owners do extra work to share them . These scientists will then be named the authors of the article .
meanwhile , The owners of these open datasets have only received references to the article , This is for those who seek funding , There are not many advantages for researchers who cooperate and promote .Seidlitz, Bethlehem And their colleagues processed the data .Bethlehem say , in the majority of cases , They have basically no direct connection with the owners of these data sets . The article lists about 200 authors , And cited the works of hundreds of authors who contributed to brain scans .
These datasets may be closed for a number of reasons : for instance , To protect the privacy of health data , Or because researchers don't have the resources to publish them . The author says , But it's not fair to researchers who disclose their data sets but don't get the identity of the author . In the supplementary notes to their article , They think this situation “ Not good for Science , Because those who do the most in public data are the least likely to be recognized ”.Bethlehem and Seidlitz Think , The guidelines for signature come from including Nature Journals including , This is an obstacle , He also said that every author should contribute a lot , For example, data analysis or interpretation .《Nature》 Our news team is editorially independent of its publisher .
a Nature The spokesman responded that “ Editors and authors have seriously considered this issue in accordance with our signature policy ” also “ Because it's our data citation policy , All data sets are used appropriately ”.
A social epidemiologist who studies neurodevelopment at the University of California, San Francisco Kaja LeWinn say ,“ Final , These concerns can be traced back to how scientific research companies evaluate researchers ”. She said , Its stakeholders are incumbents , Including funders , Periodical , And research institutions , To reassess how brain science is properly recognized and rewarded , Especially when such large-scale research becomes more common .
版权声明
本文为[Lily's autumn]所创,转载请带上原文链接,感谢
https://yzsam.com/2022/04/202204230555126798.html
边栏推荐
- STM32__03—初识定时器
- Lock lock
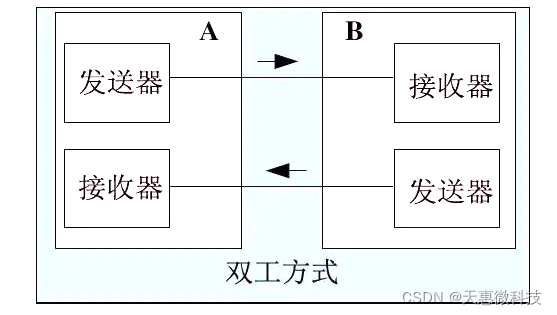
- Go language RPC communication
- Bytevcharts visual chart library, I have everything you want
- MySQL modify master database
- 无线鹅颈麦主播麦手持麦无线麦克风方案应当如何选择
- True math problems in 1959 college entrance examination
- Read a blog, re understand closures and tidy up
- Detailed explanation of file operation (2)
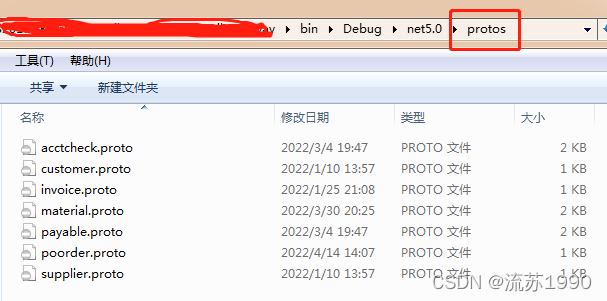
- Smart doc + Torna generate interface document
猜你喜欢
VLAN advanced technology, VLAN aggregation, super VLAN, sub VLAN
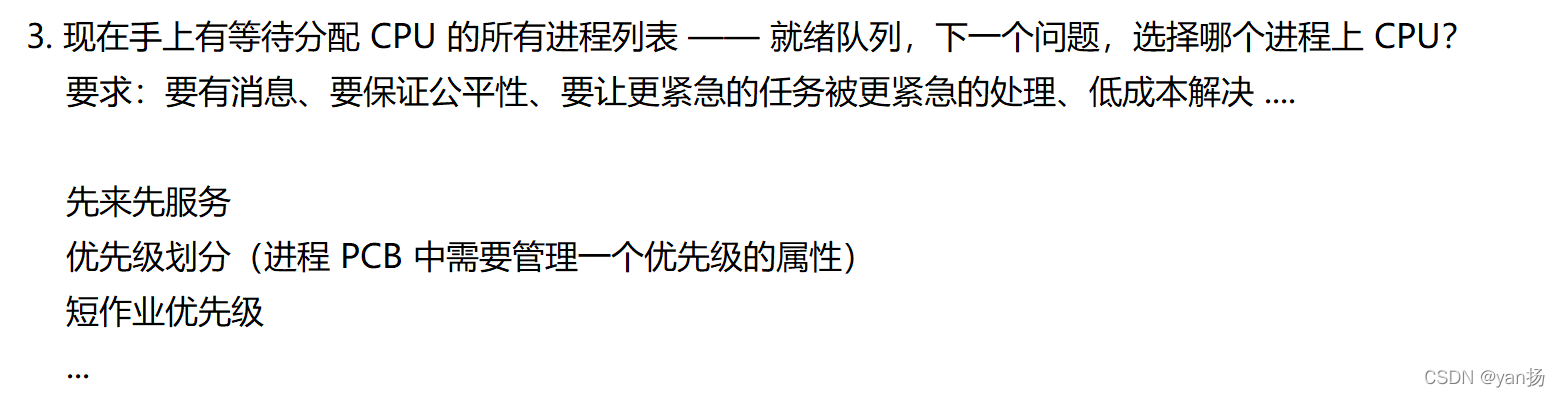
面试百分百问到的进程,你究竟了解多少
VLAN高级技术,VLAN聚合,超级Super VLAN ,Sub VLAN
1959年高考数学真题
Grpc gateway based on Ocelot
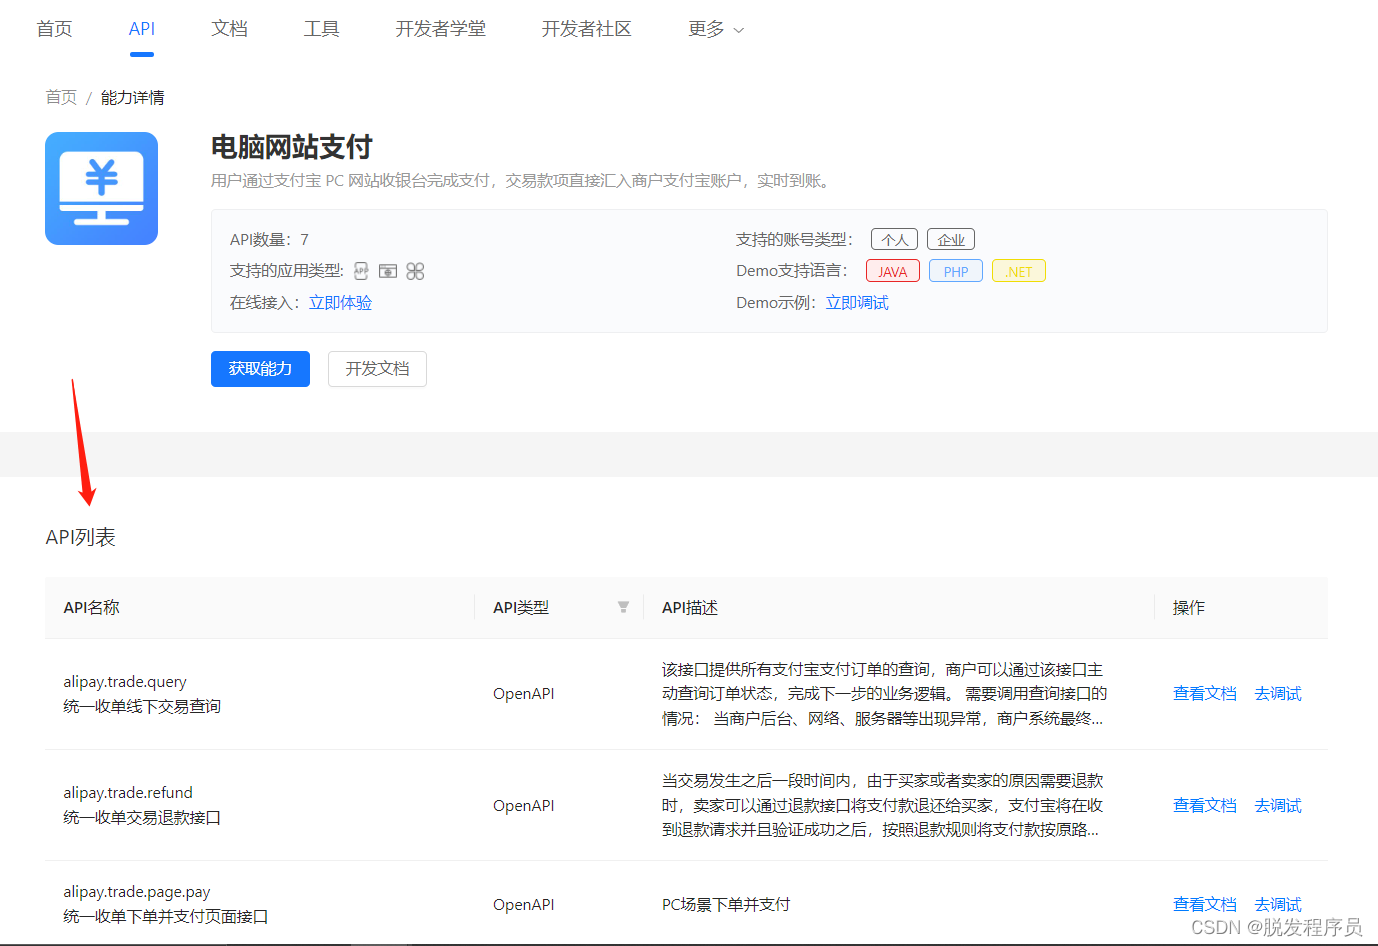
Node access to Alipay open platform sandbox to achieve payment function
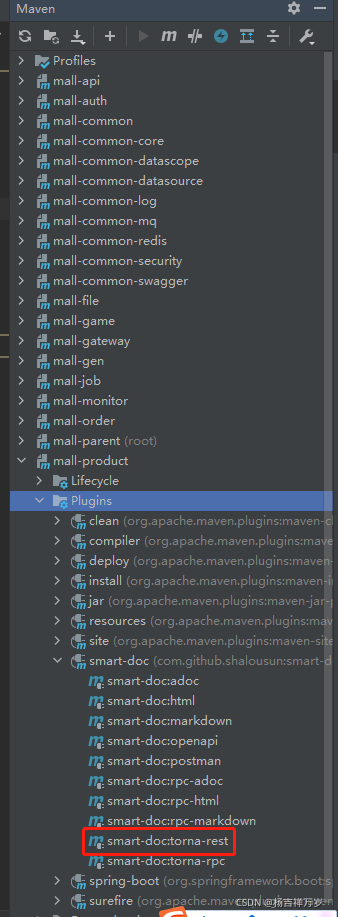
Smart doc + Torna generate interface document
昆腾全双工数字无线收发芯片KT1605/KT1606/KT1607/KT1608适用对讲机方案
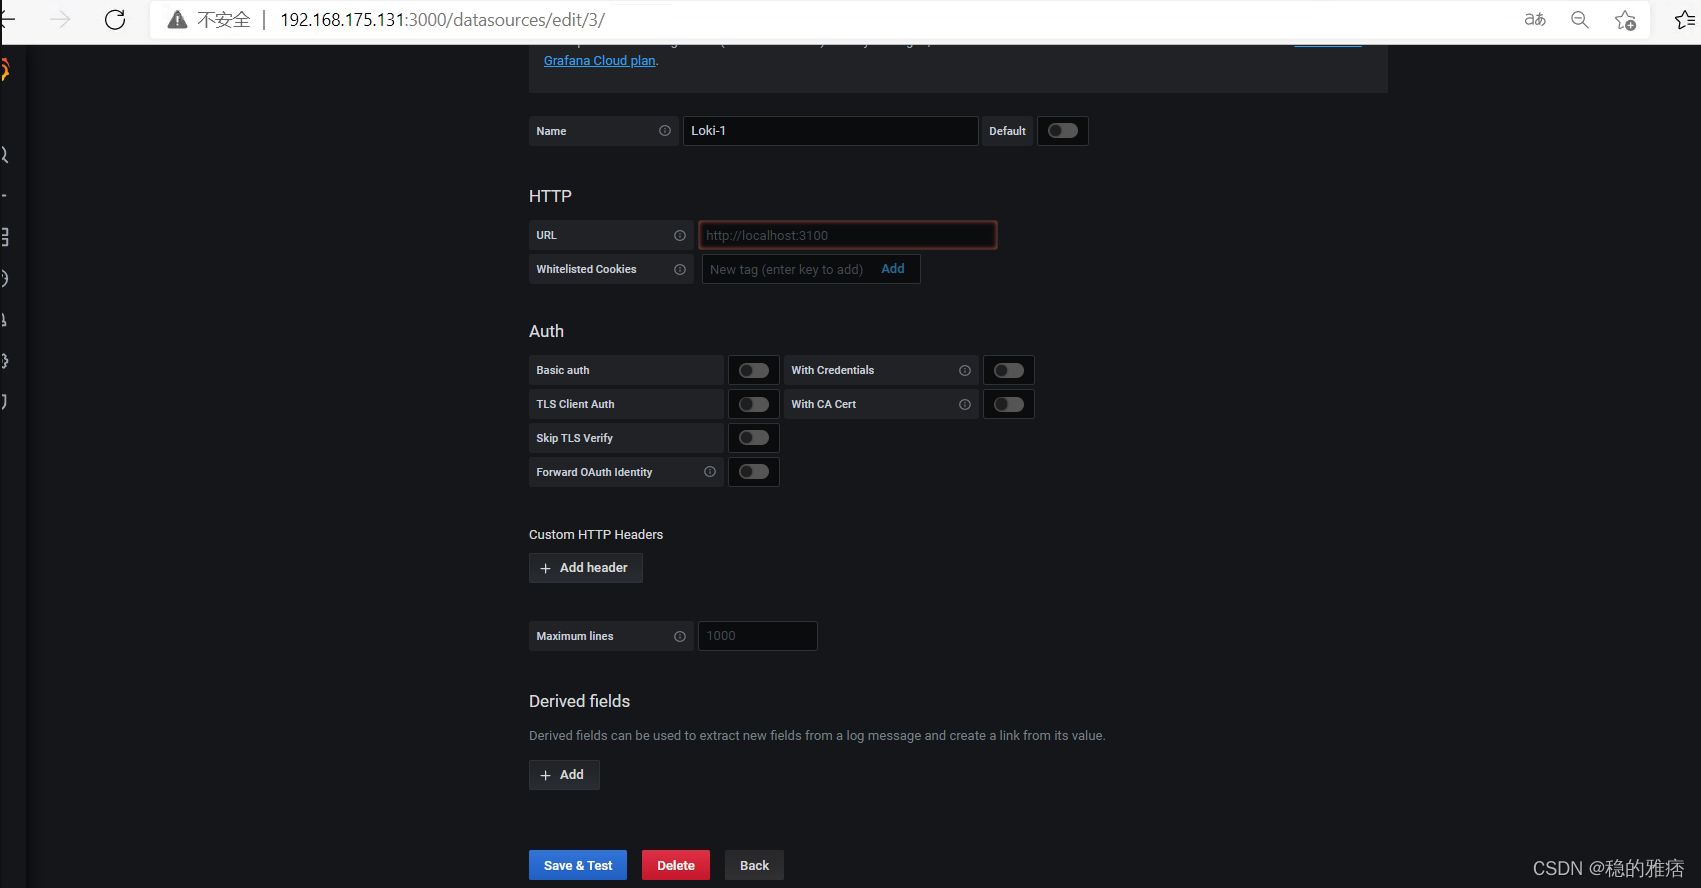
Construction of promtail + Loki + grafana log monitoring system

Document operation II (5000 word summary)
随机推荐
Go language, array, string, slice
VLAN高级技术,VLAN聚合,超级Super VLAN ,Sub VLAN
PHP efficiently reads large files and processes data
Node access to Alipay open platform sandbox to achieve payment function
Calculate pie chart percentage
websocket
Zhongang Mining: Fluorite Flotation Process
Bytevcharts visual chart library, I have everything you want
Sub database and sub table & shardingsphere
Paging SQL
Deepinv20 installation MariaDB
Nifi fast installation and file synchronization
PostgreSQL column storage and row storage
博士申请 | 厦门大学信息学院郭诗辉老师团队招收全奖博士/博后/实习生
Idea of batch manufacturing test data, with source code
网络安全之渗透靶场实战详解
How much do you know about the process of the interview
Grpc gateway based on Ocelot
PHP高效读大文件处理数据
STM32__03—初识定时器