LabGraph is a a Python-first framework used to build sophisticated research systems with real-time streaming, graph API, and parallelism.

Overview

labgraph-interactive

LabGraph Interactive

Learning LabGraph online.

What is LabGraph?

LabGraph is a a Python-first framework used to build sophisticated research systems with real-time streaming, graph API, and parallelism. Facebook Researchers use it prototype wearable hardware systems and process digital signals under their VR/AR efforts into the Metaverse.

To put it simply, LabGraph sets the relationship between the inputs and outputs of computations and provides the needed tooling to run them in parallel to help developers focus on algorithms instead of the environment.

What is LabGraph Interactive?

As MLH Fellows who have not used LabGraph before, we had a hard time understanding its purpose, how to set it up correctly, and what to expect from the library. So we decided to help future MLH Fellows get up to speed both on concepts and usage with an interactive tool.

We built the interactive tool to let users get the taste of LabGraph with zero commitments. The interactive terminal lets the users run simulations we prepared with different numbers of features and see their expected outputs.

How to Use LabGraph Interactive?

  1. Navigate to the website hosted on GitHub Pages at mlh-fellowship.github.io/labgraph-interactive
  2. Type help into the terminal
  3. Run the commands you would like to try out
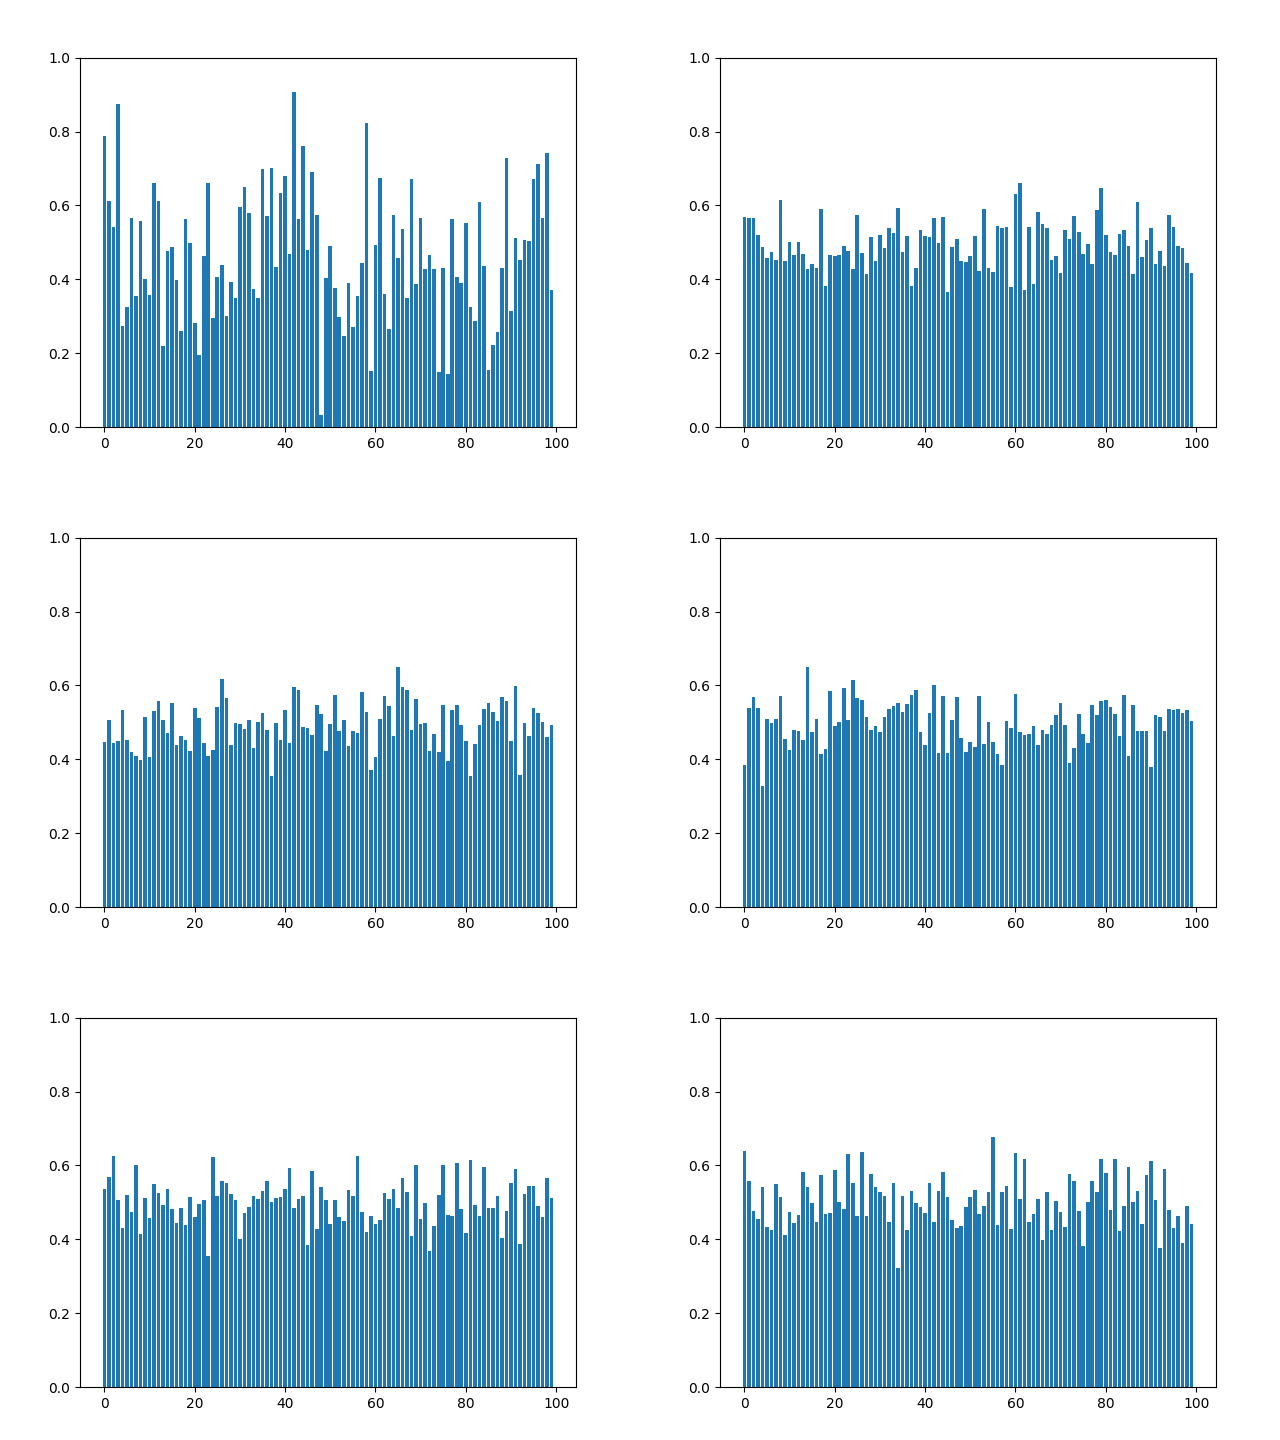
  4. Check the resulted graph built with random data

How to Use LabGraph?

To run LabGraph simulations on your machine, follow steps listed below:

  1. Run pip install labgraph to install LabGraph along with its dependecieis
  2. Run python setup.py install to work with the simulation we prepared and listed under random_labgraph/simulation.py
  3. Run python random_labgraph/simulation.py 100 to get a graph produced with LabGraph's node in real-time

License

This project is served unded the MIT License.

MIT License

Copyright (c) 2022 MLH Fellowship

Permission is hereby granted, free of charge, to any person obtaining a copy
of this software and associated documentation files (the "Software"), to deal
in the Software without restriction, including without limitation the rights
to use, copy, modify, merge, publish, distribute, sublicense, and/or sell
copies of the Software, and to permit persons to whom the Software is
furnished to do so, subject to the following conditions:

The above copyright notice and this permission notice shall be included in all
copies or substantial portions of the Software.

THE SOFTWARE IS PROVIDED "AS IS", WITHOUT WARRANTY OF ANY KIND, EXPRESS OR
IMPLIED, INCLUDING BUT NOT LIMITED TO THE WARRANTIES OF MERCHANTABILITY,
FITNESS FOR A PARTICULAR PURPOSE AND NONINFRINGEMENT. IN NO EVENT SHALL THE
AUTHORS OR COPYRIGHT HOLDERS BE LIABLE FOR ANY CLAIM, DAMAGES OR OTHER
LIABILITY, WHETHER IN AN ACTION OF CONTRACT, TORT OR OTHERWISE, ARISING FROM,
OUT OF OR IN CONNECTION WITH THE SOFTWARE OR THE USE OR OTHER DEALINGS IN THE
SOFTWARE.
Owner
MLH Fellowship
An internship alternative for software engineers, by Major League Hacking
MLH Fellowship
Data-FX is an addon for Blender (2.9) that allows for the visualization of data with different charts

Data-FX Data-FX is an addon for Blender (2.9) that allows for the visualization of data with different charts Currently, there are only 2 chart option

Landon Ferguson 20 Nov 21, 2022
An open-source plotting library for statistical data.

Lets-Plot Lets-Plot is an open-source plotting library for statistical data. It is implemented using the Kotlin programming language. The design of Le

JetBrains 820 Jan 06, 2023
Investment and risk technologies maintained by Fortitudo Technologies.

Fortitudo Technologies Open Source This package allows you to freely explore open-source implementations of some of our fundamental technologies under

Fortitudo Technologies 11 Dec 14, 2022
An intuitive library to add plotting functionality to scikit-learn objects.

Welcome to Scikit-plot Single line functions for detailed visualizations The quickest and easiest way to go from analysis... ...to this. Scikit-plot i

Reiichiro Nakano 2.3k Dec 31, 2022
A program that analyzes data from inertia measurement units installed in aircraft and generates g-exceedance curves.

A program that analyzes data from inertia measurement units installed in aircraft and generates g-exceedance curves.

Pooya 1 Dec 02, 2021
In-memory Graph Database and Knowledge Graph with Natural Language Interface, compatible with Pandas

CogniPy for Pandas - In-memory Graph Database and Knowledge Graph with Natural Language Interface Whats in the box Reasoning, exploration of RDF/OWL,

Cognitum Octopus 34 Dec 13, 2022
Numerical methods for ordinary differential equations: Euler, Improved Euler, Runge-Kutta.

Numerical methods Numerical methods for ordinary differential equations are methods used to find numerical approximations to the solutions of ordinary

Aleksey Korshuk 5 Apr 29, 2022
Visualize the training curve from the *.csv file (tensorboard format).

Training-Curve-Vis Visualize the training curve from the *.csv file (tensorboard format). Feature Custom labels Curve smoothing Support for multiple c

Luckky 7 Feb 23, 2022
:small_red_triangle: Ternary plotting library for python with matplotlib

python-ternary This is a plotting library for use with matplotlib to make ternary plots plots in the two dimensional simplex projected onto a two dime

Marc 611 Dec 29, 2022
Displaying plot of death rates from past years in Poland. Data source from these years is in readme

Average-Death-Rate Displaying plot of death rates from past years in Poland The goal collect the data from a CSV file count the ADR (Average Death Rat

Oliwier Szymański 0 Sep 12, 2021
basemap - Plot on map projections (with coastlines and political boundaries) using matplotlib.

Basemap Plot on map projections (with coastlines and political boundaries) using matplotlib. ⚠️ Warning: this package is being deprecated in favour of

Matplotlib Developers 706 Dec 28, 2022
IPython/Jupyter notebook module for Vega and Vega-Lite

IPython Vega IPython/Jupyter notebook module for Vega 5, and Vega-Lite 4. Notebooks with embedded visualizations can be viewed on GitHub and nbviewer.

Vega 335 Nov 29, 2022
script to generate HeN ipfs app exports of GLSL shaders

HeNerator A simple script to generate HeN ipfs app exports from any frag shader created with: GlslViewer GlslEditor The Book of Shaders glslCanvas VS

Patricio Gonzalez Vivo 22 Dec 21, 2022
Seismic Waveform Inversion Toolbox-1.0

Seismic Waveform Inversion Toolbox (SWIT-1.0)

Haipeng Li 98 Dec 29, 2022
Practical-statistics-for-data-scientists - Code repository for O'Reilly book

Code repository Practical Statistics for Data Scientists: 50+ Essential Concepts Using R and Python by Peter Bruce, Andrew Bruce, and Peter Gedeck Pub

1.7k Jan 04, 2023
Realtime Viewer Mandelbrot set with Python and Taichi (cpu, opengl, cuda, vulkan, metal)

Mandelbrot-set-Realtime-Viewer- Realtime Viewer Mandelbrot set with Python and Taichi (cpu, opengl, cuda, vulkan, metal) Control: "WASD" - movement, "

22 Oct 31, 2022
A simple code for plotting figure, colorbar, and cropping with python

Python Plotting Tools This repository provides a python code to generate figures (e.g., curves and barcharts) that can be used in the paper to show th

Guanying Chen 134 Jan 02, 2023
Generate visualizations of GitHub user and repository statistics using GitHub Actions.

GitHub Stats Visualization Generate visualizations of GitHub user and repository statistics using GitHub Actions. This project is currently a work-in-

Aditya Thakekar 1 Jan 11, 2022
Machine learning beginner to Kaggle competitor in 30 days. Non-coders welcome. The program starts Monday, August 2, and lasts four weeks. It's designed for people who want to learn machine learning.

30-Days-of-ML-Kaggle 🔥 About the Hands On Program 💻 Machine learning beginner → Kaggle competitor in 30 days. Non-coders welcome The program starts

Roja Achary 145 Jan 01, 2023
An animation engine for explanatory math videos

Powered By: An animation engine for explanatory math videos Hi there, I'm Zheer 👋 I'm a Software Engineer and student!! 🌱 I’m currently learning eve

Zaheer ud Din Faiz 2 Nov 04, 2021