`charts.css.py` brings `charts.css` to Python. Online documentation and samples is available at the link below.

Overview

charts.css.py

charts.css.py provides a python API to convert your 2-dimension data lists into html snippet, which will be rendered into charts by CSS, when serving inside a browser.

  • The output of charts.css.py is not images. Consequently, charts.css.py is a pure Python package without any image library dependency. You can use charts.css.py on any platform.
  • The output of charts.css.py is a normal HTML table. Search engines and screen readers will be able to consume your data even when CSS rendering is unavailable.
  • Once the html snippet is delivered into the browser window, the rendering is done by CSS, which is typically faster than JS-heavy chart libraries.
  • Since the output is normal HTML, you could customize its size and position, by defining your own CSS styles.

Installation

pip install charts.css.py

Usage

Just combine the output of charts.css.py functions and the predefined CSS style <link rel="stylesheet" href="https://cdn.jsdelivr.net/npm/charts.css/dist/charts.min.css"> into your html page.

For example, the following code snippet can convert a 2-dimension list into column chart:

from charts.css import column
STYLESHEET = '<link rel="stylesheet" href="https://cdn.jsdelivr.net/npm/charts.css/dist/charts.min.css">'
chart = column(
    [
        ["Continent", "1st year", "2nd year", "3rd year", "4th year", "5th year"],
        ["Asia", 20.0, 30.0, 40.0, 50.0, 75.0],
        ["Euro", 40.0, 60.0, 75.0, 90.0, 100.0],
    ],
    headers_in_first_row=True,
    headers_in_first_column=True,
    )
# Now, variable chart contains html snippet of "<table>...</table>", and
# STYLESHEET is just a constant string of "<link href='https://.../charts.css'>".
# You can somehow insert them into the proper places of your full html page.
# Here in this sample, we take a shortcut by simply concatenating them.
open("output.html", "w").write(STYLESHEET + chart)

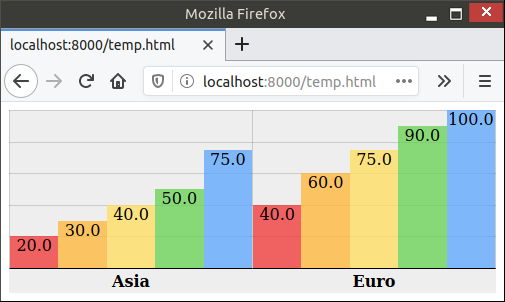
The output.html will be rendered in browser like this:

Sample output

Advanced Usage

There are currently 4 different charts implemented: bar, column, line, area. All those methods support many parameters to further customize the chart appearance. bar() and column() also support stacking by value or stacking by percentage. All those features are demonstrated in the different samples in this document.

Lastly, this package also provides a command-line tool csv2chart. You can use it to convert csv file into an html file. For example, csv2chart sample.csv output.html. You can also run csv2chart -h to know all the parameters it supports.

Versioning

charts.css.py uses Semantic Versioning.
You might also like...
🐞 📊 Ladybug extension to generate 2D charts

ladybug-charts Ladybug extension to generate 2D charts. Installation pip install ladybug-charts QuickStart import ladybug_charts API Documentation Loc

GitHub English Top Charts

Help you discover excellent English projects and get rid of the interference of other spoken language.

Data-FX is an addon for Blender (2.9) that allows for the visualization of data with different charts

Data-FX Data-FX is an addon for Blender (2.9) that allows for the visualization of data with different charts Currently, there are only 2 chart option

Glue is a python project to link visualizations of scientific datasets across many files.

Glue Glue is a python project to link visualizations of scientific datasets across many files. Click on the image for a quick demo: Features Interacti

Flipper Zero documentation repo

Flipper Zero Docs Participation To fix a bug or add something new to this repository, you need to open a pull-request. Also, on every page of the site

A tool for automatically generating 3D printable STLs from freely available lidar scan data.

mini-map-maker A tool for automatically generating 3D printable STLs from freely available lidar scan data. Screenshots Tutorial To use this script, g

A Python Binder that merge 2 files with any extension by creating a new python file and compiling it to exe which runs both payloads.

Update ! ANONFILE MIGHT NOT WORK ! About A Python Binder that merge 2 files with any extension by creating a new python file and compiling it to exe w

Debugging, monitoring and visualization for Python Machine Learning and Data Science

Welcome to TensorWatch TensorWatch is a debugging and visualization tool designed for data science, deep learning and reinforcement learning from Micr

Python module for drawing and rendering beautiful atoms and molecules using Blender.

Batoms is a Python package for editing and rendering atoms and molecules objects using blender. A Python interface that allows for automating workflows.

Comments
  • charts.css.py 0.4.0

    charts.css.py 0.4.0

    This release adds some helper and parameters to help you fine tune the chart appearance. They are especially useful when you attempt to render some csv data input with many rows.

    • Feature: A transpose(...) helper to flip your input data diagonally so that it swaps its x-axis and y-axis.
    • Feature: New parameter hide_label. It is useful when primary axis contains too many rows.
    • Feature: New parameter tooltip_builder which has a shape of lambda value="...", label="...": "...".
    • Feature: New parameter value_converter which typically will be assigned with either int or float.
    • Change: By default, data axes will no longer be shown. You can turn it back on by the new show_data_axes parameter.

    The online documentation will be updated to demonstrate these new features.

    opened by rayluo 0
  • Release 0.3.0

    Release 0.3.0

    • Line chart should not accept non-zero data_spacing or datasets_spacing. Now it would rightfully reject such an input.
    • Provide an online document/sample
    • Backport to Brython 3.7 and 3.8. The recommended Brython version is still its latest version, currently 3.9.
    opened by rayluo 0
  • charts.css.py 0.1.0

    charts.css.py 0.1.0

    The first release contains:

    • Basic functionality including bar, column, line and area
    • An experimental helper wrapper
    • Barely enough documentation in README.md
    • Also comes with a command-line tool csv2chart. I use it for my ad-hoc test. Let me know if you find it useful.
    opened by rayluo 0
Releases(0.4.0)
  • 0.4.0(Jun 27, 2021)

    This release adds some helper and parameters to help you fine tune the chart appearance. They are especially useful when you attempt to render some csv data input with many rows.

    • Feature: A transpose(...) helper to flip your input data diagonally so that it swaps its x-axis and y-axis.
    • Feature: New parameter value_converter which typically will be assigned with either int or float. With its help, now you can consume data directly from csv by data = list(csv.reader(f)).
    • Feature: New parameter hide_label. It is useful when primary axis contains too many rows.
    • Feature: New parameter tooltip_builder which has a shape of lambda value="...", label="...": "...".
    • Change: By default, data axes will no longer be shown. You can turn it back on by the new show_data_axes parameter.

    The online documentation ~will be~ has been updated to demonstrate these new features.

    Source code(tar.gz)
    Source code(zip)
    charts.css.py-brython.js(8.11 KB)
  • 0.3.0(May 23, 2021)

    • Line chart should not accept non-zero data_spacing or datasets_spacing. Now it would rightfully reject such an input.
    • Provide an online document/sample
    • Backport to Brython 3.7 and 3.8. The recommended Brython version is still its latest version, currently 3.9.
    • Also hosted as a Brython package which can be used by <script src="https://github.com/rayluo/charts.css.py/releases/download/0.3.0/charts.css.py-brython.js"></script>. Requires Brython 3.7.5 or above.
    Source code(tar.gz)
    Source code(zip)
    charts.css.py-brython.js(7.20 KB)
  • 0.2.0(May 17, 2021)

  • 0.1.0(May 14, 2021)

    The first release contains:

    • Basic functionality including bar, column, line and area
    • An experimental helper wrapper
    • Barely enough documentation in README.md
    • Also comes with a command-line tool csv2chart. I use it for my ad-hoc test. Let me know if you find it useful.
    Source code(tar.gz)
    Source code(zip)
Info for The Great DataTas plot-a-thon

The Great DataTas plot-a-thon Datatas is organising a Data Visualisation competition: The Great DataTas plot-a-thon We will be using Tidy Tuesday data

2 Nov 21, 2021
Visualization of the World Religion Data dataset by Correlates of War Project.

World Religion Data Visualization Visualization of the World Religion Data dataset by Correlates of War Project. Mostly personal project to famirializ

Emile Bangma 1 Oct 15, 2022
JupyterHub extension for ContainDS Dashboards

ContainDS Dashboards for JupyterHub A Dashboard publishing solution for Data Science teams to share results with decision makers. Run a private on-pre

Ideonate 179 Nov 29, 2022
Visualization ideas for data science

Nuance I use Nuance to curate varied visualization thoughts during my data scientist career. It is not yet a package but a list of small ideas. Welcom

Li Jiangchun 16 Nov 03, 2022
Standardized plots and visualizations in Python

Standardized plots and visualizations in Python pltviz is a Python package for standardized visualization. Routine and novel plotting approaches are f

Andrew Tavis McAllister 0 Jul 09, 2022
🐞 📊 Ladybug extension to generate 2D charts

ladybug-charts Ladybug extension to generate 2D charts. Installation pip install ladybug-charts QuickStart import ladybug_charts API Documentation Loc

Ladybug Tools 3 Dec 30, 2022
simple tool to paint axis x and y

simple tool to paint axis x and y

G705 1 Oct 21, 2021
An interactive dashboard built with python that enables you to visualise how rent prices differ across Sweden.

sweden-rent-dashboard An interactive dashboard built with python that enables you to visualise how rent prices differ across Sweden. The dashboard/web

Rory Crean 5 Dec 19, 2021
A curated list of awesome Dash (plotly) resources

Awesome Dash A curated list of awesome Dash (plotly) resources Dash is a productive Python framework for building web applications. Written on top of

Luke Singham 1.7k Jan 07, 2023
The repository is my code for various types of data visualization cases based on the Matplotlib library.

ScienceGallery The repository is my code for various types of data visualization cases based on the Matplotlib library. It summarizes the code and cas

Warrick Xu 2 Apr 20, 2022
This tool is designed to help administrators get an overview of their Active Directory structure.

This tool is designed to help administrators get an overview of their Active Directory structure. In the group view you can see all elements of an AD (OU, USER, GROUPS, COMPUTERS etc.). In the user v

deexno 2 Oct 30, 2022
Simulation du problème de Monty Hall avec Python et matplotlib

Le problème de Monty Hall C'est un jeu télévisé où il y a trois portes sur le plateau de jeu. Seule une de ces portes cache un trésor. Il n'y a rien d

ETCHART YANG 1 Jan 06, 2022
Parse Robinhood 1099 Tax Document from PDF into CSV

Robinhood 1099 Parser This project converts Robinhood Securities 1099 tax document from PDF to CSV file. This tool will be helpful for those who need

Keun Tae (Kevin) Park 52 Jun 10, 2022
Pyan3 - Offline call graph generator for Python 3

Pyan takes one or more Python source files, performs a (rather superficial) static analysis, and constructs a directed graph of the objects in the combined source, and how they define or use each oth

Juha Jeronen 235 Jan 02, 2023
Using SQLite within Python to create database and analyze Starcraft 2 units data (Pandas also used)

SQLite python Starcraft 2 English This project shows the usage of SQLite with python. To create, modify and communicate with the SQLite database from

1 Dec 30, 2021
A package for plotting maps in R with ggplot2

Attention! Google has recently changed its API requirements, and ggmap users are now required to register with Google. From a user’s perspective, ther

David Kahle 719 Jan 04, 2023
A concise grammar of interactive graphics, built on Vega.

Vega-Lite Vega-Lite provides a higher-level grammar for visual analysis that generates complete Vega specifications. You can find more details, docume

Vega 4k Jan 08, 2023
This repository contains a streaming Dataflow pipeline written in Python with Apache Beam, reading data from PubSub.

Sample streaming Dataflow pipeline written in Python This repository contains a streaming Dataflow pipeline written in Python with Apache Beam, readin

Israel Herraiz 9 Mar 18, 2022
A Jupyter - Leaflet.js bridge

ipyleaflet A Jupyter / Leaflet bridge enabling interactive maps in the Jupyter notebook. Usage Selecting a basemap for a leaflet map: Loading a geojso

Jupyter Widgets 1.3k Dec 27, 2022
Print matplotlib colors

mplcolors Tired of searching "matplotlib colors" every week/day/hour? This simple script displays them all conveniently right in your terminal emulato

Brandon Barker 32 Dec 13, 2022