当前位置:网站首页>SPC introduction
SPC introduction
2022-04-23 16:53:00 【Tassel 1990】
SPC brief introduction
Statistical process control (Statistical Process Control) It is a process control tool with the help of mathematical statistics . It analyzes and evaluates the production process , According to the feedback information, timely find the signs of systemic factors , And take measures to eliminate its impact , Maintain the process in a controlled state only affected by random factors , To achieve the purpose of quality control .
Technical principle
Use statistical methods to monitor the status of the process , Make sure the production process is under control , To reduce the variation of product quality . It thinks , When the process is only affected by random factors , The process is under statistical control ( Controlled state for short ); When there are systematic factors in the process , The process is statistically out of control ( Out of control ). Because the process fluctuation has statistical regularity , When the process is under control , The process characteristics generally obey the stable random distribution ; And out of control , The process distribution will change .SPC It is the statistical regularity of process fluctuation that is used to analyze and control the process . thus , It emphasizes that the process runs in a controlled and capable state , So that the products and services can stably meet the requirements of customers .
The implementation of SPC The process of is generally divided into two steps :
1、 use SPC Analyze the process , Such as drawing control chart for analysis, etc ; Take necessary measures according to the analysis results : It may be necessary to eliminate systemic factors in the process , It may also require management intervention to reduce the random fluctuation of the process to meet the needs of process capability .
2、 Monitor the process with control chart .
Control chart is a graphical method , It gives the information of the sample sequence representing the current state of the process , This information is compared with the control limit established after considering the inherent variation of the process . The control chart method is first used to help evaluate whether a process has reached 、 Or continue to maintain a state of statistical control with an appropriate specified level , Then used to help in the production process , By maintaining continuous product quality records , To obtain and maintain the control and high consistency of the characteristics of important products or services . Apply the control chart and carefully analyze the control chart . Can better understand and improve the process , That is to realize the SPC Process control .
According to the purpose of the control chart , Control charts can be divided into : Control chart for analysis and control chart for control . Depending on the type of Statistics , Control charts can be divided into : Metering control chart and counting control chart ( Including piece control chart and point control chart ). They are applicable to different production processes . Each class can be subdivided into specific control charts , Initially, there were mainly seven basic charts .
Metering control charts include :
* IX-MR( Single value moving range diagram )
* Xbar-R( Xbar-R Chart )
* ME-R( Median range chart )
* Xbar-s( Mean standard deviation plot )
The counting control chart includes :
* P( It is used for the rate of nonconforming products with variable sample cost )
* Np( Number of nonconforming products used for fixed sample size )
* U( Number of defects per unit used for variable sample cost )
* C( Number of defects for fixed sample size
版权声明
本文为[Tassel 1990]所创,转载请带上原文链接,感谢
https://yzsam.com/2022/04/202204231359253681.html
边栏推荐
- How magical is the unsafe class used by all major frameworks?
- Copy constructor shallow copy and deep copy
- ◰GL-阴影贴图核心步骤
- Disk management and file system
- Installing labellmg tutorial in Windows
- Introduction to how to set up LAN
- Execution plan calculation for different time types
- ByteVCharts可视化图表库,你想要的我都有
- MySQL master-slave replication
- Do you really understand the principle of code scanning login?
猜你喜欢
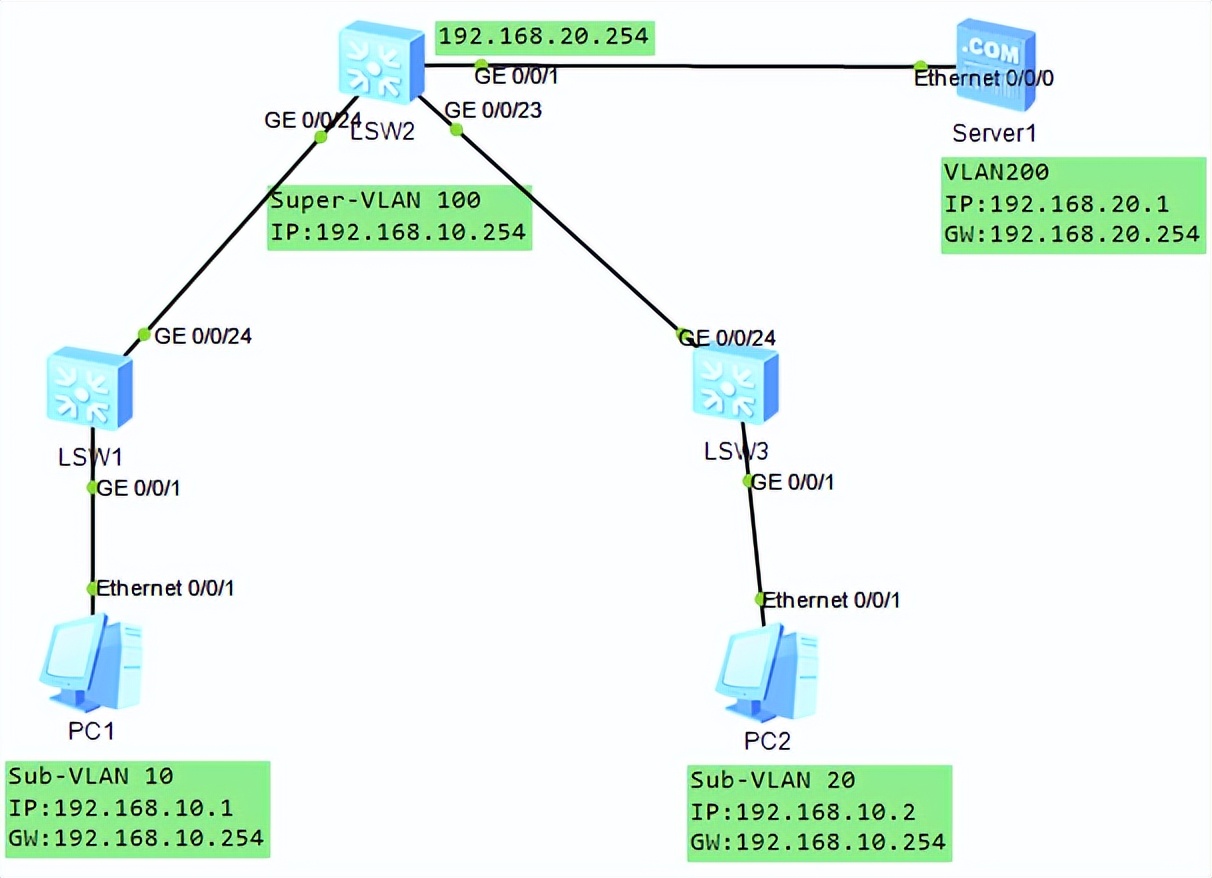
VLAN高级技术,VLAN聚合,超级Super VLAN ,Sub VLAN

无线鹅颈麦主播麦手持麦无线麦克风方案应当如何选择
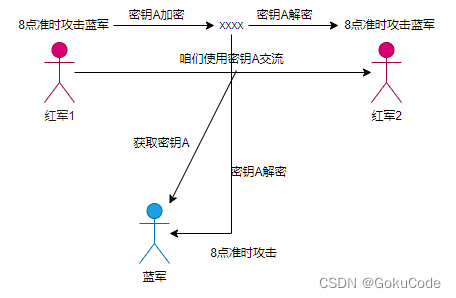
Detailed explanation of information abstract, digital signature, digital certificate, symmetric encryption and asymmetric encryption
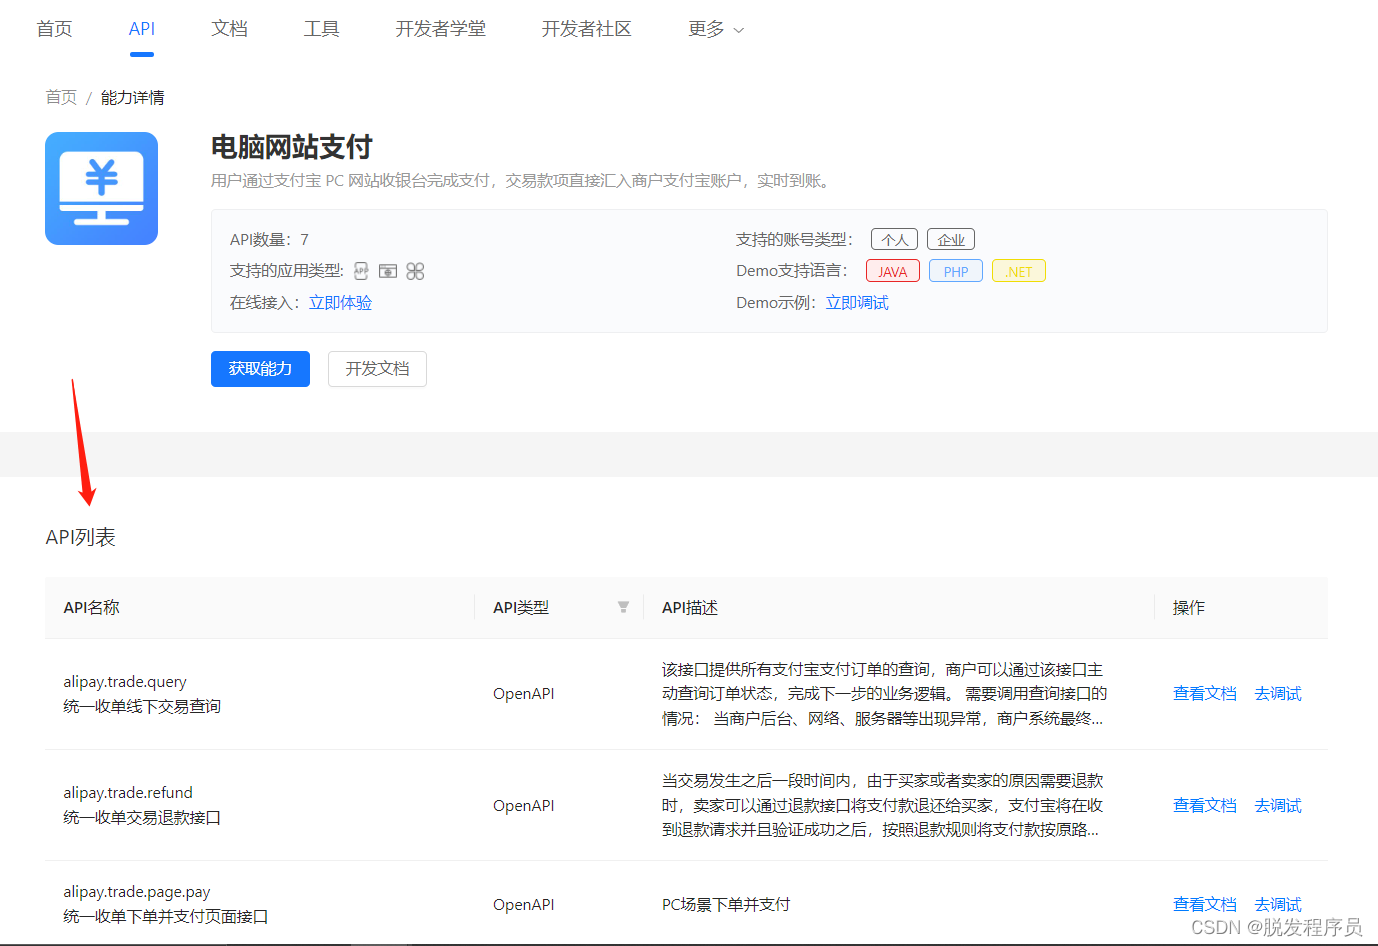
Node access to Alipay open platform sandbox to achieve payment function
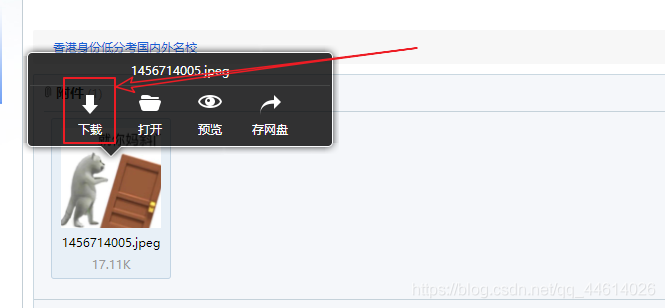
File upload and download of robot framework
JMeter installation tutorial and solutions to the problems I encountered

RTKLIB 2.4.3源码笔记
New project of OMNeT learning
True math problems in 1959 college entrance examination

Ali developed three sides, and the interviewer's set of combined punches made me confused on the spot
随机推荐
Ali developed three sides, and the interviewer's set of combined punches made me confused on the spot
扫码登录的原理你真的了解吗?
文件操作详解(2)
Solution of garbled code on idea console
TypeError: set_figure_params() got an unexpected keyword argument ‘figsize‘
Execution plan calculation for different time types
Derivation of Σ GL perspective projection matrix
PyMySQL
如何建立 TikTok用户信任并拉动粉丝增长
Deeply understand the relevant knowledge of 3D model (modeling, material mapping, UV, normal), and the difference between displacement mapping, bump mapping and normal mapping
Zhongang Mining: Fluorite Flotation Process
详解牛客----手套
Quick install mongodb
Disk management and file system
Website_ Collection
无线鹅颈麦主播麦手持麦无线麦克风方案应当如何选择
Rtklib 2.4.3 source code Notes
org. apache. parquet. schema. InvalidSchemaException: A group type can not be empty. Parquet does not su
Nifi fast installation and file synchronization
拷贝构造函数 浅拷贝与深拷贝