当前位置:网站首页>【无标题】
【无标题】
2022-08-10 04:22:00 【kyccom】
使用回归 (regression)进行预测
1.导入模块
!pip install seaborn
import pathlib
import matplotlib.pyplot as plt
import numpy as np
import pandas as pd
import seaborn as sns
import tensorflow as tf
from tensorflow import keras
from tensorflow.keras import layers
tf.__version__
2.下载数据集
dataset_path = keras.utils.get_file('auto-img.data', 'http://archive.ics.uci.edu/ml/machine-learning-databases/auto-mpg/auto-mpg.data')
dataset_path
运行后输出:
‘C:\Users\Administrator\.keras\datasets\auto-img.data’
查看一下数据集中的内容:
column_names = ['MPG','Cylinders','Displacement','Horsepowner','Weight','Acceleration', 'Model Year','Origin']
raw_dataset = pd.read_csv(dataset_path, names=column_names,
                         na_values='?', comment='\t',
                         sep=' ',skipinitialspace=True)
dataset = raw_dataset.copy()
dataset.tail()

3.数据清洗
查看一下有没有空值:
dataset.isna().sum()
输出结果:
MPG 0
Cylinders 0
Displacement 0
Horsepowner 6
Weight 0
Acceleration 0
Model Year 0
Origin 0
dtype: int64
不管有没有空值 ,去除一下:
dataset = dataset.dropna()
用pop 命令, 把origin列做拿出来,后续作为为独热编码:
origin = dataset.pop('Origin')
给表增加列:
dataset['USA'] = (origin == 1)*1.0
dataset['Europe'] = (origin == 2)*1.0
dataset['Japan'] = (origin == 3)*1.0
dataset.tail()
在这里插入图片描述
将数据集拆分为验证集与训练集
train_dataset = dataset.sample(frac=0.8, random_state=0)
test_dataset = dataset.drop(train_dataset.index)
用seaborn 查看一下情况
sns.pairplot(train_dataset[['MPG', 'Cylinders', 'Displacement', 'Weight']], diag_kind='kde')

看一下透视统计:
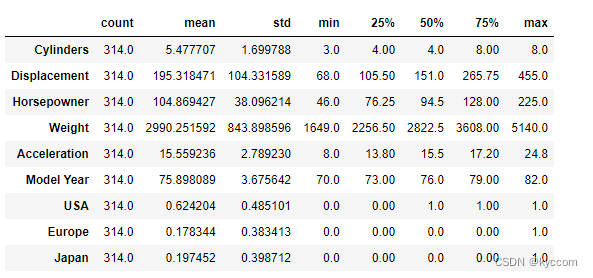
train_stats = train_dataset.describe()
train_stats.pop('MPG')
train_stats = train_stats.transpose()
train_stats
把标签分离出来
train_labels = train_dataset.pop('MPG')
test_labels = test_dataset.pop('MPG')
数据归一化(每个值减去均值后再除以标准差)
def norm(x):
    return (x - train_stats['mean'])/train_stats['std']
normed_train_data = norm(train_dataset)
normed_test_data = norm(test_dataset)
4.构建模型
def build_model():
    model = keras.Sequential([
        layers.Dense(64, activation='relu', input_shape=[len(train_dataset.keys())]),
        layers.Dense(64, activation='relu'),
        layers.Dense(1)
    ])
    optimizer = tf.keras.optimizers.RMSprop(0.001)
    model.compile(loss='mse',
                 optimizer=optimizer,
                 metrics=['mae', 'mse'])
    return model
model = build_model()
model.summary()
Model: “sequential_2”
Layer (type) Output Shape Param #
dense_3 (Dense) (None, 64) 640
dense_4 (Dense) (None, 64) 4160
dense_5 (Dense) (None, 1) 65
=================================================================
Total params: 4,865
Trainable params: 4,865
Non-trainable params: 0
测试一下预测:
example_batch = normed_train_data[:10]
example_result = model.predict(example_batch)
example_result
1/1 [==============================] - 0s 311ms/step
array([[ 0.1861527 ],
[-0.03714132],
[ 0.41865367],
[ 0.08125568],
[ 0.35935453],
[ 0.14658093],
[ 0.42246234],
[ 0.07202747],
[ 0.08832908],
[ 0.41105857]], dtype=float32)
5. 开始训练
class PrintDot(keras.callbacks.Callback):
    def on_epoch_end(self, epoch, logs):
        if epoch%100 ==0:print('')
        print('.', end='')
EPOCHS = 10000

history = model.fit(
normed_train_data, train_labels,
epochs=EPOCHS, validation_split=0.2, verbose=0,
callbacks=[PrintDot()])
来看一下模型中的参数
hist= pd.DataFrame(history.history)
hist['epoch'] = history.epoch
hist.tail()
6.图形化显示
def plot_history(history):
    hist = pd.DataFrame(history.history)
    hist['epoch'] = history.epoch

    plt.figure()
    plt.xlabel('Epoch')
    plt.ylabel('Mean Abs Error [MGP]')
    plt.plot(hist['epoch'], hist['mae'], label='Val Error')
    plt.plot(hist['epoch'], hist['val_mae'], label='Val Error')
    plt.ylim([0,5])
    plt.legend()

    plt.figure()
    plt.xlabel('Epoch')
    plt.ylabel('Mean Square Error [$MGP^2$]')
    plt.plot(hist['epoch'], hist['mse'], label='Train Error')
    plt.plot(hist['epoch'], hist['val_mse'], label='Val Error')
    plt.ylim([0,20])
    plt.legend()
    plt.show()
运行一下:
plot_history(history)

再优化一下
model = build_model()
early_stop = keras.callbacks.EarlyStopping(monitor='val_loss', patience=10)
history = model.fit(normed_train_data, train_labels, epochs=EPOCHS,
                   validation_split=0.2, verbose=0, callbacks= [early_stop, PrintDot()])
plot_history(history)

loss, mae, mse = model.evaluate(normed_test_data, test_labels, verbose=2)

print("Testing set Mean Abs Error: {:5.2f} MPG".format(mae))
3/3 - 0s - loss: 6.5743 - mae: 1.8934 - mse: 6.5743 - 37ms/epoch - 12ms/step
Testing set Mean Abs Error: 1.89 MPG
用测数据预测一下MPG
test_predictions = model.predict(normed_test_data).flatten()

plt.scatter(test_labels, test_predictions)
plt.xlabel('True Values [MPG]')
plt.ylabel('Predictions [MPG]')
plt.axis('equal')
plt.axis('square')
plt.xlim([0,plt.xlim()[1]])
plt.ylim([0,plt.ylim()[1]])
_ = plt.plot([-100, 100], [-100, 100])
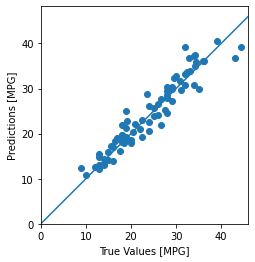
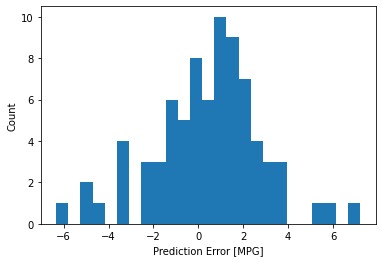
这看起来我们的模型预测得相当好。我们来看下误差分布。
error = test_predictions - test_labels
plt.hist(error, bins = 25)
plt.xlabel("Prediction Error [MPG]")
_ = plt.ylabel("Count")
边栏推荐
- 用.bat文件做Airtest脚本的多设备批量运行
- 【OpenCV图像处理5】图像的变换
- itoa和aoti函数的自我实现
- 音乐现场的未来将被NFT门票主宰?
- 【bug】尝试重新启动事Deadlock found when trying to get lock; try restarting transaction
- Pytorch中的torch.index_select对应MindSpore哪个方法
- PHPCMS仿站从入门到精通,小白看这一套课程就够了
- [Web3 Series Development Tutorial - Create Your First NFT (7)] Create an NFT DApp and assign attributes to your NFT, such as pictures
- Qt编写物联网管理平台50-超强跨平台
- Spark面试问题总结
猜你喜欢


随机推荐
125. 耍杂技的牛
释放高通量算力价值潜能 JASMINER持续领跑 Web3 市场
【OpenCV图像处理5】图像的变换
【网络迁移】Pytorch中的torch.is_tensor对应MindSpore哪个接口
LeetCode 2369. 检查数组是否存在有效划分 动态规划
PHPCMS仿站从入门到精通,小白看这一套课程就够了
From entry to mastery of PHPCMS imitation station, Xiaobai is enough to watch this set of courses
ZZULIOJ:1028: I love 闰年!
ZZULIOJ:1030: 判断直角三角形
qwt库的编译和使用
@Autowired注解 --required a single bean, but 2 were found出现的原因以及解决方法
结构体的内存对齐问题
2022年R2移动式压力容器充装考试题库模拟考试平台操作
ctf-pikachu-file_inclusion
若依系统前后台漏洞大全
2022年P气瓶充装操作证考试题库及模拟考试
2022年起重机械指挥操作证考试题库及模拟考试
798. 差分矩阵
2022年P气瓶充装操作证考试题库及模拟考试
基于 EasyCV 复现 DETR 和 DAB-DETR,Object Query 的正确打开方式