一:背景
Be ready to chat a series PerfView 这款工具,Familiar with all my friends know that I like to use WinDbg,Although this thing is stupid,但也不是万能的,There are also some scenarios that he can't solve or is difficult to solve,At this time, with the help of some other tools,is a very good idea.
Many friends like to monitor the flow of the project by recording logs in the project,其实 CoreCLR 也是这样的,参考如下代码:
void gc_heap::fix_allocation_context (alloc_context* acontext, BOOL for_gc_p,
                                      BOOL record_ac_p)
{
    dprintf (3, ("Fixing allocation context %Ix: ptr: %Ix, limit: %Ix",
                 (size_t)acontext,
                 (size_t)acontext->alloc_ptr, (size_t)acontext->alloc_limit));
}

void gc_heap::background_sweep()
{
    //concurrent_print_time_delta ("finished with mark and start with sweep");
    concurrent_print_time_delta ("Sw");
    dprintf (2, ("---- (GC%d)Background Sweep Phase ----", VolatileLoad(&settings.gc_index)));

    //block concurrent allocation for large objects
    dprintf (3, ("lh state: planning"));
}

void gc_heap::background_ephemeral_sweep()
{
    dprintf (3, ("bgc ephemeral sweep"));
}
So where do these logs go?,当然是 Windows 的 ETW 了,What tools are there for easy extraction?? PerfView It's one of those.
Let's do this one CPU How to find in a high-explosive scene 热点函数 的例子,看看如何用 PerfView 去挖.
二:PerfView Find hotspot functions
很多场景下的 CPU 高,It is because one or several threads are executing a method at high frequency,Possibly an endless loop,Possibly caughtCPUIntensive method,A good way to solve this problem is to CPU 进行采样,比如我的 12 核电脑.
0:000> !cpuid
CP  F/M/S  Manufacturer     MHz
 0  6,5,2                  2592
 1  6,5,2                  2592
 2  6,5,2                  2592
 3  6,5,2                  2592
 4  6,5,2                  2592
 5  6,5,2                  2592
 6  6,5,2                  2592
 7  6,5,2                  2592
 8  6,5,2                  2592
 9  6,5,2                  2592
10  6,5,2                  2592
11  6,5,2                  2592
1. 如何采样
The principle of sampling is to periodically look at the current CPU What methods are being executed by several threads running in the core, After sampling tens of thousands or hundreds of thousands of samples,These collected methods can be grouped and sorted to find topN,那些 TopN The method of natural is the cause CPU High possible triggers.
windbg 有一个 !running command can be used to display the running threads in the current processor.
lkd> !running

System Processors:  (0000000000000fff)
  Idle Processors:  (000000000000065e)

       Prcbs             Current         (pri) Next            (pri) Idle
  0    fffff80268a33180  ffffaf8ec9bd8080 (15)                       fffff8026b526600  ................
  5    ffffd900e1700180  ffffaf8eca36b080 ( 8)                       ffffd900e170b340  ................
  7    ffffd900e1900180  ffffaf8ec2f18080 ( 8)                       ffffd900e190b340  ................
  8    ffffd900e1a00180  ffffd900e1a0b340 ( 0)                       ffffd900e1a0b340  ................
 11    ffffd900e1d00180  ffffaf8eb6bee080 ( 8)                       ffffd900e1d0b340  ................
Next write a program,Let one of the threads loop infinitely,然后通过 PerfView go find this hot spot.
    internal class Program
    {
        static void Main(string[] args)
        {
            Task.Run(() => Test1());    //Test1 Deliberately infinite loop
            Task.Run(() => Test2());    //Test2 is a normal function

            Console.WriteLine("我是主线程!");
            Console.ReadLine();
        }

        static void Test1()
        {
            var i = 10;
            var b = true;

            while (i > 0)
            {
                b = !b;
            }
        }

        static void Test2()
        {
            for (int i = 0; i < 10000; i++)
            {
                var j = string.Join(",", Enumerable.Range(0, 100));
            }

            Console.WriteLine("Test执行结束");
        }
    }
2. 使用 PerfView 采样
点击菜单中的 Collect -> Collect ,弹出如下面板.
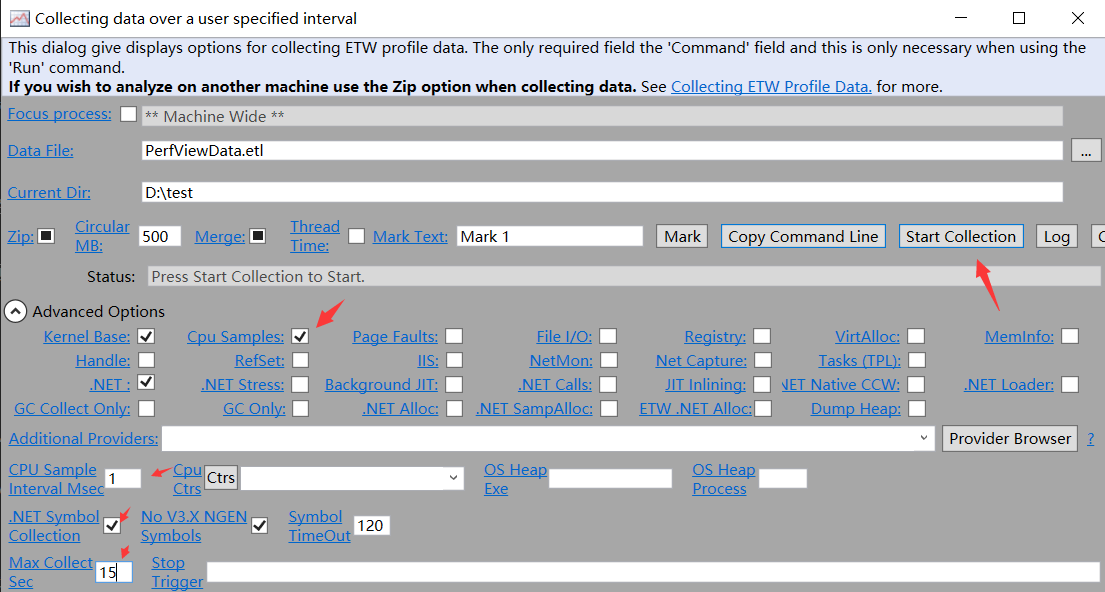
在这个面板中,选中如下几项.
1)CPU Samples:
设置对 CPU 进行采样.
2)CPU Sample Interval Msec
Set the sampling frequency to be 1ms/次.
3)Max Collect Sec
Set how many seconds to sample in total,这里设置为 15 秒.
4).NET Symbol Collection
Used to pull on the server from Microsoft symbol notation,Nothing to do with sampling.
The above is set to end,就可以点击 Start Collection 采集了,不出意外的话,15s Then you will see the following screenshot.
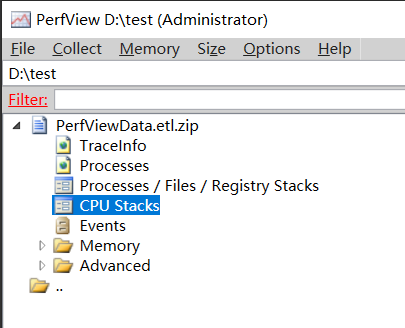
接下来点击 CPU Stacks,Select our 程序,Double click to open the following panel.
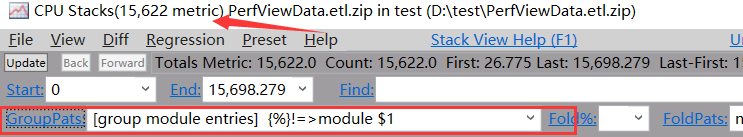
从图中可以看到,当前采样了 15622 个样本,符合 15 * 1000 ,接下来把上面的 GroupPats The default group is cleared,截图如下:
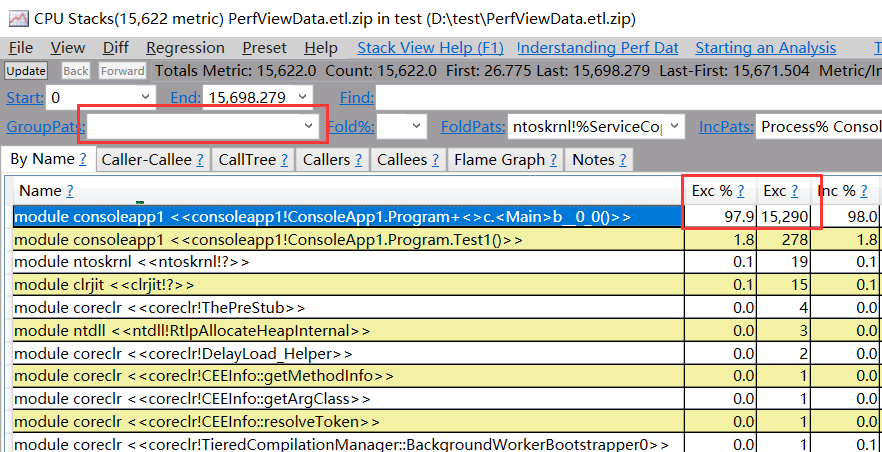
从图中可以看到当前 Test1() 方法在 15622 percentage of samples 97.9%,hits up to 15290 次,This is clearly an absolute 热点函数,The next step is to turn the source code why Test1 这么高频?
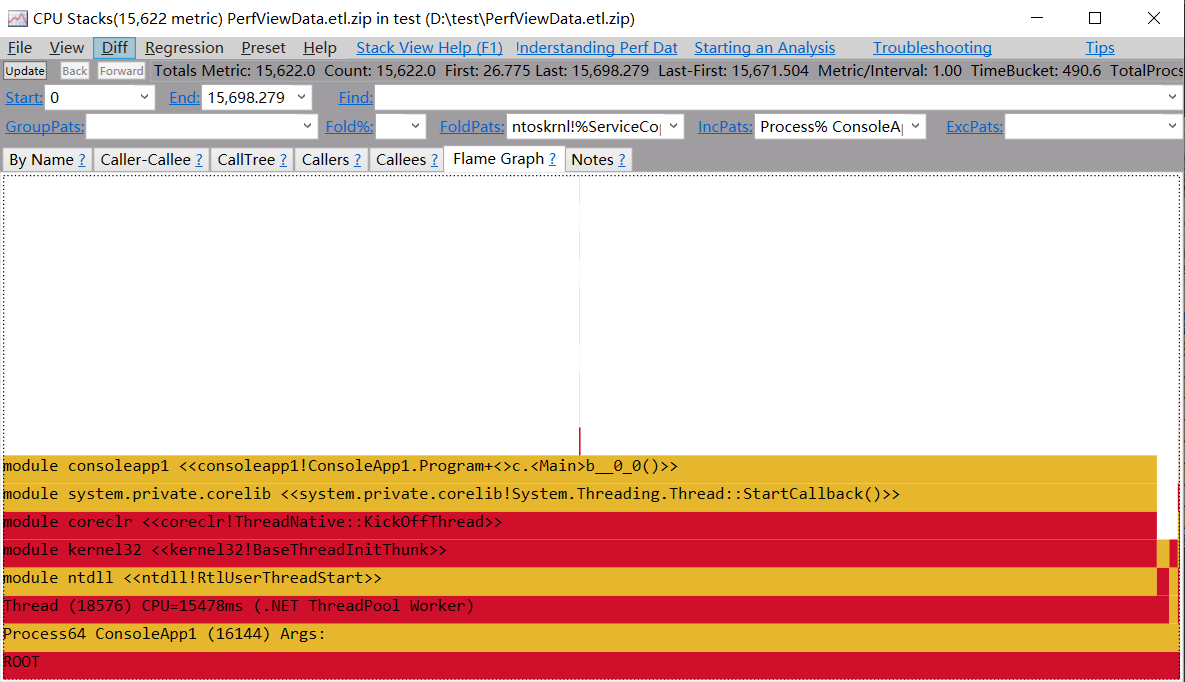
If you want to see chicken ribs 火焰图,可以点击 Flame Graph 列表项.
好了,Let's talk about this first.