Created a new ASP.NET Core 5.0 Web API project. When using breakpoints to debug Host.CreateDefaultBuilder(args), after entering the function, check the value of the intermediate variable and report the error Evaluation is not allowed: The threadis not at a GC-safe point.I asked in the group and no one responded. Maybe I haven't encountered this problem before.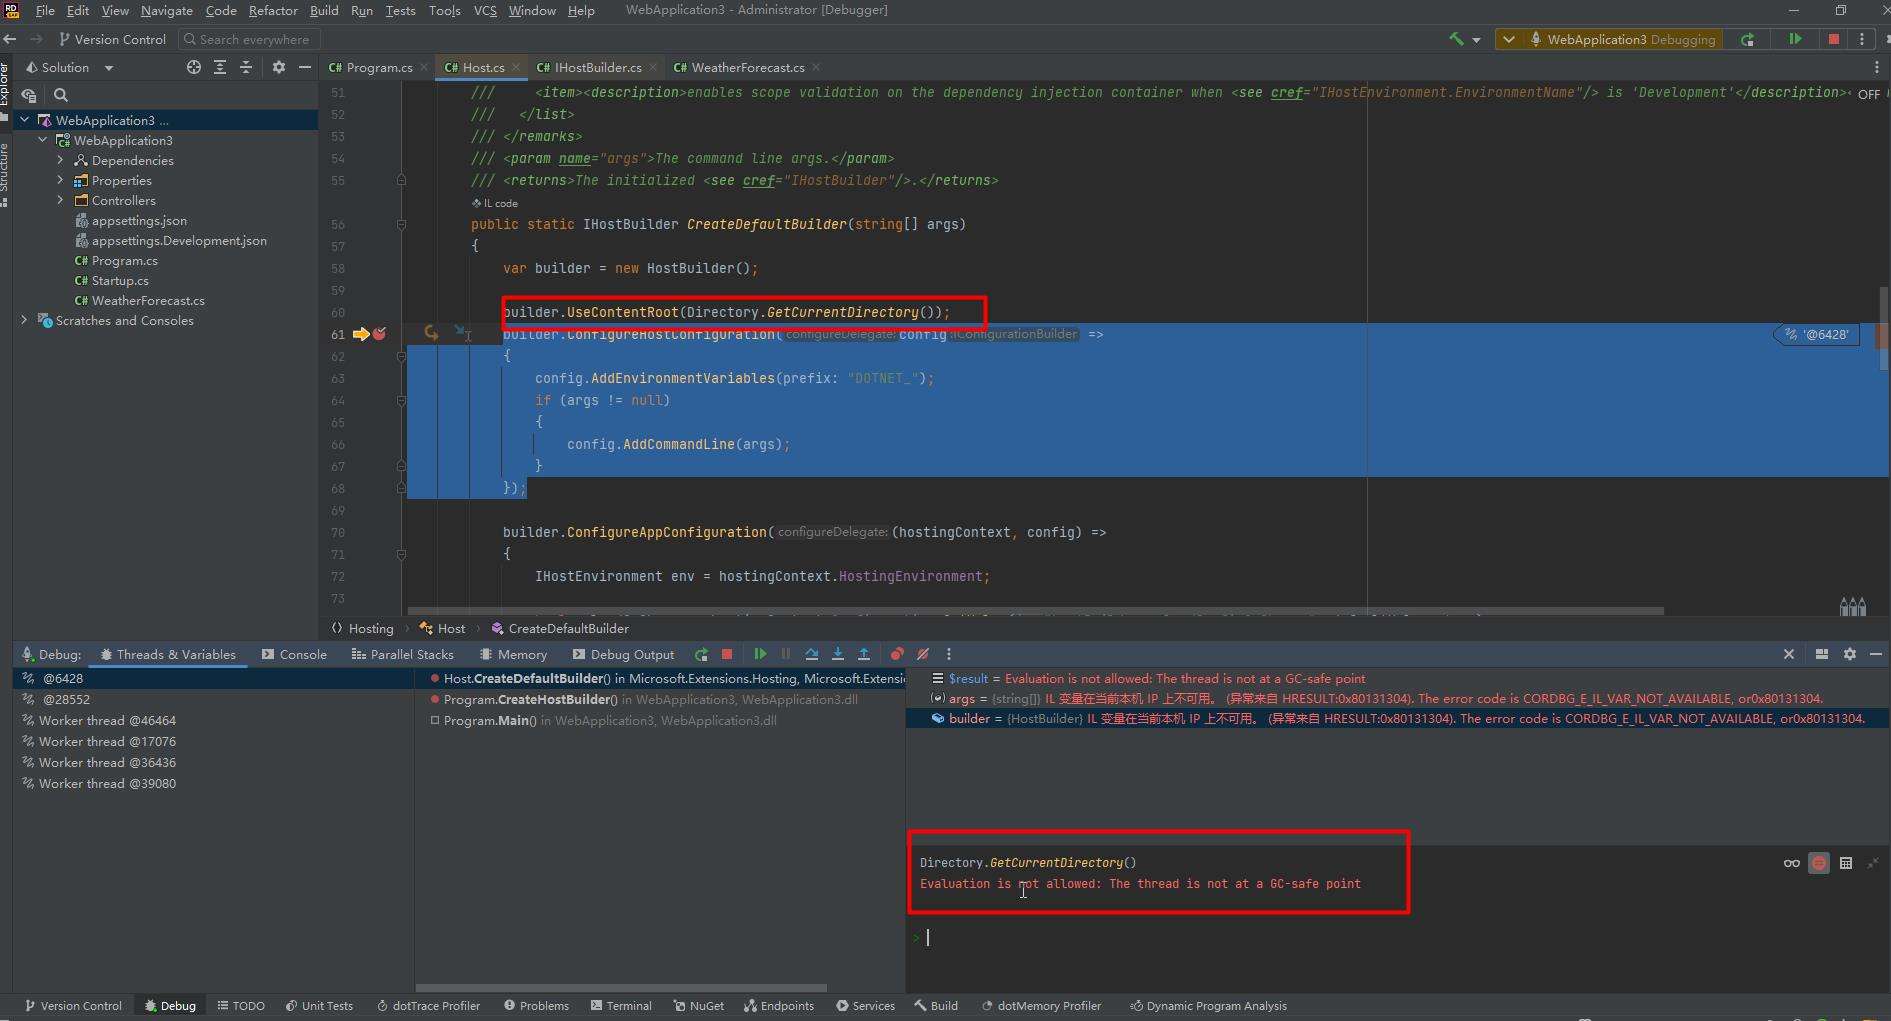
One. Problem solving process
1.Visual Studio 2022 debugging
The first thing that came to my mind was that Rider might not work. Try using Visual Studio 2022, so I found the document [1] and found that pdb files and symbols need to be set, which is too troublesome.
2.Rider debugging
and then replaced by Rider, since debugging can not see the value of the intermediate variable, then directly Console.WriteLine() comes out, the result Console does not exist in the current context at all, as follows: 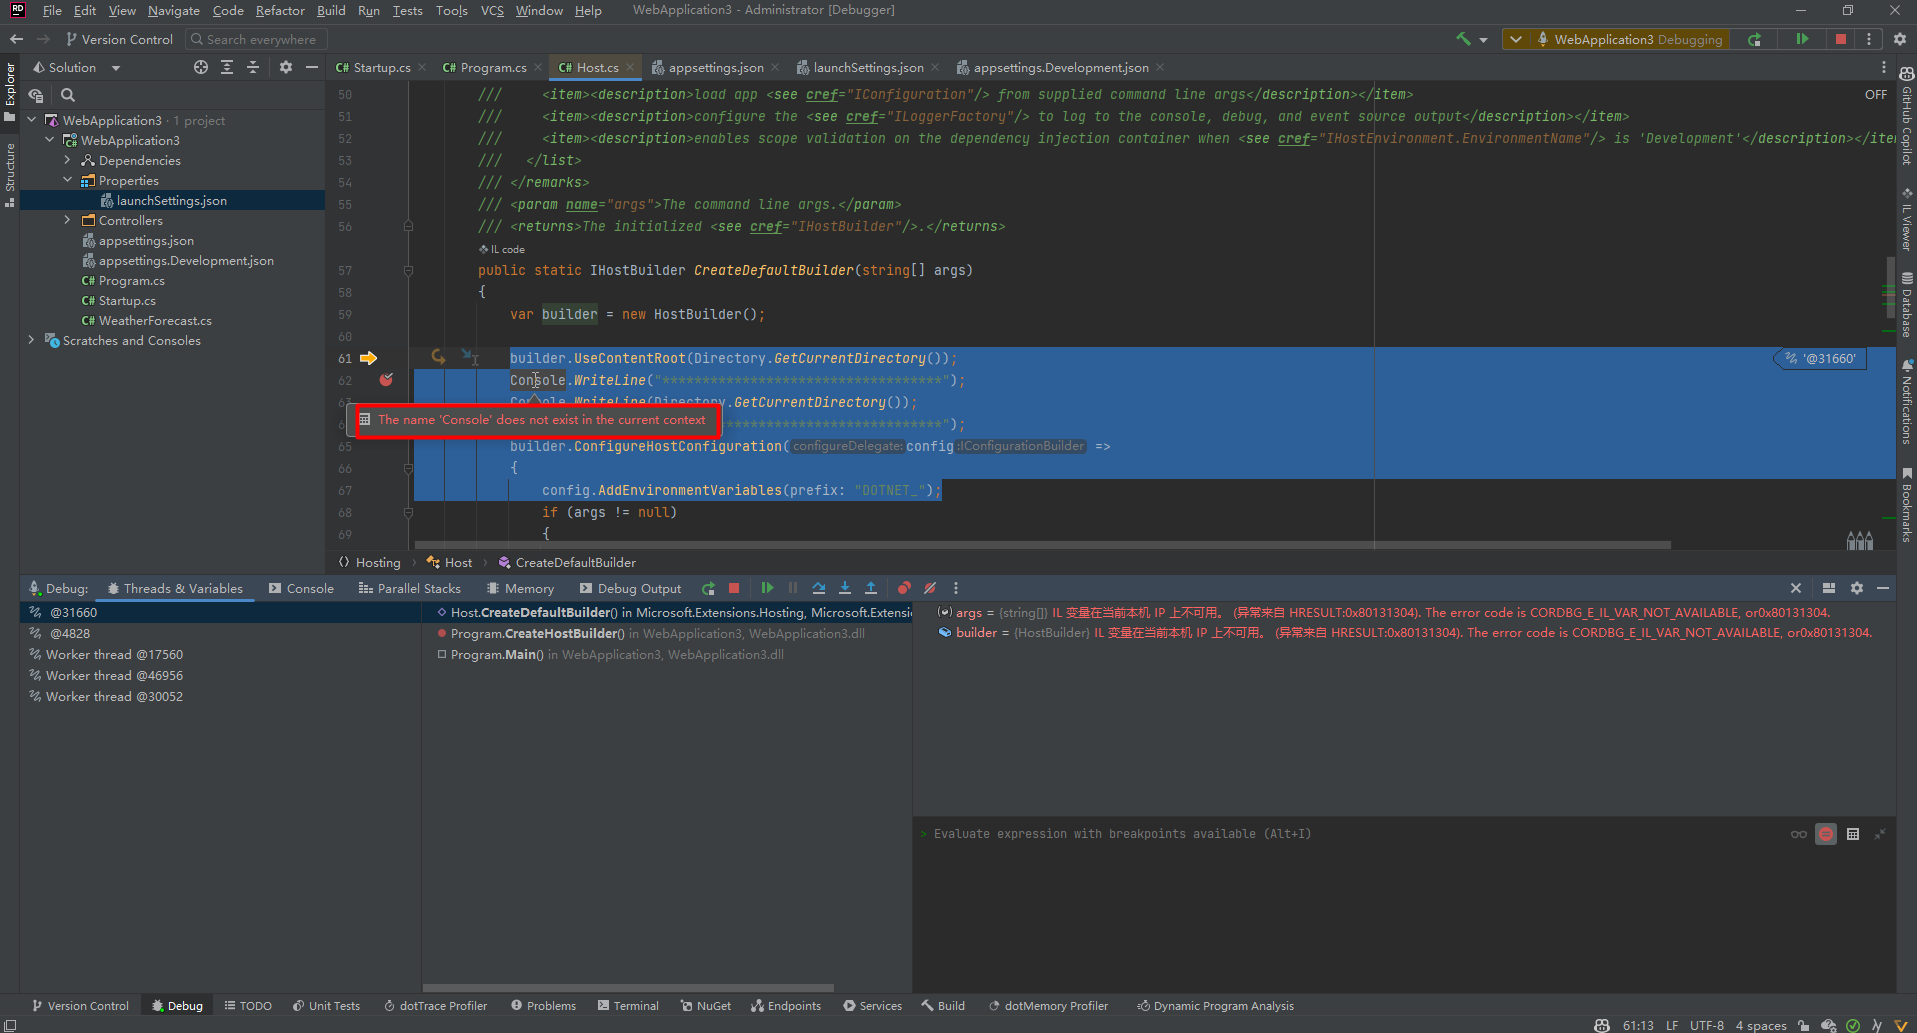
Second. Final solution
1.YouTrack workaround
Continue to search the Internet and found that on the official YouTrack of JetBrains[2][3], Evgeny Terekhin gave a solution on May 30, 2022:
SET COMPLUS_ZapDisable=1 NGen off (CLR)SET COMPLUS_JitMinOpts=1 Disable as much JIT optimizations as possible (CoreCLR)SET COMPlus_TieredCompilation=0 No tiered JIT, only do one pass (CoreCLR)SET COMPLUS_ReadyToRun=0 Don't do netcore's analog to NGen (CoreCLR)Probably means that the CLR has been set, no matter what the settings are, and I have a mentality of giving it a try.Configure the launchSettings.json file:
"environmentVariables": {"ASPNETCORE_ENVIRONMENT": "Development","COMPLUS_ZapDisable": "1","COMPLUS_JitMinOpts": "1","COMPlus_TieredCompilation": "0","COMPLUS_ReadyToRun": "0"}The completed configuration file looks like this: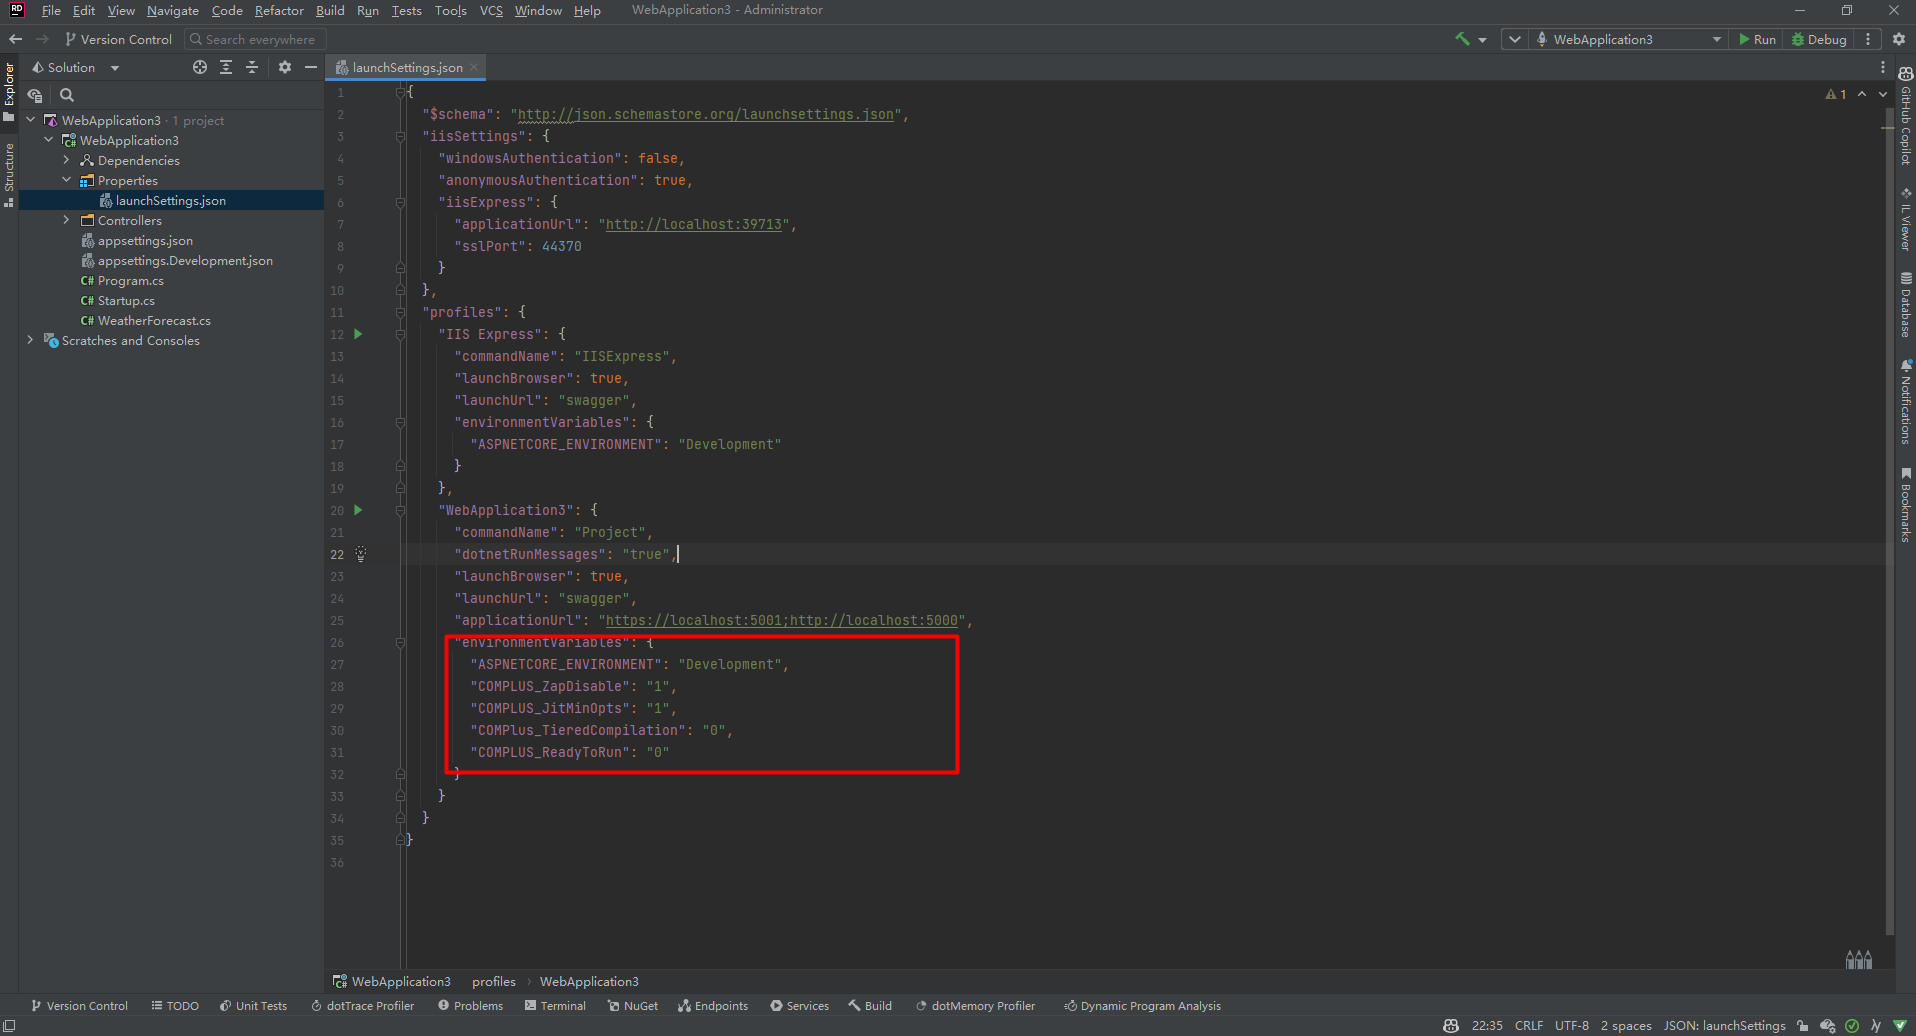
2.Debug ASP.NET Core
After setting a breakpoint to start debugging, the miraculous discovery can also view intermediate variables.As follows: 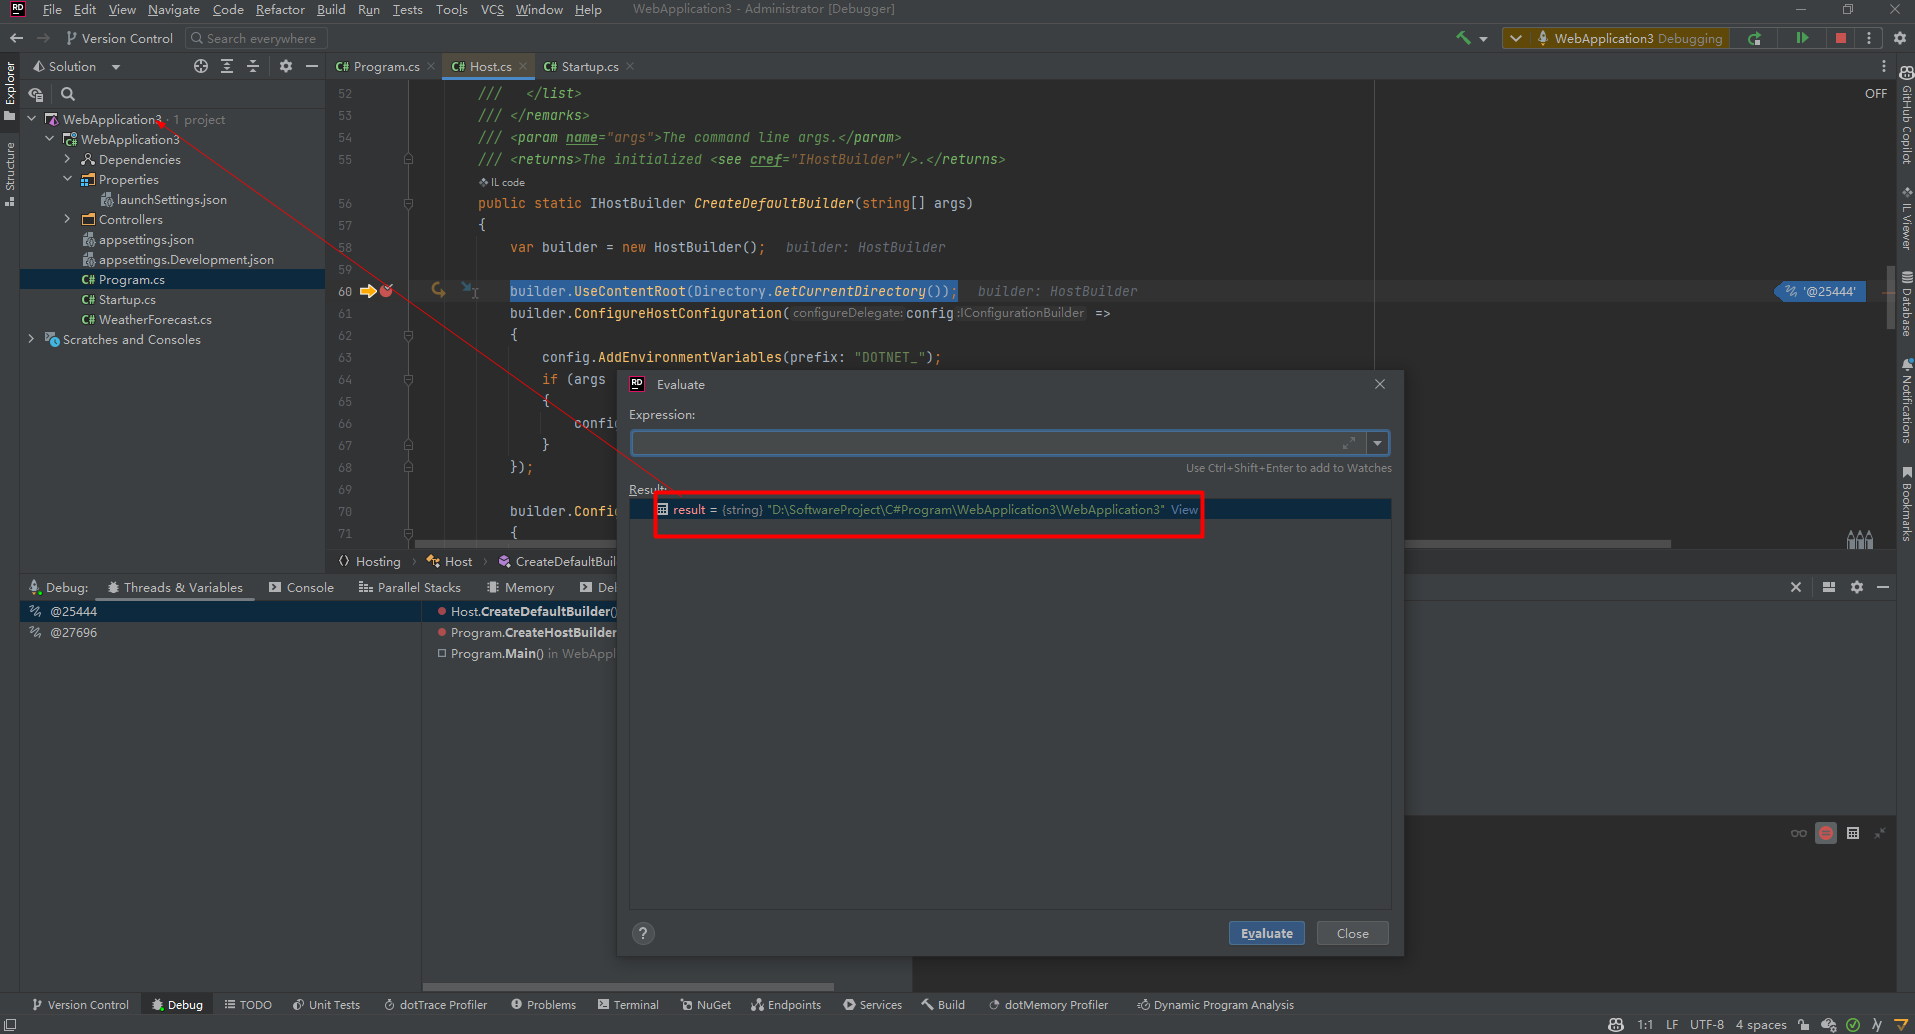
Rider debugging source code is still much more convenient than Visual Studio, no pdb file, no need to set any symbols, just enter the function to be debugged, hit a breakpoint, and then start debugging.
References:
[1]Debugging External Sources with Visual Studio: https://devblogs.microsoft.com/visualstudio/debugging-external-sources-with-visual-studio/
[2]Debugger: Evaluation is not allowed: The thread is not at a GC-safe point: https://youtrack.jetbrains.com/issue/RIDER-40357
[3]When debugging, variables don't display all of their data, instead we get 'Evaluation is not allowed: The thread is not at a GC-safepoint': https://youtrack.jetbrains.com/issue/RIDER-10885/When-debugging-variables-dont-display-all-of-their-data-instead-we-get-Evevaluation-is-not-allowed-The-thread-is-not-at-a-GC-safe