当前位置:网站首页>Promtail + Loki + Grafana 日志监控系统搭建
Promtail + Loki + Grafana 日志监控系统搭建
2022-04-23 14:03:00 【秋分渔火】
Promtail + Loki + Grafana 日志监控系统搭建
环境介绍
本次搭建环境为centos8,使用两台服务器,其中,机器一为应用服务器,另一台为功能服务器,部署java应用及Promtail ,功能服务器搭建功能为loki+Grafana
部署应用服务器
安装java,运行java应用,默认日志路径为/home/log/ 路径下
(这个路径请记住,在Promtail配置时需要配置日志路径)
loki与promtail 安装
loki下载地址
https://github.com/grafana/loki
选择如下安装包下载
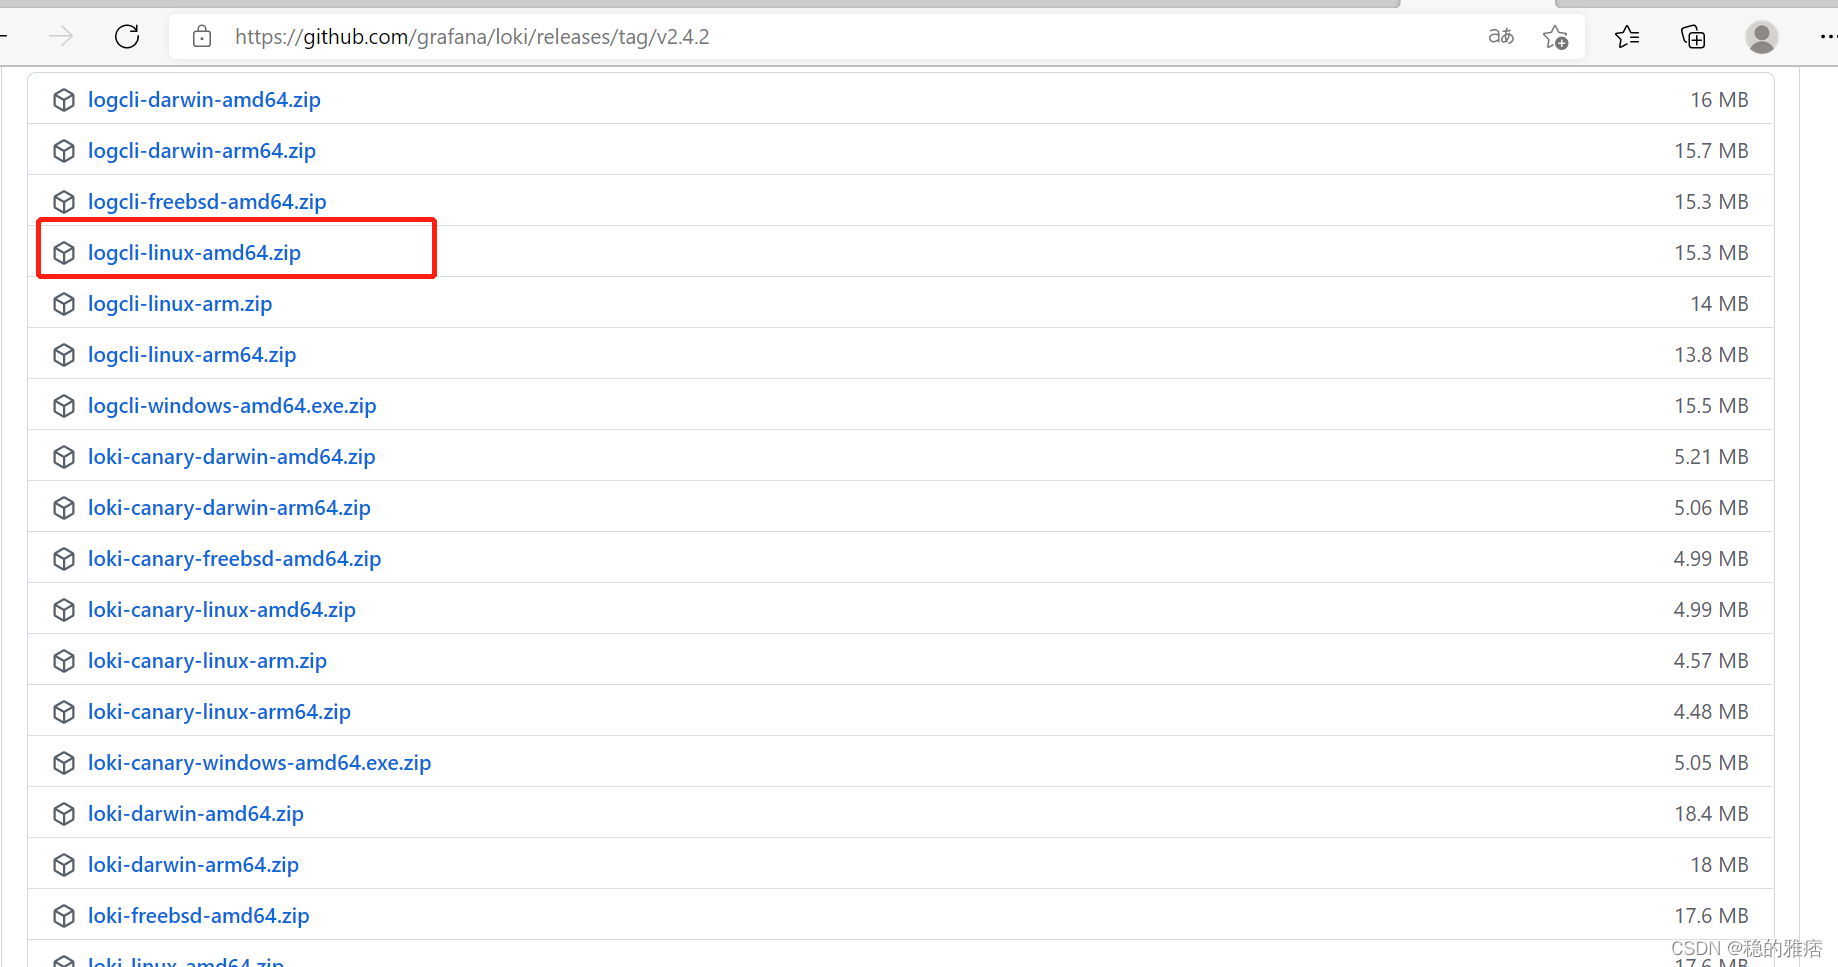
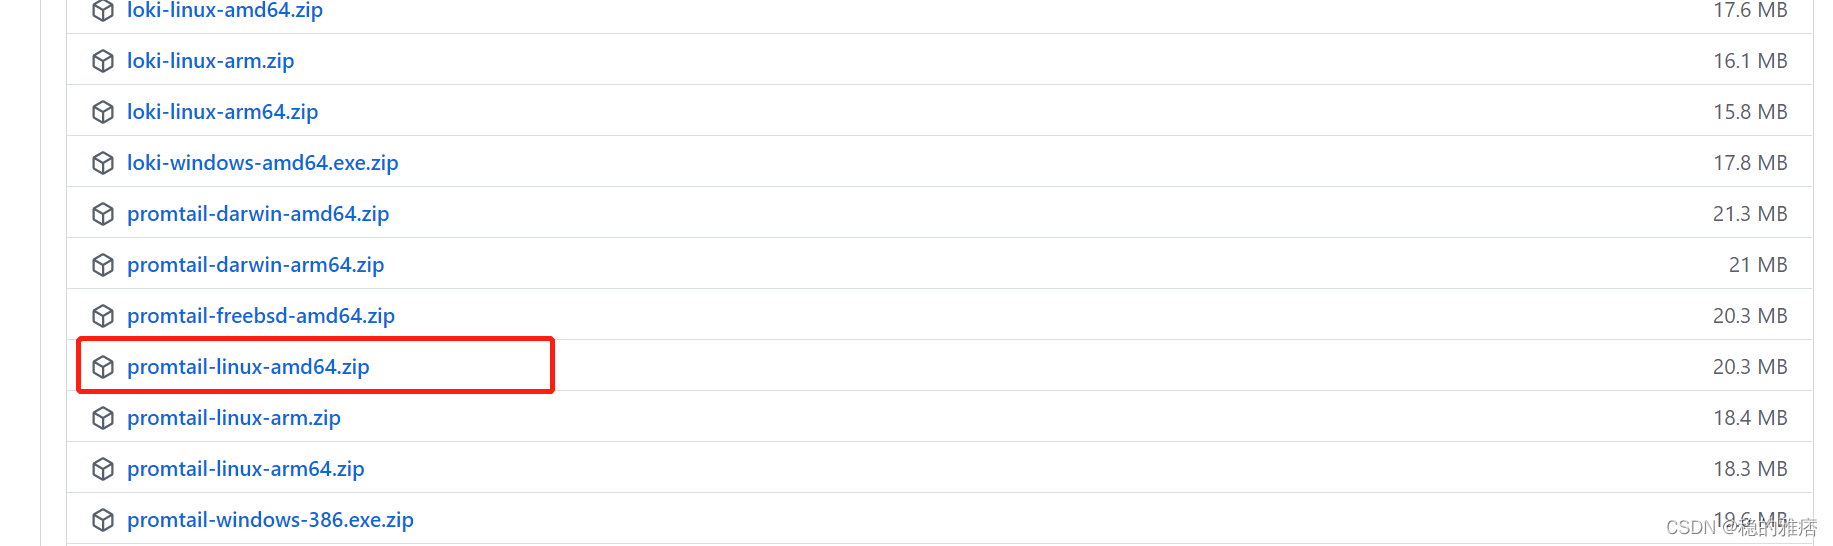
下载好文件后,使用ftp将文件上传至对应安装目录下,使用unzip路径解压
unzip loki-linux-amd64.zip
unzip promtail-linux-amd64.zip
解压好两个安装包后,需要进行loki与promtail 的启动,这两者的安装包内都没有配置文件,需要手动生成配置文件进行启动
https://grafana.com/docs/loki/latest/installation/local/
wget https://raw.githubusercontent.com/grafana/loki/master/cmd/loki/loki-local-config.yaml
wget https://raw.githubusercontent.com/grafana/loki/main/clients/cmd/promtail/promtail-local-config.yaml
第一个为loki的配置文件,第二为promtail的配置文件,下载两者的配置文件进行修改
loki配置文件
auth_enabled: false

server:
  http_listen_port: 3100
  grpc_listen_port: 9096

common:
  path_prefix: /tmp/loki
  storage:
    filesystem:
      chunks_directory: /tmp/loki/chunks
      rules_directory: /tmp/loki/rules
  replication_factor: 1
  ring:
    instance_addr: 127.0.0.1
    kvstore:
      store: inmemory

schema_config:
  configs:
    - from: 2020-10-24
      store: boltdb-shipper
      object_store: filesystem
      schema: v11
      index:
        prefix: index_
        period: 24h

ruler:
  alertmanager_url: http://localhost:9093
promtail配置文件
server:
  http_listen_port: 9080
  grpc_listen_port: 0

positions:
  filename: /tmp/positions.yaml
//此处对应loki的服务地址,需要将此地址改为搭建服务的服务器地址
clients:
  - url: http://localhost:3100/loki/api/v1/push

scrape_configs:
//此处对应grafana界面中的标签名
- job_name: system
  static_configs:
  - targets:
      - localhost
    labels:
      job: varlogs
      //这个对应日志存储路径,
      __path__: /var/log/*log
启动
将上一步的配置文件根据自己的习惯保存为yaml文件,放在对应的安装路径下,执行以下命令
//需要先执行loki的启动命令,因为promtail 启动时,就会开始日志的推送,如果loki未启动,就会报错
./loki-linux-amd64 -config.file=loki.yaml
./promtail-linux-amd64 --config.file=promtail-local-config.yaml
Grafana安装
本次安装采用yum 方式进行安装
yum install grafana
安装完成后,设置开机自启
[root@localhost ~]# systemctl enable grafana-server
Created symlink /etc/systemd/system/multi-user.target.wants/grafana-server.service → /usr/lib/systemd/system/grafana-server.service.
[root@localhost ~]# systemctl start grafana-serve
设置完成后,重启服务器,输入本机ip:3000
grafana运行图
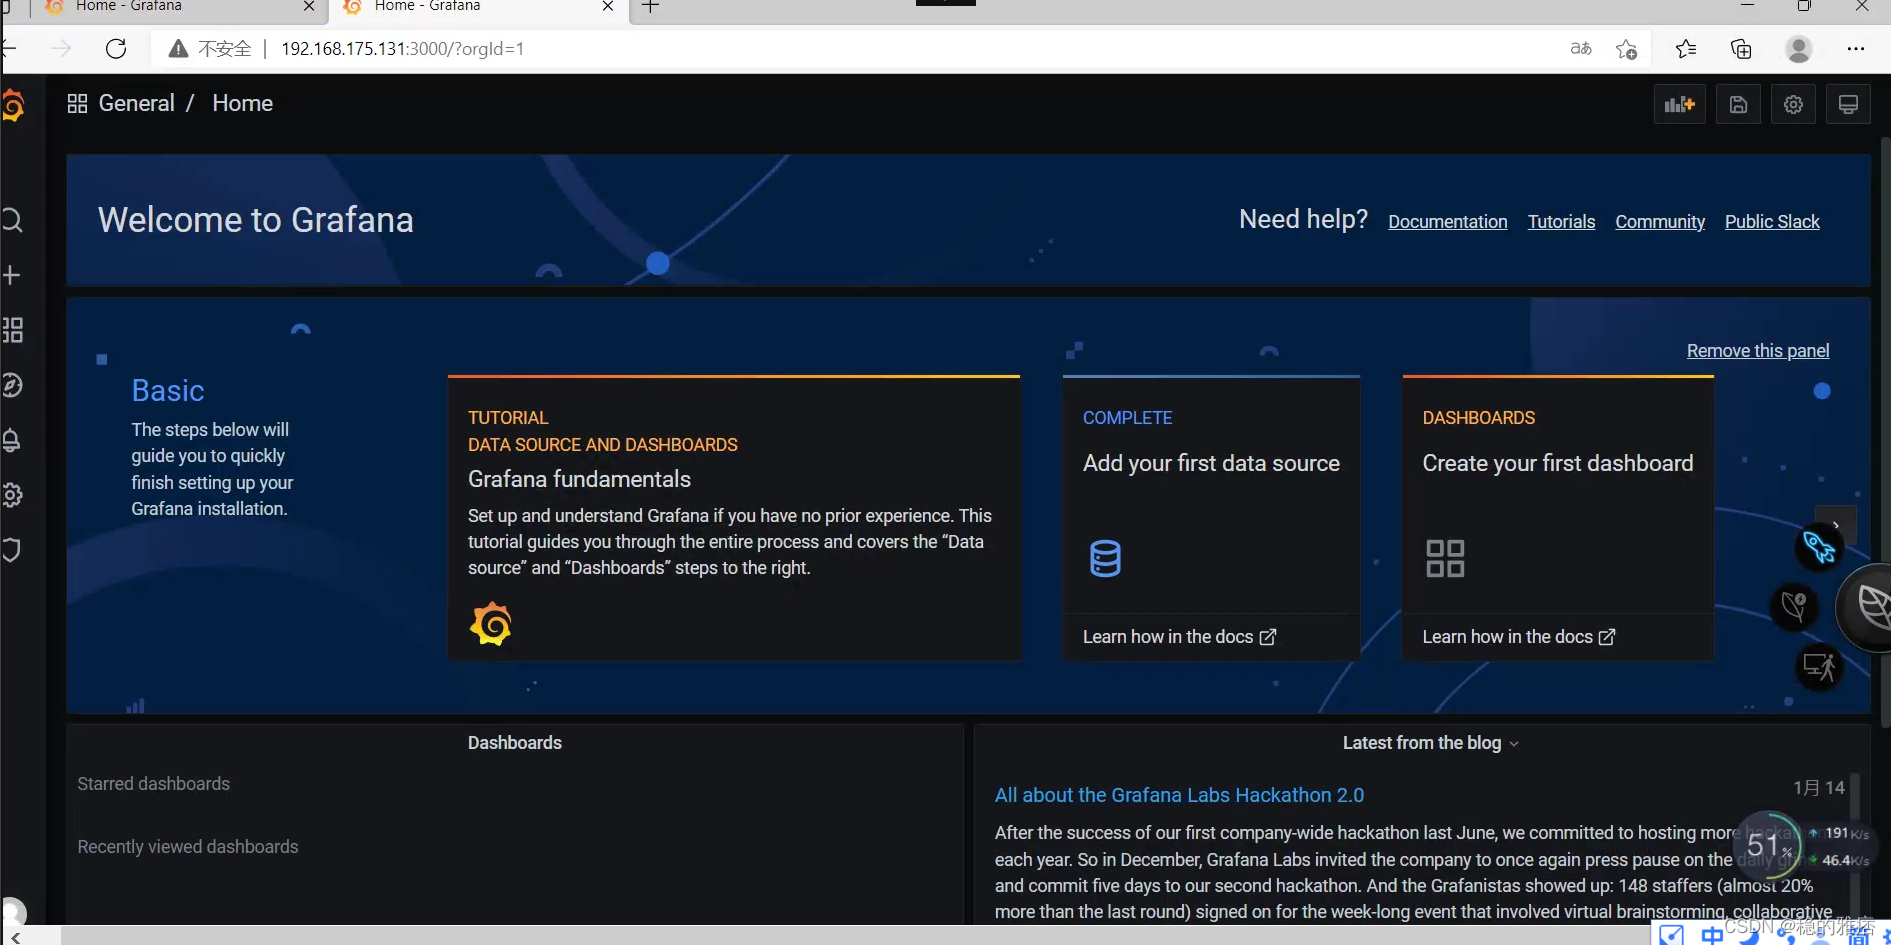
到此,grafana安装结束,下面进行配置
grafana配置
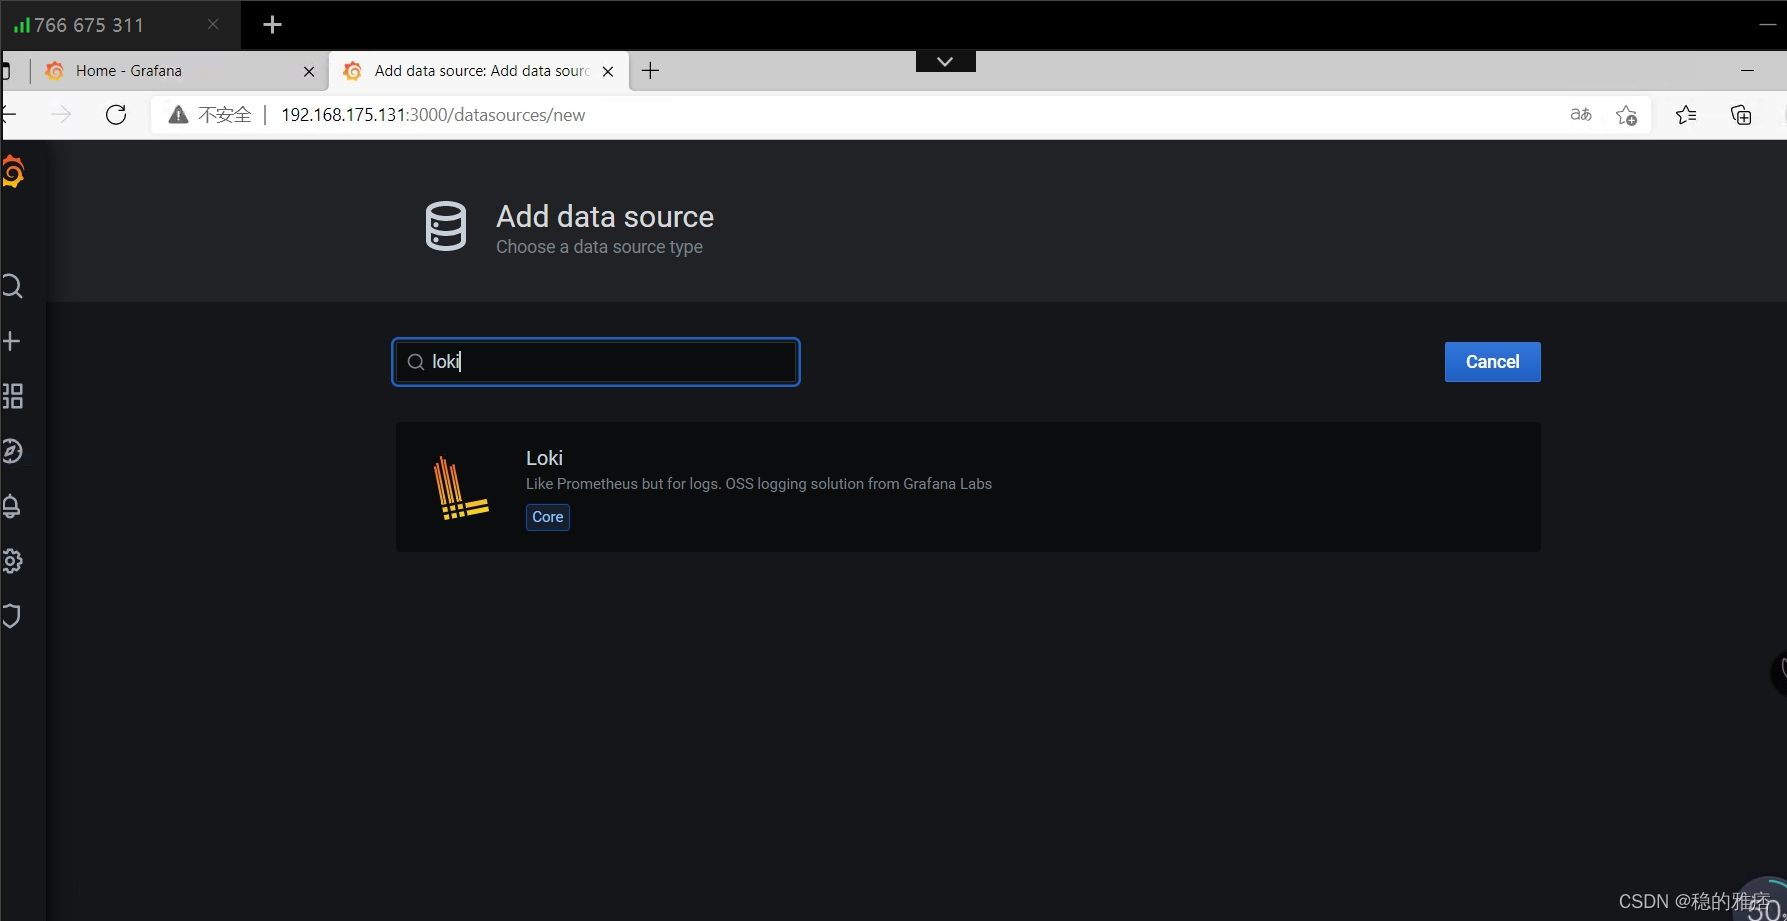
- 配置数据源
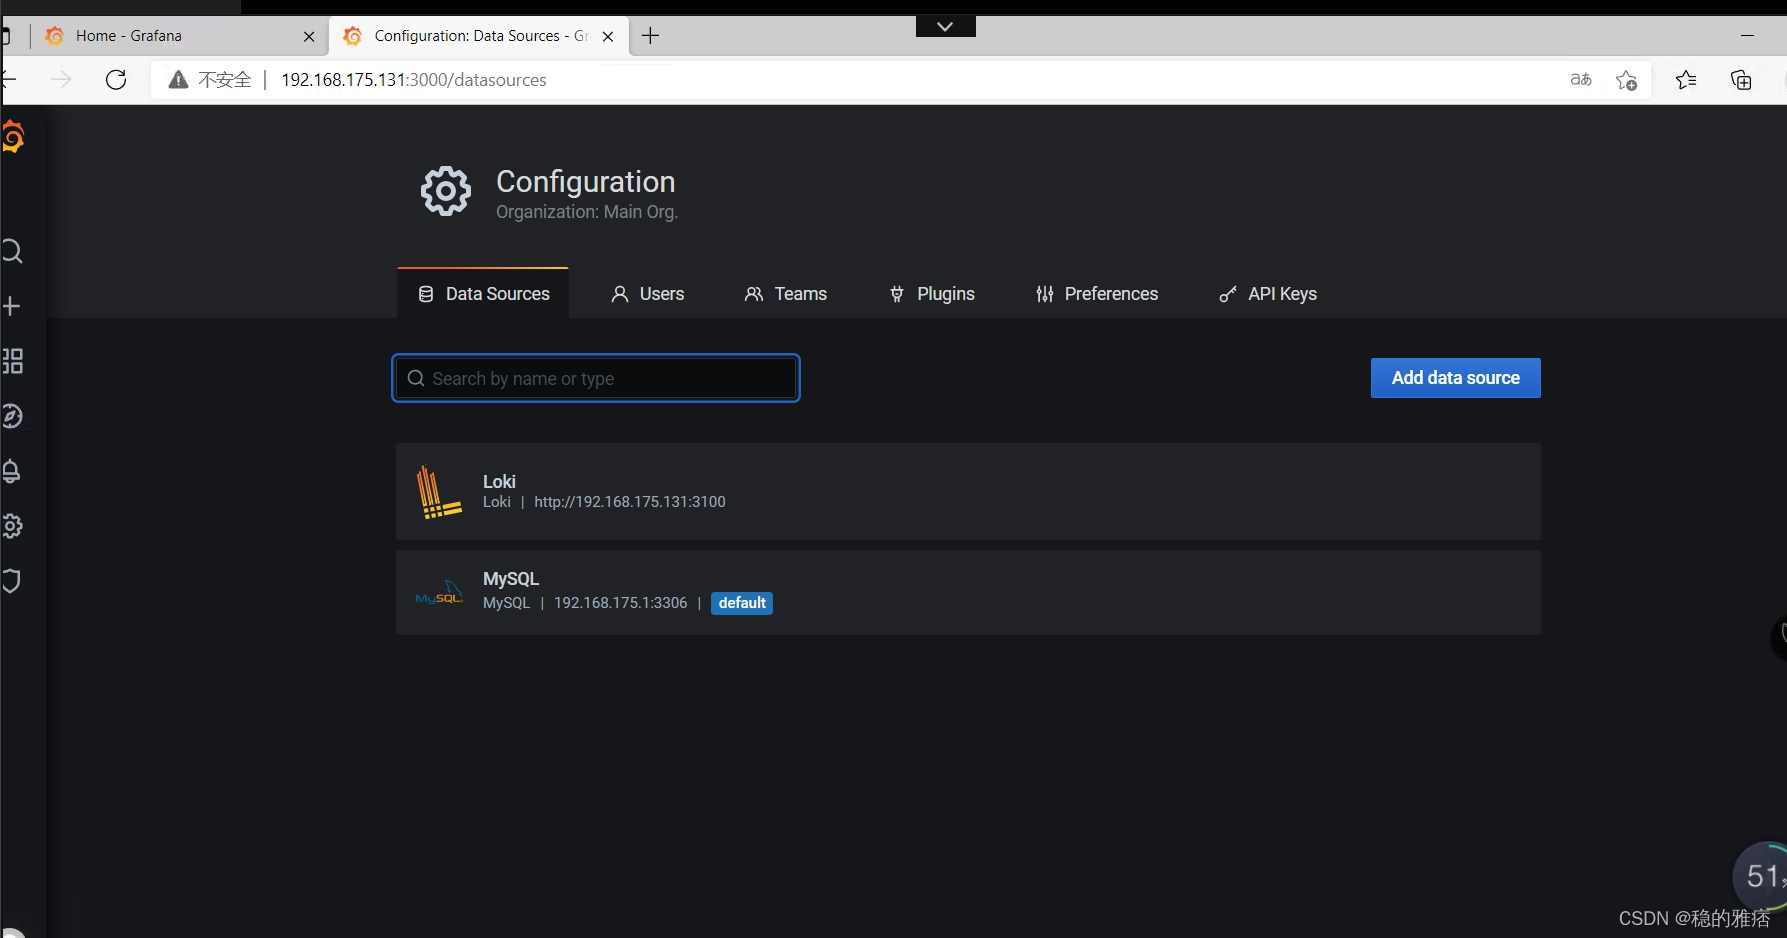
点击addDataSource ,输入loki进行选择
配置url,此处的url为你搭建loki服务的服务器地址,端口默认3100
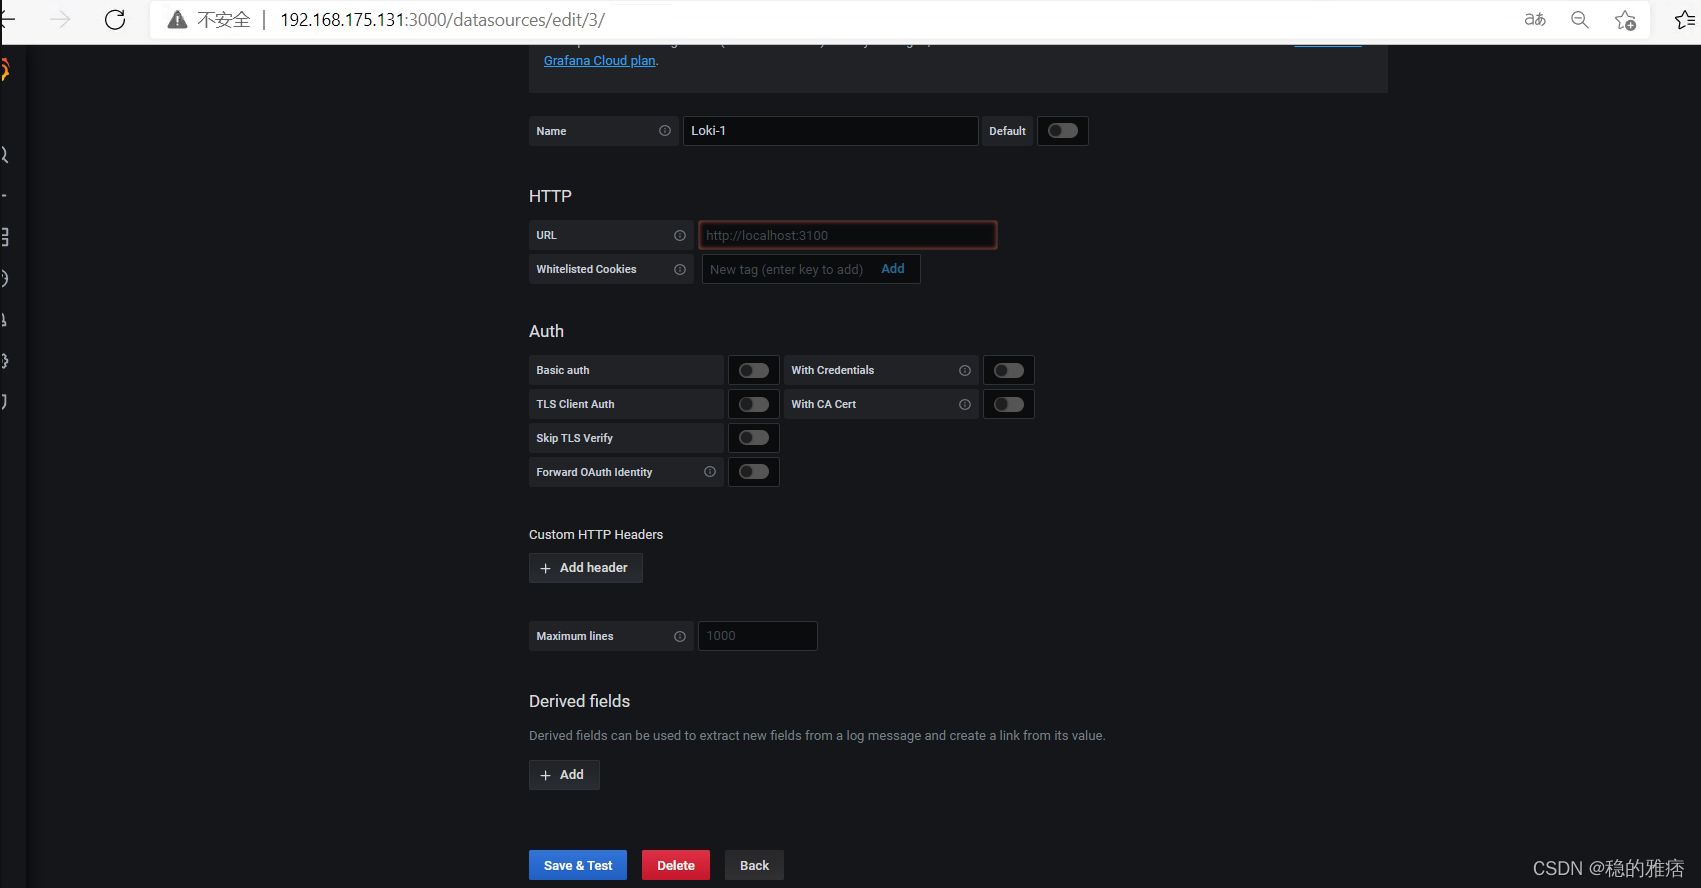
配置完点击save & test
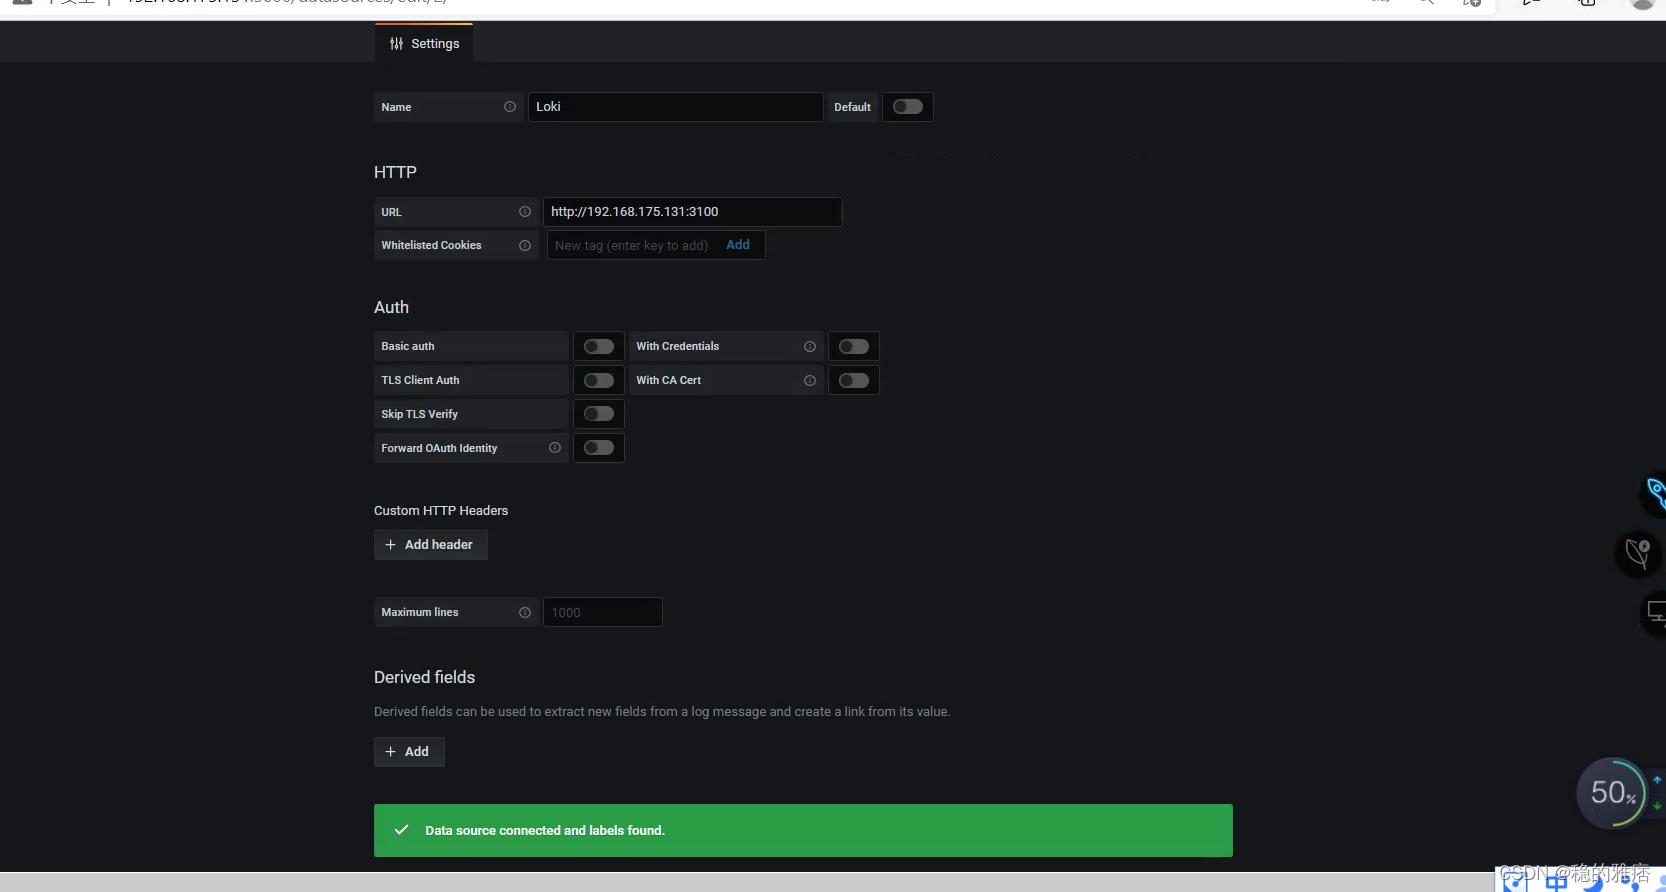
出现该提示,代表配置成功。
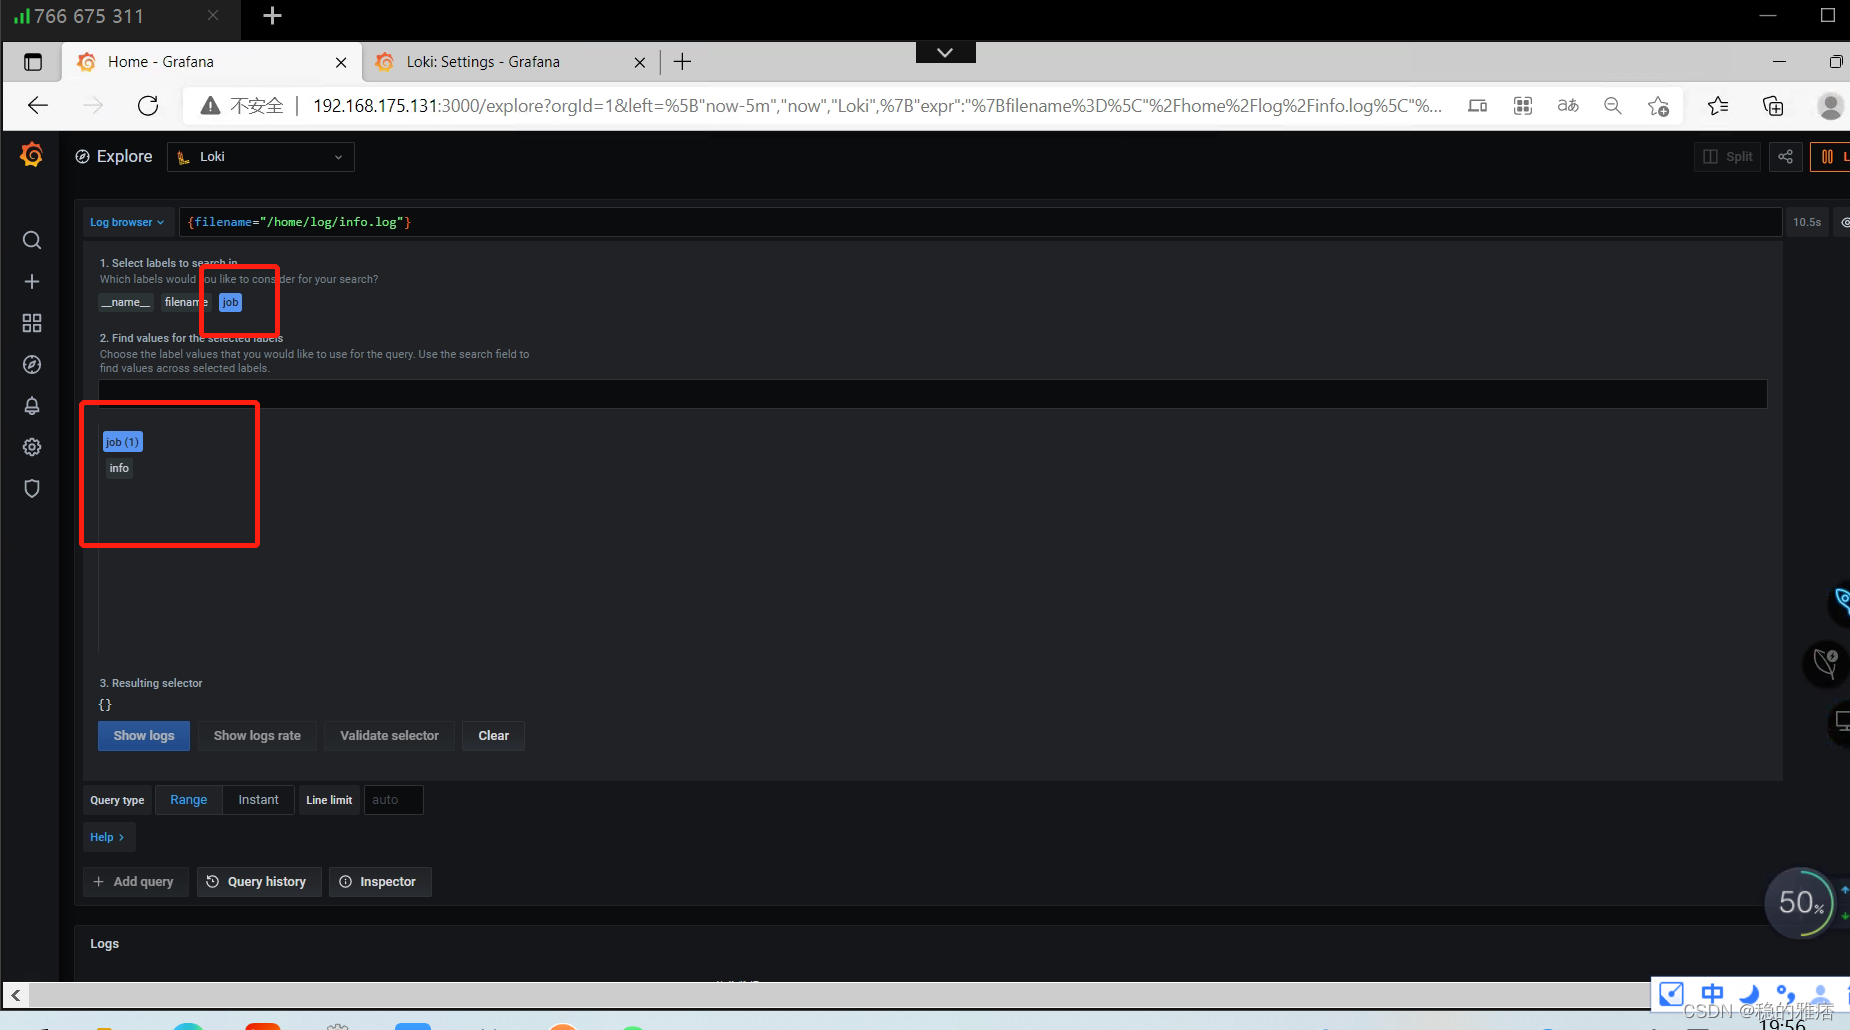
此处的标签对应promtail中配置文件的标签
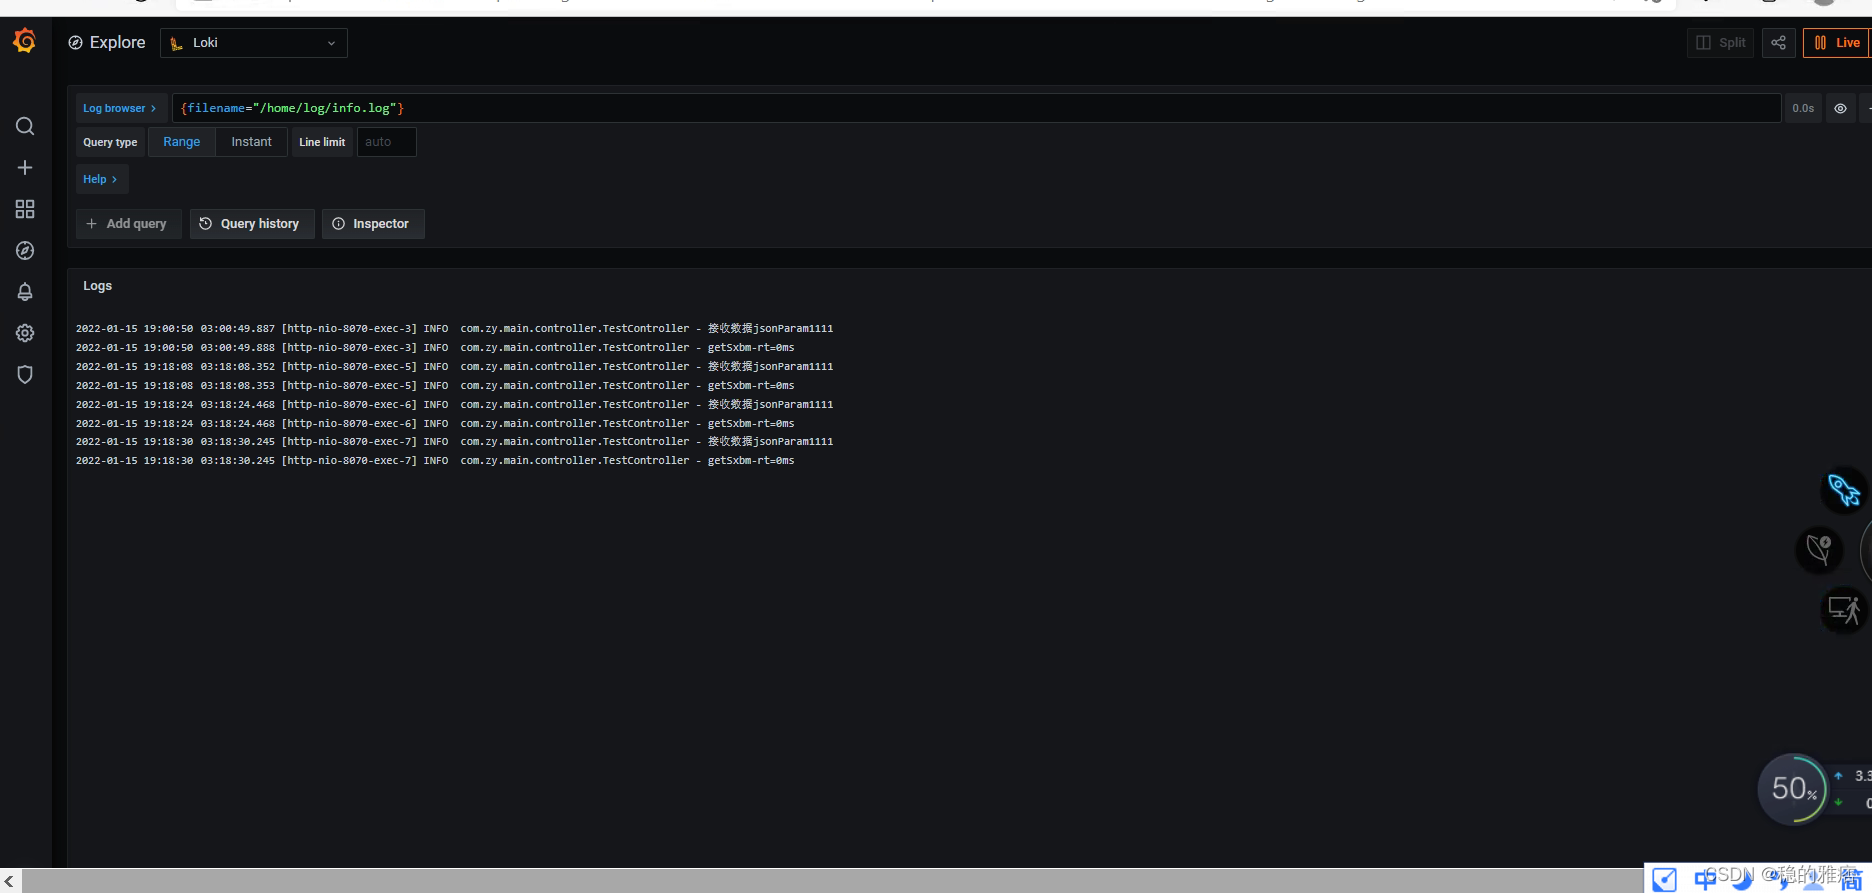
可以看到,应用服务器的日志已经刷新到loki中,至此,由Promtail + Loki + Grafana 搭建的日志监控系统搭建完毕,目前该教程对应的是单应用的服务,后续会出集群的教程,欲知后事如何,且听下回分解
下回已经有了
集群的日志监控系统基础配置及nginx负载均衡配置
版权声明
本文为[秋分渔火]所创,转载请带上原文链接,感谢
https://wfsurrenderzy.blog.csdn.net/article/details/122514287
边栏推荐
- Cdh6 based on CM management 3.2 cluster integration atlas 2 one
- FBS(fman build system)打包
- mysql通过binlog文件恢复数据
- groutine
- Pytorch 经典卷积神经网络 LeNet
- How does redis solve the problems of cache avalanche, cache breakdown and cache penetration
- 专题测试05·二重积分【李艳芳全程班】
- 腾讯根据ip解析地址
- Nifi 快速安装及文件同步操作
- Force deduction brush question 101 Symmetric binary tree
猜你喜欢
Program compilation and debugging learning record
基於CM管理的CDH集群集成Phoenix

微信小程序setInterval定时函数使用详细教程
Crontab timing task output generates a large number of mail and runs out of file system inode problem processing
Programming travel function

Quartus prime hardware experimental development (de2-115 board) experiment II function adjustable comprehensive timer design
Mock测试
Postman reference summary
STM32 learning record 0007 - new project (based on register version)
Windos中安装labellmg教程
随机推荐
Pytorch 经典卷积神经网络 LeNet
生产环境——
VsCode-Go
浅谈基于openssl的多级证书,Multi-level CA的签发和管理,以及双向认证
Programming travel function
专题测试05·二重积分【李艳芳全程班】
Scientists say Australian plan to cull up to 10,000 wild horses doesn’t go far enough
JMeter pressure test tool
网站_收藏
Crontab timing task output generates a large number of mail and runs out of file system inode problem processing
Port occupied 1
JS force deduction brush question 103 Zigzag sequence traversal of binary tree
Multithreading
多重继承虚基类习题
Mock测试
读了一篇博客,重新理解闭包整理一下
CDH cluster integration Phoenix based on CM management
变长参数__VA_ARGS__ 和 写日志的宏定义
Cdh6 based on CM management 3.2 cluster integration atlas 2 one
初识go语言