当前位置:网站首页>基于 VIVADO 的 AM 调制解调(3)仿真验证
基于 VIVADO 的 AM 调制解调(3)仿真验证
2022-08-11 08:30:00 【chylinne】
一、概述
本文通过设计 Testbench 对 AM 调制解调模块进行功能验证,主要检查以下几点:
(1)各阶段波形是否正确输出。
(2)各信号幅值是否符合预期。
(3)调制深度是否接近预设值。
(4)解调波形能否高度还原调制信号。
(5)借助 MATLAB 检查仿真数据是否正常。
二、Testbench 代码
`timescale 1ns / 1ps
//
// Company: UESTC
// Engineer: chylinne
//
// Create Date: 2022/08/01 21:59:51
// Design Name: am
// Module Name: am_tb
// Project Name: am
// Target Devices:
// Tool Versions:
// Description:
//
// Dependencies:
//
// Revision:
// Revision 0.01 - File Created
// Additional Comments:
//
//


module am_tb();

    /* System clock */
    reg         clk;

    /* System reset */
    reg         rst_n;

    /* Phase Increment Programmability
    PINC = fout * 2^B / fclk
         = 8MHz * 2^16 / 100 MHz
         = 5243
    */
    wire [15:0] pinc_carrier = 'd5243;

    /* Phase Increment Programmability
    PINC = fout * 2^B / fclk
         = 8kHz * 2^24 / 100 MHz
         = 1342
    */
    wire [23:0] pinc_modulate = 'd1342; // clocks

    /* Modulation Depth */
    wire [3:0]  depth = 'd9; // 0.9

    wire [7:0]  modulate_signal;
    wire [7:0]  carrier_signal;
    wire [17:0] modulated_signal;
    wire [7:0]  demodulated_final;
    reg  [17:0] modulated_out;
    reg  [7:0]  demodulated_out;

    integer modulated_file, demodulated_file;

    initial begin
        clk <= 1'b0;
        rst_n <= 1'b0;
        modulated_file = $fopen("D:/FPGA/am/modulated_out.txt", "w");
        demodulated_file = $fopen("D:/FPGA/am/demodulated_out.txt", "w");

        #10
        rst_n <= 1'b1;
    end

    // system clock is set to 100 MHz
    always #5 clk = ~clk;

    [email protected](posedge clk) begin
        modulated_out <= modulated_signal;
        demodulated_out <= demodulated_final;
    end

    [email protected](posedge clk) begin
        $fwrite(modulated_file, "%d\n", $signed(modulated_out));
        $fwrite(demodulated_file, "%d\n", demodulated_out);
    end

    am u_am(
        .clk(clk),
        .rst_n(rst_n),
        .pinc_carrier(pinc_carrier),
        .pinc_modulate(pinc_modulate),
        .depth(depth),
        .modulate_signal(modulate_signal),
        .carrier_signal(carrier_signal),
        .modulated_signal(modulated_signal),
        .demodulated_final(demodulated_final)
    );

endmodule
三、测试结果
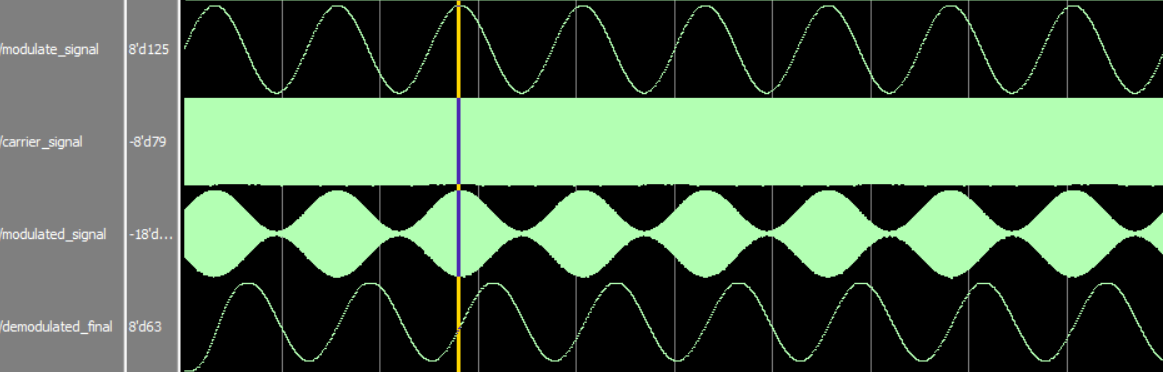
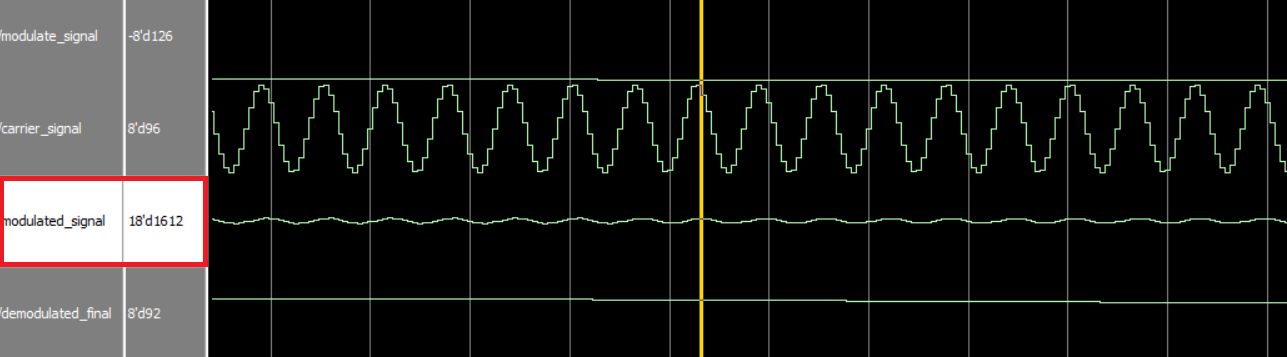
(1)总览
如下图所示,信号由上到下依次为:调制信号(8 kHz 正弦波)、载波信号(8 MHz 正弦波)、已调信号、解调信号。
(2)调制信号
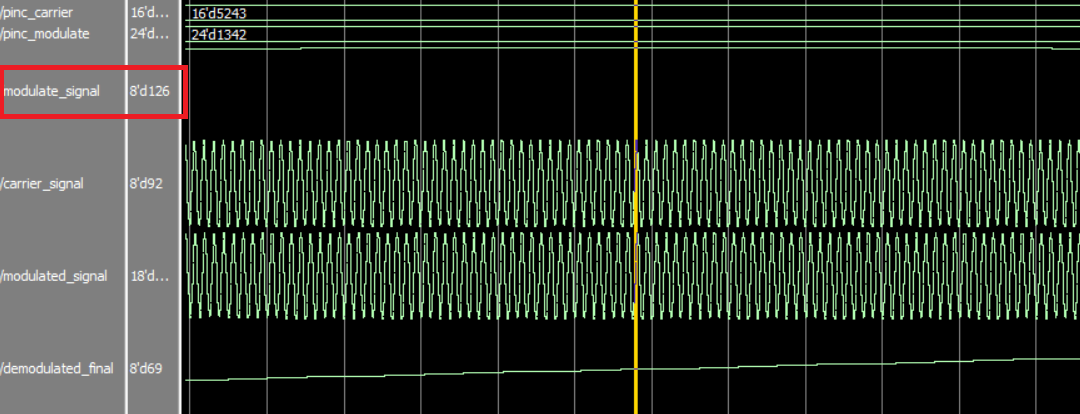
最大值为 126,如下。
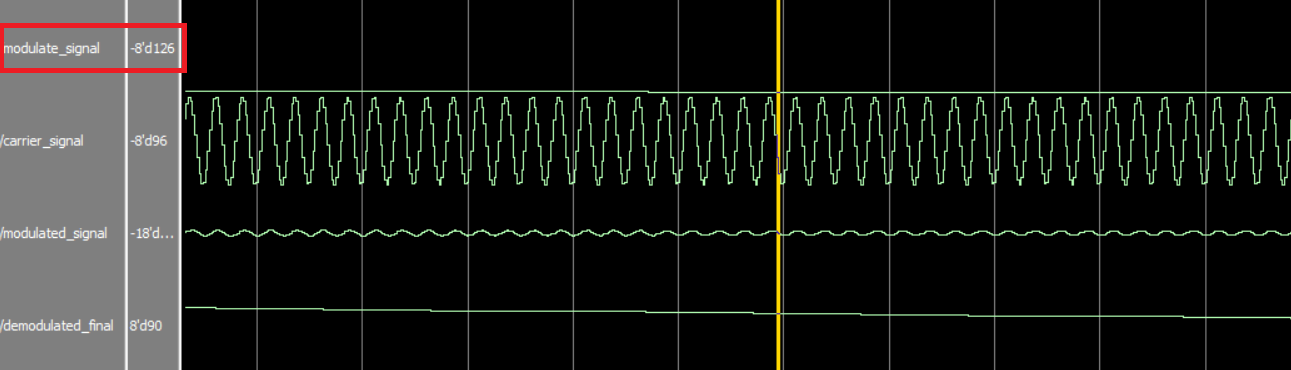
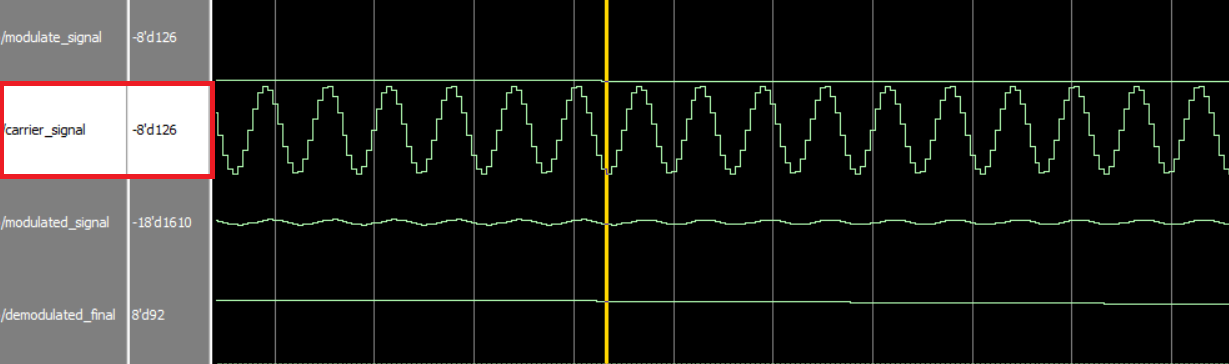
最小值为 -126,如下。
(3)载波信号
最大值为 126,如下。

最小值为 -126,如下。
(4)已调信号
在最大值处,幅值为 30240,如下。
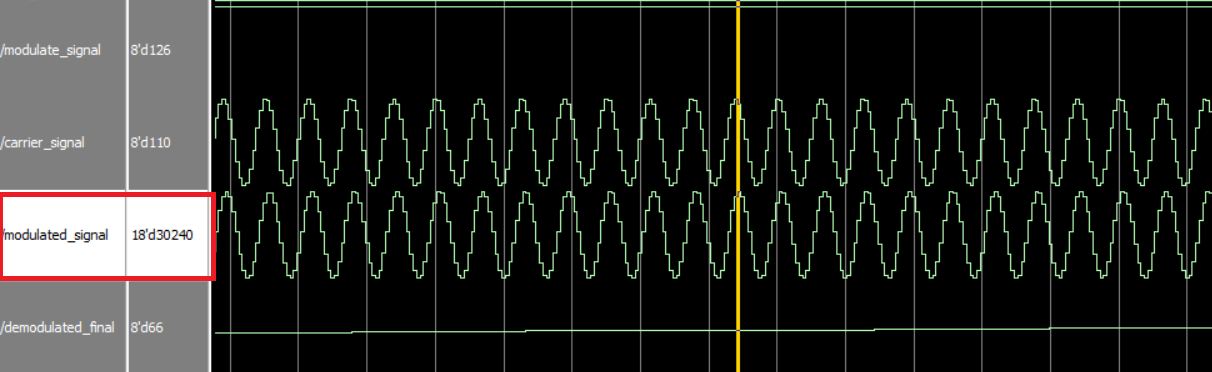
在最小值处,幅值为 1612,如下。
因此,仿真结果所对应的调制深度为

误差为

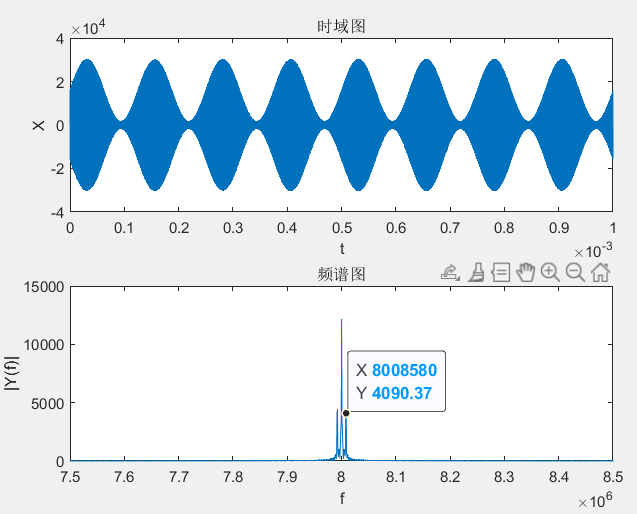
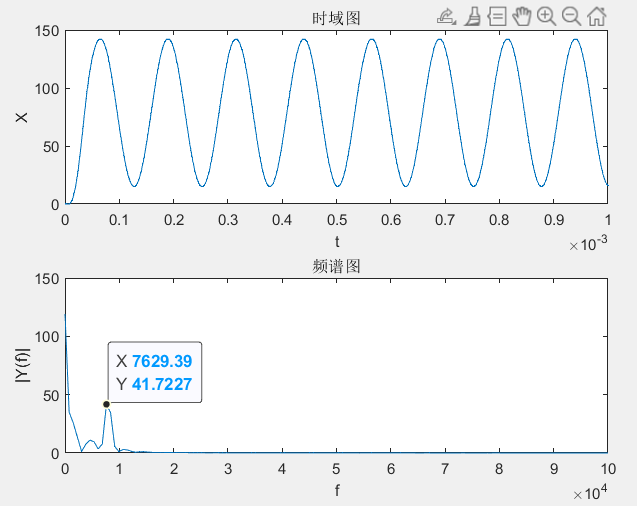
四、MATLAB 验证
(1)验证代码
通过 MATLAB 分别读取 Testbench 生成的两个 .txt 文件(modulated_out.txt 和 demodulated_out.txt)来获取仿真的时域数据,并通过 fft 函数计算其频域数据。
clear;
file = fopen('modulated_out.txt');
content = textscan(file,'%s');
fclose(file);
data = content{1,1}(2:end,:);
X = str2num(char(data));
Fs = 100000000;%采样频率
dt = 1/Fs;%采样周期
L = length(X);%数据长度
t=0:dt:dt*(L-1);%时间
n = 2^nextpow2(L);%求得最接近数据长度的2^n
Y = 2*abs((fft(X,n))/n);%求频谱

subplot(2, 1, 1);
plot(t,X);
title('时域图');
xlabel('t');
ylabel('X');
set(gca,'XLim',[0 10^-3]);

subplot(2, 1, 2);
plot(Fs*(0:(n/2))/n,Y(1:n/2+1));
title('频谱图');
xlabel('f');
ylabel('|Y(f)|');
axis([7500000 8500000 0 15000]); % display modulated data
%axis([0 100000 0 150]); % display demodulated data
(2)验证结果
调制结果:
解调结果:
边栏推荐
猜你喜欢
![ASP.NET Core 6框架揭秘实例演示[32]:错误页面的集中呈现方式](/img/c9/93ab353c4908adaaae0da2cc3b6a3c.png)

随机推荐
进阶-指针
老干妈创始人陶华碧现身直播间,70岁“国民女神”拥抱直播电商
Kotlin算法入门求完全数
C Primer Plus(6) 中文版 第1章 初识C语言 1.1 C语言的起源 1.2 选择C语言的理由 1.3 C语言的应用范围
flex布局回顾
Unity3D——自定义类的Inspector面板的修改
设置Vagrant创建的虚拟机名称和内存
ImportError: /usr/local/cuda-11.2/lib64/libcublas.so.10: version `libcublas.so.10‘ not found
第一次因没有找到iframe元素而怀疑selenium4是不是有bug?
idea 方法注释:自定义修改method的return和params,void不显示
零基础SQL教程: 基础查询 05
高德能力API
2021-08-11 For loop combined with multi-threaded asynchronous query and collect results
One network cable to transfer files between two computers
Kotlin算法入门计算素数以及优化
AcWing 272. 最长公共上升子序列
eureka和consul的区别
oracle数据库中列转行,列会有变化
gRPC系列(一) 什么是RPC?
经典论文-MobileNet V1论文及实践