当前位置:网站首页>Openlayers Aggregate Graph, Weight Aggregate Graph, and Aggregate Graph Click Events
Openlayers Aggregate Graph, Weight Aggregate Graph, and Aggregate Graph Click Events
2022-08-11 08:12:00 【Southejor】
Openlayers 聚合图、Weight aggregation graph and aggregation graph click event
OpenLayers 教程
在实际工作中,Openlayers There are many ways to render data(WMS、瓦片、矢量数据等),In the case of rendering a large amount of data at one time,Need to make static slices,比如WMTS、TMS;Or vector slices,比如 Geojson、mvt 等.
For data that is not very large,常常使用 热力图、聚合图 way to render on the front end,It can better reflect the data characteristics.
This example is based on an application in a real project,介绍: Load aggregate graph、Weight aggregation graph、Aggregate graph parameters、Aggregate graph click events usage of other functions.
PS:如果数据量很大的话,Data storage is recommended,This is done using the database's aggregate functions.
Openlayers 聚合图、Weight aggregation graph、Aggregate graph events
<html lang="en">
<head>
    <meta charSet="utf-8">
    <!--注意:openlayers 原版的比较慢,这里引起自己服务器版-->
    <link rel="stylesheet" href="http://openlayers.vip/examples/css/ol.css" type="text/css">
    <style> /* 注意:这里必须给高度,否则地图初始化之后不显示;一般是计算得到高度,然后才初始化地图 */ .map {
       height: 700px; width: 100%; float: left; } </style>
    <!--注意:openlayers 原版的比较慢,这里引起自己服务器版-->
    <script src="http://openlayers.vip/examples/resources/ol.js"></script>
    <script src="http://openlayers.vip/examples/resources/jquery-3.5.1.min.js"></script>
    <script src="./tiandituLayers.js"></script>
    <title>OpenLayers example</title>
</head>
<body>
<h2>OpenLayers Cluster</h2>
<!--地图容器,需要指定 id -->
<div id="map" class="map"></div>

<script type="text/javascript"> var map = new ol.Map({
       // 地图容器 target: 'map', // 地图图层,比如底图、矢量图等 layers: [ getIMG_CLayer(), getIBO_CLayer(), getCIA_CLayer(), ], // 地图视野 view: new ol.View({
       projection: "EPSG:4326", // 定位 center: [115.67724700667199, 37.73879478106912], // 缩放 zoom: 6, maxZoom: 18, minZoom: 1, }) }); /** * @todo wkt格式数据转化成图形对象 * @param {string} wkt "POINT(112.7197265625,39.18164062499999)" 格式数据 * @param {string|Projection} sourceCode 源投影坐标系 * @param {string|Projection} targetCode 目标投影坐标系 * @returns {Feature} */ function getFeatureByWKT(wkt, sourceCode, targetCode) {
       try {
       let view = map.getView(); if (!wkt) {
       return null; } let format = new ol.format.WKT(); let feature; feature = format.readFeature(wkt, {
       featureProjection: targetCode || view.getProjection(), dataProjection: sourceCode || view.getProjection(), }); return feature; } catch (e) {
       console.log(e); return null; } } /** * @todo Convert color to hexadecimal rgba * @param sColor 格式数据 * @param opacity * @returns rgba颜色字符串 */ function colorToRgb(sColor, opacity) {
       //For hex color sumrgbconversion regex var REG = /^#([0-9a-fA-f]{3}|[0-9a-fA-f]{6})$/; sColor = sColor.toLowerCase(); if (/^[A-Za-z]+$/.test(sColor)) return sColor; if (sColor && REG.test(sColor)) {
       if (sColor.length === 4) {
       let sColorNew = "#"; for (let i = 1; i < 4; i += 1) {
       sColorNew += sColor.slice(i, i + 1).concat(sColor.slice(i, i + 1)); } sColor = sColorNew; } //处理六位的颜色值 let sColorChange = []; for (let i = 1; i < 7; i += 2) {
       sColorChange.push(parseInt("0x" + sColor.slice(i, i + 2))); } if (opacity) sColorChange.push(opacity); return "rgba(" + sColorChange.join(",") + ")"; // return sColorChange; } else {
       return sColor; } }; // 地图事件 function clickFunction(evt) {
       let feature = map.forEachFeatureAtPixel(evt.pixel, function (feature, layerVetor) {
       return feature.getProperties().features; }); // The click event of the graphic element // Here you can use balloons to display information if (feature && feature.length == 1) {
       console.log(feature[0]); alert('点击了:' + feature[0].get('name')); } else {
       feature && console.log(feature); feature && alert('Click included:' + feature.length + ' Aggregate graph of each graphic element!'); } } // Initialize the click event marker var initClickFlag = false; // 点击事件 function activateClickFunc() {
       initClickFlag && alert('Click event is turned on!'); map.on('click', clickFunction); initClickFlag = true; } // 关闭点击事件 function shutDownClick() {
       alert('Click events are turned off!'); map.un('click', clickFunction); } // 点线面数组 var features = undefined; // Aggregate map layer object var clusterLayer = undefined; // 资源对象 var vectorSource = undefined; // Aggregate graph objects var clusterSource = undefined; // Initialize the aggregation graph function initCluster() {
       features = []; // 模拟数据 for (var i = 1; i <= 15; i++) {
       var feature = getFeatureByWKT( "POINT(" + (113 + (i / 10)) + " " + (35 + (i / 10)) + ")" ); var feature2 = getFeatureByWKT( "POINT(" + (113 + ((i + 5) / 10)) + " " + (35 + (i / 10)) + ")" ); var feature3 = getFeatureByWKT( "POINT(" + (113 + ((i + 9) / 10)) + " " + (35 + (i / 10)) + ")" ); var point = new ol.style.Style({
       // 点样式 image: new ol.style.Icon({
       // 允许跨域,如果不设置,打印地图不会打印 crossOrigin: 'anonymous', // 标注图片和文字之间的距离 anchor: [0.5, 0], // 图片的偏移 offset: [0.2, 0], // 图片的锚点,一般来说,都是右下角 anchorOrigin: 'bottom-right', //图标的url src: "http://api.tianditu.gov.cn/v4.0/image/marker-icon.png", scale: 1, }) }); feature.setStyle(point); feature.set('name', 'feature1-' + i); feature.set('capability', i / 15); feature2.setStyle(point); feature2.set('name', 'feature2-' + i); feature2.set('capability', i / 15); feature3.setStyle(point); feature3.set('name', 'feature3-' + i); feature3.set('capability', i / 15); features.push(feature) features.push(feature2) features.push(feature3) } /** * 资源 */ vectorSource = new ol.source.Vector({
      }); // 聚合图 clusterSource = new ol.source.Cluster({
       wrapX: false, source: vectorSource, }); // 图层 clusterLayer = new ol.layer.Vector({
       source: clusterSource, zIndex: 1, }); map.addLayer(clusterLayer); } /** * todo Add aggregation graph * @param dynamicData (参数是features) */ function addData(dynamicData, distance, original) {
       // Maximum number of graphic elements var maxFeatureCount; // 当前分辨率 var currentResolution; // 普通样式,Ordinary small circle var originalStyle = function (feature) {
       var features = feature.get('features'); var size = features.length; return new ol.style.Style({
       image: new ol.style.Circle({
       radius: 30, stroke: new ol.style.Stroke({
       color: '#fff' }), fill: new ol.style.Fill({
       color: '#969696' }) }), text: new ol.style.Text({
       text: size.toString(), fill: new ol.style.Fill({
       color: '#fff' }) }) }); } // Dynamic style styles,Calculated according to weight and quantity var varyStyle = function (feature) {
       var originalFeatures = feature.get('features'); var size = feature.get('features').length; var capability_avg = 0; var textName = ""; var j = (void 0), jj = (void 0); for (j = 0, jj = originalFeatures.length; j < jj; ++j) {
       capability_avg += (originalFeatures[j].get("capability") || 1) textName = originalFeatures[j].get("name") || ""; } capability_avg = (capability_avg / size).toFixed(2); var round = getPointArray(capability_avg); var opacity = Math.min(0.8, 0.4 + (size / maxFeatureCount)); var style = new ol.style.Style({
       image: new ol.style.Circle({
       radius: feature.get('radius'), fill: new ol.style.Fill({
       color: colorToRgb(round.split(",")[1], opacity) }) }), text: new ol.style.Text({
       // text: textName ? (textName + ":" + capability_avg) : feature.get('radius'), text: "权重平均值:" + capability_avg, font: 'normal bold 14px Arial,sans-serif', fill: new ol.style.Fill({
       color: '#fff' }), stroke: new ol.style.Stroke({
       color: 'rgba(0, 0, 0, 0.6)', width: 3 }) }) }); return style; } // 单体 feature 样式 var featureStyle = function (feature) {
       var originalFeatures = feature.get('features'); if (originalFeatures.length != 1) {
       return; } var originalFeature = originalFeatures[0]; var style = originalFeature.getStyle(); style && style.setText( new ol.style.Text({
       text: originalFeature.get("name"), // 偏移 offsetX: 0, offsetY: -54, // 居中 textAlign: 'center', // 比例 scale: 1, textBaseline: 'middle', // 边距 padding: [2, 2, 2, 2], // 覆盖显示:即文字超过多边形也会显示 overflow: true, // 字体颜色 fill: new ol.style.Fill({
       color: 'rgba(51,51,51, 1)' }), // 字体边框,可以配合 fill 是文字高亮 stroke: new ol.style.Stroke({
       color: 'rgba(0, 255, 255, 0.8)', width: 2, }), // 背景色 backgroundFill: new ol.style.Fill({
       color: 'rgba(252,254,255, 1)' }), }) ) return style; } // 样式方法 function styleFunction(feature, resolution) {
       // If you are dragging the map,then the styles are not re-rendered if (resolution != currentResolution) {
       calculateClusterInfo(resolution); currentResolution = resolution; } var style; var size = feature.get('features').length || 0; // size大于1,Indicates that it is an aggregated state if (size > 1) {
       if (original == true) {
       style = originalStyle(feature); } else {
       style = varyStyle(feature); } // size 等于1,Indicates that it is a single unit feature } else if (size == 1) {
       style = featureStyle(feature); } return style; } // Computes aggregated graph style information var calculateClusterInfo = function () {
       if (!clusterLayer) {
       return; } maxFeatureCount = 0; var features = clusterLayer.getSource().getFeatures(); var feature, radius; for (var i = features.length - 1; i >= 0; --i) {
       feature = features[i]; var originalFeatures = feature.get('features'); // 计算权重 var capability = 0; var j = (void 0), jj = (void 0); for (j = 0, jj = originalFeatures.length; j < jj; ++j) {
       // 这是使用 capability The value of the custom attribute calculates the weight capability += (originalFeatures[j].get("capability") || 1) } // According to the actual amount of data,Adjusts the size of the aggregate display radius // PS:This requires updating the project to actually adjust if (originalFeatures.length < 10) {
       radius = capability + originalFeatures.length; while (radius > 100) {
       radius = radius / 10; } radius = radius + 10; } else if (originalFeatures.length >= 10 && originalFeatures.length <= 50) {
       radius = capability + originalFeatures.length; while (radius > 100) {
       radius = radius / 10; } radius = radius + 20; } else if (originalFeatures.length > 100 && originalFeatures.length <= 5000) {
       radius = capability + originalFeatures.length; while (radius > 100) {
       radius = radius / 10; } } else if (originalFeatures.length > 5000 && originalFeatures.length <= 10000) {
       radius = capability + originalFeatures.length; while (radius > 100) {
       radius = radius / 10; } } else if (originalFeatures.length > 10000) {
       radius = capability + originalFeatures.length; while (radius > 100) {
       radius = radius / 10; } radius = radius; } // 取二者最大值 maxFeatureCount = Math.max(maxFeatureCount, jj); feature.set('radius', radius); } }; // Get the aggregated graph color // 自定义颜色(The legend and colors are concatenated with commas) var getPointArray = function (v) {
       if (v >= 0.8 && v <= 1) return '0.8-1.0,#FF0000' else if (v >= 0.6 && v < 0.8) return '0.6-0.8,#FFFF00' else if (v >= 0.4 && v < 0.6) return '0.4-0.6,#DAA520' else if (v >= 0.2 && v < 0.4) return '0.2-0.4,#0000FF' else if (v >= 0 && v < 0.2) return '0-0.2,#228B22' } // Set the aggregation distance,That is, aggregation within a radius clusterSource.setDistance(distance); // 添加数据 vectorSource.addFeatures(features); // 设置样式 clusterLayer && clusterLayer.setStyle(styleFunction) } // Add aggregation graph // flag, true to load the original style,Others are loading weight styles function addCluster(flag) {
       closeCluster(); initCluster(); flag ? addData(features, 60, flag) : addData(features, 40); } // Close the aggregation graph function closeCluster() {
       clusterLayer && map.removeLayer(clusterLayer); clusterLayer = undefined; } // The original aggregated graph is loaded by default addCluster(true); // Start click event by default activateClickFunc(); </script>
<button id="addCluster" onClick="addCluster(true)">Add aggregation graph</button>
<button id="addWeightCluster" onClick="addCluster()">Add weight aggregation graph</button>
<button id="closeCluster" onClick="closeCluster()">Close the aggregation graph</button>
<button id="activateClickFunc" onClick="activateClickFunc()">Enable click event</button>
<button id="shutDownClick" onClick="shutDownClick()">关闭点击事件</button>
</body>
</html>
PS:Click the pop-up bubble for reference Openlayers 自定义气泡框以及定位到气泡框
在线示例
Openlayers 聚合图:Openlayers-cluster
边栏推荐
猜你喜欢
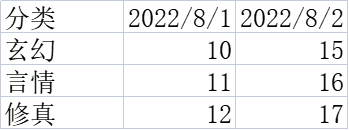
oracle数据库中列转行,列会有变化
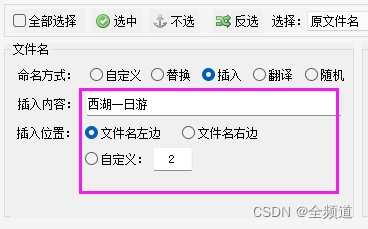
支持各种文件快速重命名最简单的小技巧
2.1-梯度下降
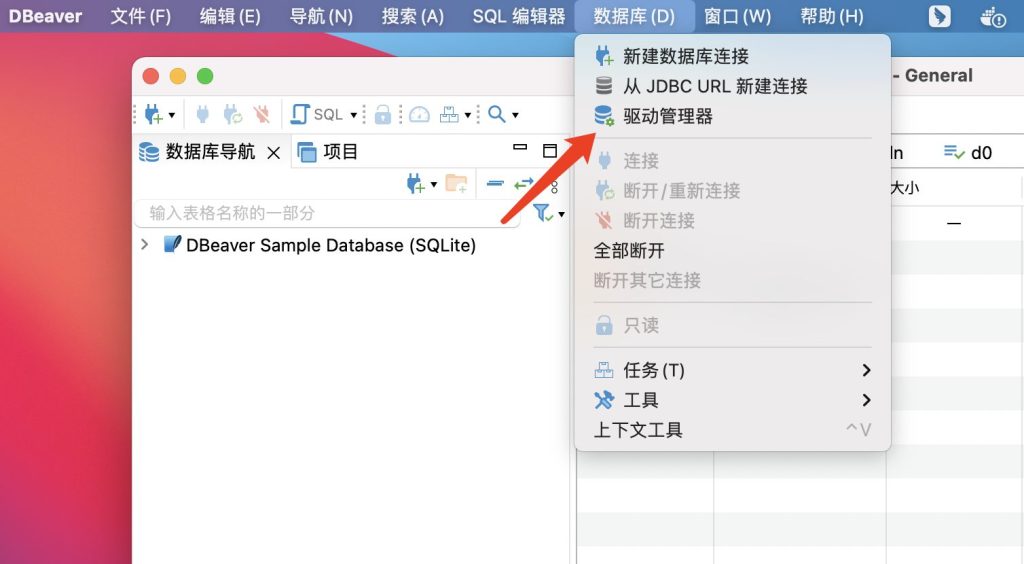
如何通过开源数据库管理工具 DBeaver 连接 TDengine
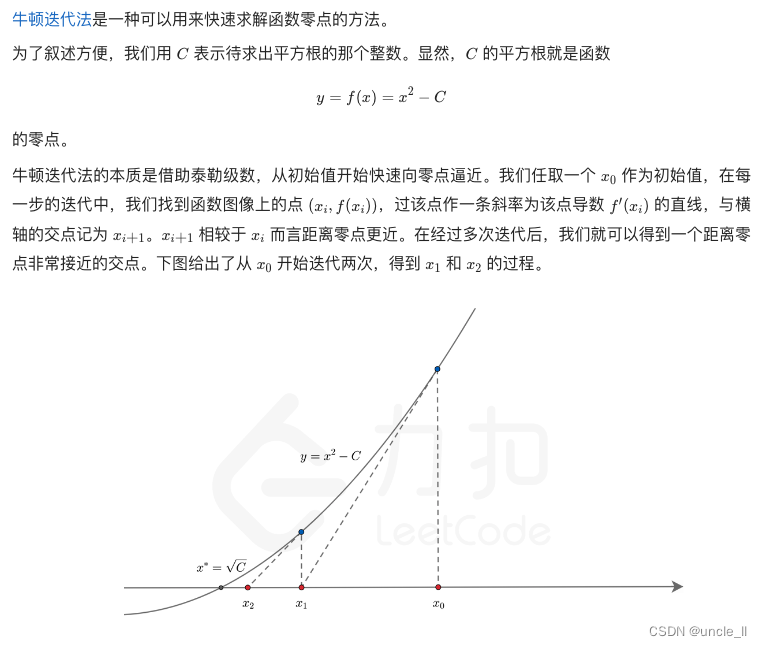
leetcode:69. x 的平方根
1106 2019 Sequence (15 points)

JRS303-数据校验
About # SQL problem: how to set the following data by commas into multiple lines, in the form of column display
JRS303-Data Verification
3.1-Classification-probabilistic generative model


随机推荐
1076 Wifi Password (15 points)
Four operations in TF
RestTemplate工具类
1071 Small Gamble (15 points)
机器学习(二)线性回归
2022年值得关注的NFT发展趋势
leetcode:69. x 的平方根
Evolution and New Choice of Streaming Structured Data Computing Language
Kaldi语音识别工具编译问题记录(踩坑记录)
剑指offer专项突击版第26天
麒麟V10系统打包Qt免安装包程序
The easiest trick to support quick renaming of various files
XXL-JOB 分布式任务调度中心搭建
go 操作MySQL之mysql包
零基础SQL教程: 主键、外键和索引 04
Nuget找不到包的问题处理
查找最新人员工资和上上次人员工资的变动情况
一根网线两台电脑传输文件
【实战系列】OpenApi设计规范
Two state forms of Service