当前位置:网站首页>Recommended search common evaluation indicators
Recommended search common evaluation indicators
2022-04-23 15:27:00 【moletop】
. The evaluation index
Common indicators ( Classification and regression ):
-
Accuracy rate :Accuracy=(TP+TN)/(TP+FP+TN+FN)
-
Accuracy ( Check accuracy )Precision=TP/(TP+FP), Recall rate ( Check all )Recall=TP/(TP+FN)
-
F1 score(Fx fraction ,x Is the ratio of recall rate to accuracy rate )
F1 score=2·Precision·Recall/(Precision+Recall)
Take it all into consideration , Recall rate Recall And accuracy Precision The harmonic average of , Only in the recall rate Recall And accuracy Precision When both are high ,F1 score Will be very high .
-
ROC and PR curve
-
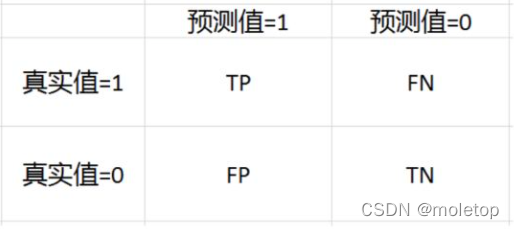
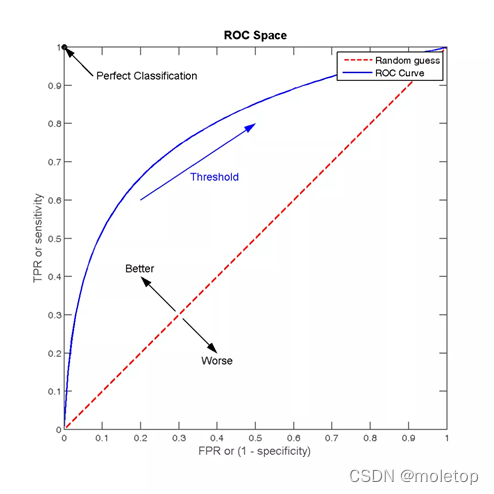
ROC The curve can be used to evaluate the performance of a classifier under different thresholds . stay ROC In the curve , The abscissa of each point is (FPR), The ordinate is TPR, Depicts the classifier in True Positive and False Positive The balance between .
-
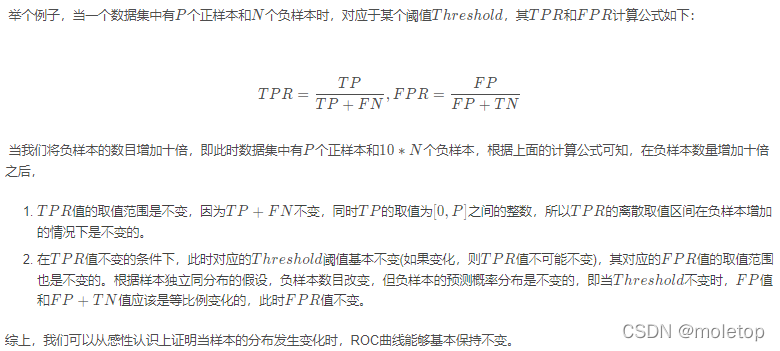
TPR=TP/(TP+FN), Represents the proportion of actual positive instances in all positive instances in the positive class predicted by the classifier .
FPR=FP/(FP+TN), Represents the proportion of actual negative instances in all negative instances in the positive class predicted by the classifier ,FPR The bigger it is , More negative classes in the predicted positive classes
-
AUC(Area Under Curve) by ROC The area under the curve , It represents a probability , The value of this area will not be greater than 1. Randomly select a positive sample and a negative sample ,AUC It represents the probability , The classifier will give a higher prediction value for the positive sample than the negative sample . The larger the area, the better , Greater than 0.5 It makes sense ,1 It's a perfect prediction , Less than 0.5 It means not even random prediction .
-
ROC The draw :
- Suppose that a series of samples have been classified into positive classes Score value , Sort by size .
- From high to low , In turn “Score” Value as threshold threshold, When the test sample belongs to a positive sample, the probability is greater than or equal to this threshold when , We think it's a positive sample , Otherwise, it is a negative sample . for instance , For a sample , Its “Score” The value is 0.6, that “Score” A value greater than or equal to 0.6 All samples are considered positive samples , Other samples are considered negative .
- Choose one different... At a time threshold, Get a group of FPR and TPR, With FPR The values are abscissa and TPR The value is the ordinate , namely ROC A point on the curve .
-
4 There are two key points :
spot (0,0):FPR=TPR=0, It is predicted that all samples are negative samples ;
spot (1,1):FPR=TPR=1, All samples are positive predictions ;
spot (0,1):FPR=0, TPR=1, here FN=0 And FP=0, All samples are correctly classified ;
spot (1,0):FPR=1,TPR=0, here TP=0 And TN=0, Worst classifier , Avoided all the right answers
-
When the distribution of positive and negative samples in the test set changes ,ROC The curve can stay the same
For example, the number of negative samples increases to the original 10 times ,TPR Unaffected ,FPR It's also proportionally increased , It won't change much . So the unbalanced sample problem is usually chosen as ROC As a standard of evaluation .
-
-
PR curve :
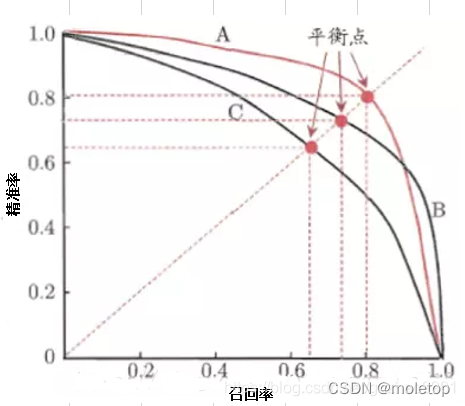
- Drawing method and ROC equally , Take different thresholds , Calculate... For all samples p and r.
- F1 = 2 * P * R /( P + R ). Balance point (BEP) yes P=R The value of time ( The slope is 1)
-
-
MAE( Mean absolute error ) and MSE( Mean square error )
- MSE Fast convergence , Sensitive to outliers . Because its punishment is square , So the of outliers loss It will be very big.
- MAE Compare with MSE, There is no function of the square term , The punishment for all training data is the same . Maybe because the gradient value is small , Make the model fall into local optimum
Search and recommend indicators :
-
IOU( In target detection , In the field of image segmentation , Defined as the ratio of the intersection and union of the areas of two rectangular boxes ,IoU=A∩B/A∪B). If it overlaps completely , be IoU be equal to 1, It's the ideal situation . Generally in the detection task ,IoU Greater than or equal to 0.5 I think the recall , If set higher IoU threshold , The recall rate decreases , At the same time, the positioning box is more accurate .
-
AP and mAP
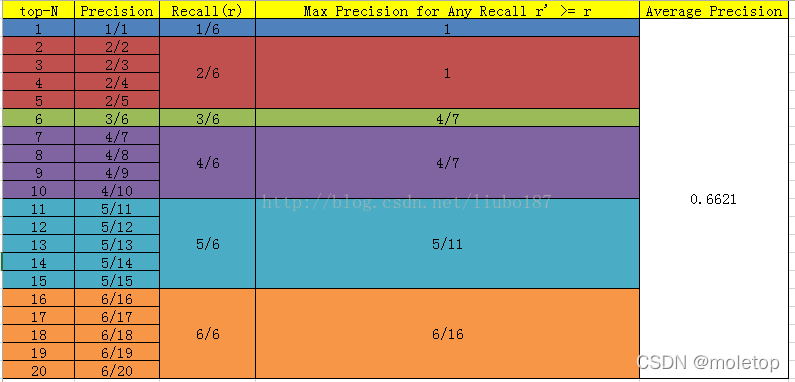
AP:average precision, After ranking the scores , from rank1 To rankn. Corresponding to each recall node Maximum accuracy , Then take the average to get AP.
Be careful :AP The previous calculation invention method : Make N It's all id, If from top-1 To top-N Count them all , The corresponding precision and recall, With recall Abscissa ,precision Vertical coordinates , The... Used in the detection is obtained precision-recall curve , Although the overall trend and significance are related to precision-recall The curves are the same , The calculation method is very different . In the classification pr It is to set different thresholds to determine the next value of all samples p and r, there AP After determining the threshold , from top1 To topN Count them all , Get current topx Of p and r.
MAP: Conduct N The average number of search results , Generally, all categories will be searched to calculate , Just like the calculation method of multi label image classification .
AP It measures the quality of the learned model in a category ,mAP It measures the quality of the model in all categories .
-
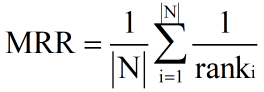
MRR(mean reciprocal rank) Average reciprocal ranking
- RR, Countdown ranking , It refers to the reciprocal of the ranking of the first relevant document in the search results .
- MRR The mean value of the reciprocal ranking of multiple queries , The formula is as follows :ranki It means the first one i Ranking of the first relevant document of a query .
-
NDCG( It is also recommended to use )
-
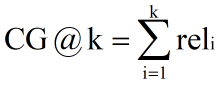
CG,Cumulative Gain) Cumulative benefits , k Express k A collection of documents ,rel It means the first one i The relevance of a document
-
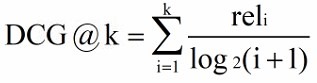
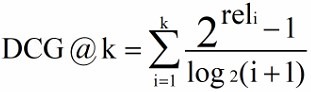
DCG(Discounted Cumulative Gain) stay CG The location information is not taken into account in the calculation of , For example, the relevance of the retrieved three documents is (3,-1,1) and (-1,1,3), according to CG The ranking is the same , But obviously the former is in a better order . So you need to be in CG On the basis of calculation, add the calculation of location information , Introduce discount factor . According to the increment of position , The corresponding decline in value .
-
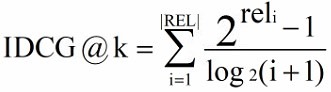
IDCG(ideal DCG) Ideally , Sort according to the degree of correlation from large to small , And then calculate DCG When the maximum value can be obtained . among |REL| Indicates that documents are sorted according to their relevance from large to small , Take before k A collection of documents .
-
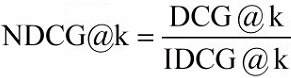
NDCG(Normalized DCG)
Because the length of the result document set that can be retrieved by each query is inconsistent ,k Different values will affect DCG Calculated results of . Therefore, you can't simply query different DCG The results were averaged , Need to normalize first .NDCG Is the use IDCG Normalize it , Represents the current DCG And ideally IDCG How different .
 * Hit ratio The denominator is all the test sets , The molecule is before each user K The sum of the numbers belonging to the test set , This measure is the recall rate , The bigger the index, the better .
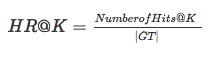
-
版权声明
本文为[moletop]所创,转载请带上原文链接,感谢
https://yzsam.com/2022/04/202204231523160791.html
边栏推荐
- 通過 PDO ODBC 將 PHP 連接到 MySQL
- Crawling fragment of a button style on a website
- Subnet division of flannel principle
- Leetcode学习计划之动态规划入门day3(198,213,740)
- Byte interview programming question: the minimum number of K
- Kubernetes详解(十一)——标签与标签选择器
- GFS distributed file system (Theory)
- PSYNC synchronization of redis source code analysis
- Node.js ODBC连接PostgreSQL
- 服务器中毒了怎么办?服务器怎么防止病毒入侵?
猜你喜欢
T2 iCloud日历无法同步
深度学习——超参数设置
Detailed explanation of kubernetes (XI) -- label and label selector
Tun model of flannel principle
MySQL InnoDB transaction
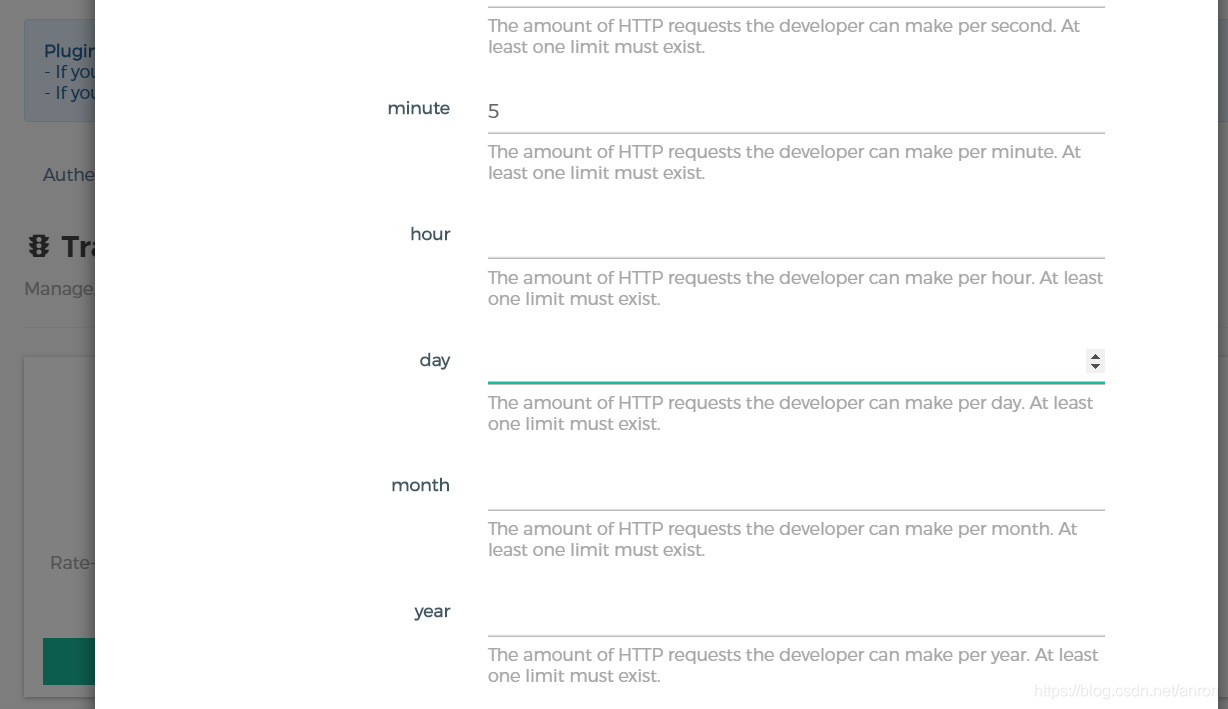
API gateway / API gateway (III) - use of Kong - current limiting rate limiting (redis)

How to use OCR in 5 minutes
The wechat applet optimizes the native request through the promise of ES6
UML learning_ Day2
Tun equipment principle
随机推荐
函数(第一部分)
YML references other variables
Llvm - generate for loop
Summary of interfaces for JDBC and servlet to write CRUD
MySQL query library size
MultiTimer v2 重构版本 | 一款可无限扩展的软件定时器
C language super complete learning route (collection allows you to avoid detours)
php类与对象
电脑怎么重装系统后显示器没有信号了
Reptile exercises (1)
MySQL Basics
木木一路走好呀
Squid agent
Kubernetes详解(九)——资源配置清单创建Pod实战
Have you learned the basic operation of circular queue?
Leetcode学习计划之动态规划入门day3(198,213,740)
Explanation 2 of redis database (redis high availability, persistence and performance management)
My raspberry PI zero 2W tossing notes record some problems encountered and solutions
Elk installation
JS - implémenter la fonction de copie par clic