当前位置:网站首页>LeetCode 232、用栈实现队列
LeetCode 232、用栈实现队列
2022-04-23 20:23:00 【亡于灬】
232、用栈实现队列
1)题目描述
请你仅使用两个栈实现先入先出队列。队列应当支持一般队列支持的所有操作(push、pop、peek、empty):
实现 MyQueue 类:
void push(int x)将元素 x 推到队列的末尾int pop()从队列的开头移除并返回元素int peek()返回队列开头的元素boolean empty()如果队列为空,返回true;否则,返回false
说明:
- 你 只能 使用标准的栈操作 —— 也就是只有
push to top,peek/pop from top,size, 和is empty操作是合法的。 - 你所使用的语言也许不支持栈。你可以使用 list 或者 deque(双端队列)来模拟一个栈,只要是标准的栈操作即可。
示例 1:
输入:
["MyQueue", "push", "push", "peek", "pop", "empty"]
[[], [1], [2], [], [], []]
输出:
[null, null, null, 1, 1, false]

解释:
MyQueue myQueue = new MyQueue();
myQueue.push(1); // queue is: [1]
myQueue.push(2); // queue is: [1, 2] (leftmost is front of the queue)
myQueue.peek(); // return 1
myQueue.pop(); // return 1, queue is [2]
myQueue.empty(); // return false
提示:
1 <= x <= 9- 最多调用
100次push、pop、peek和empty - 假设所有操作都是有效的 (例如,一个空的队列不会调用
pop或者peek操作)
2)分析
由于栈是先进后出,队列是先进先出,可以使用两个栈来实现顺序的调换。
3)C++代码
class MyQueue {

public:
    stack<int> s1;
    stack<int> s2;
    MyQueue() {


    }

    void push(int x) {

        s1.push(x);
    }

    int pop() {

        if(s2.empty()){

            while(!s1.empty()){

                s2.push(s1.top());
                s1.pop();
            }
        }
        int res=s2.top();
        s2.pop();
        return res;
    }

    int peek() {

        if(s2.empty()){

            while(!s1.empty()){

                s2.push(s1.top());
                s1.pop();
            }
        }
        int res=s2.top();
        return res;
    }

    bool empty() {

        return s1.empty()&&s2.empty();
    }
};

/** * Your MyQueue object will be instantiated and called as such: * MyQueue* obj = new MyQueue(); * obj->push(x); * int param_2 = obj->pop(); * int param_3 = obj->peek(); * bool param_4 = obj->empty(); */
版权声明
本文为[亡于灬]所创,转载请带上原文链接,感谢
https://blog.csdn.net/qq_38342510/article/details/124360499
边栏推荐
- 【PTA】L1-002 打印沙漏
- NC basic usage 1
- ArcGIS js api 4. X submergence analysis and water submergence analysis
- [latex] 5 how to quickly write out the latex formula corresponding to the formula
- 【PTA】整除光棍
- Automatically fill in body temperature and win10 task plan
- Sqoop imports data from Mysql to HDFS using lzop compression format and reports NullPointerException
- WordPress插件:WP-China-Yes解决国内访问官网慢的方法
- BMP JPEG 图片转换为矢量图像 ContourTrace
- Analysis of the relationship between generalized Bim and CAD under the current background
猜你喜欢
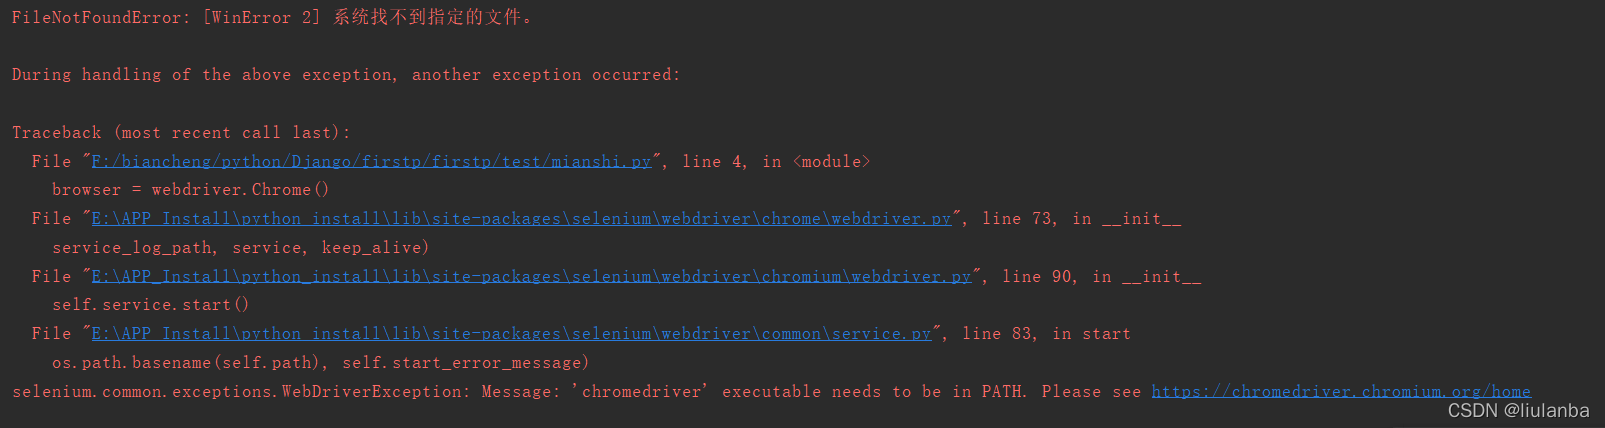
selenium.common.exceptions.WebDriverException: Message: ‘chromedriver‘ executable needs to be in PAT
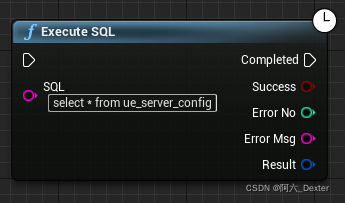
SQL Server Connectors By Thread Pool | DTSQLServerTP plugin instructions
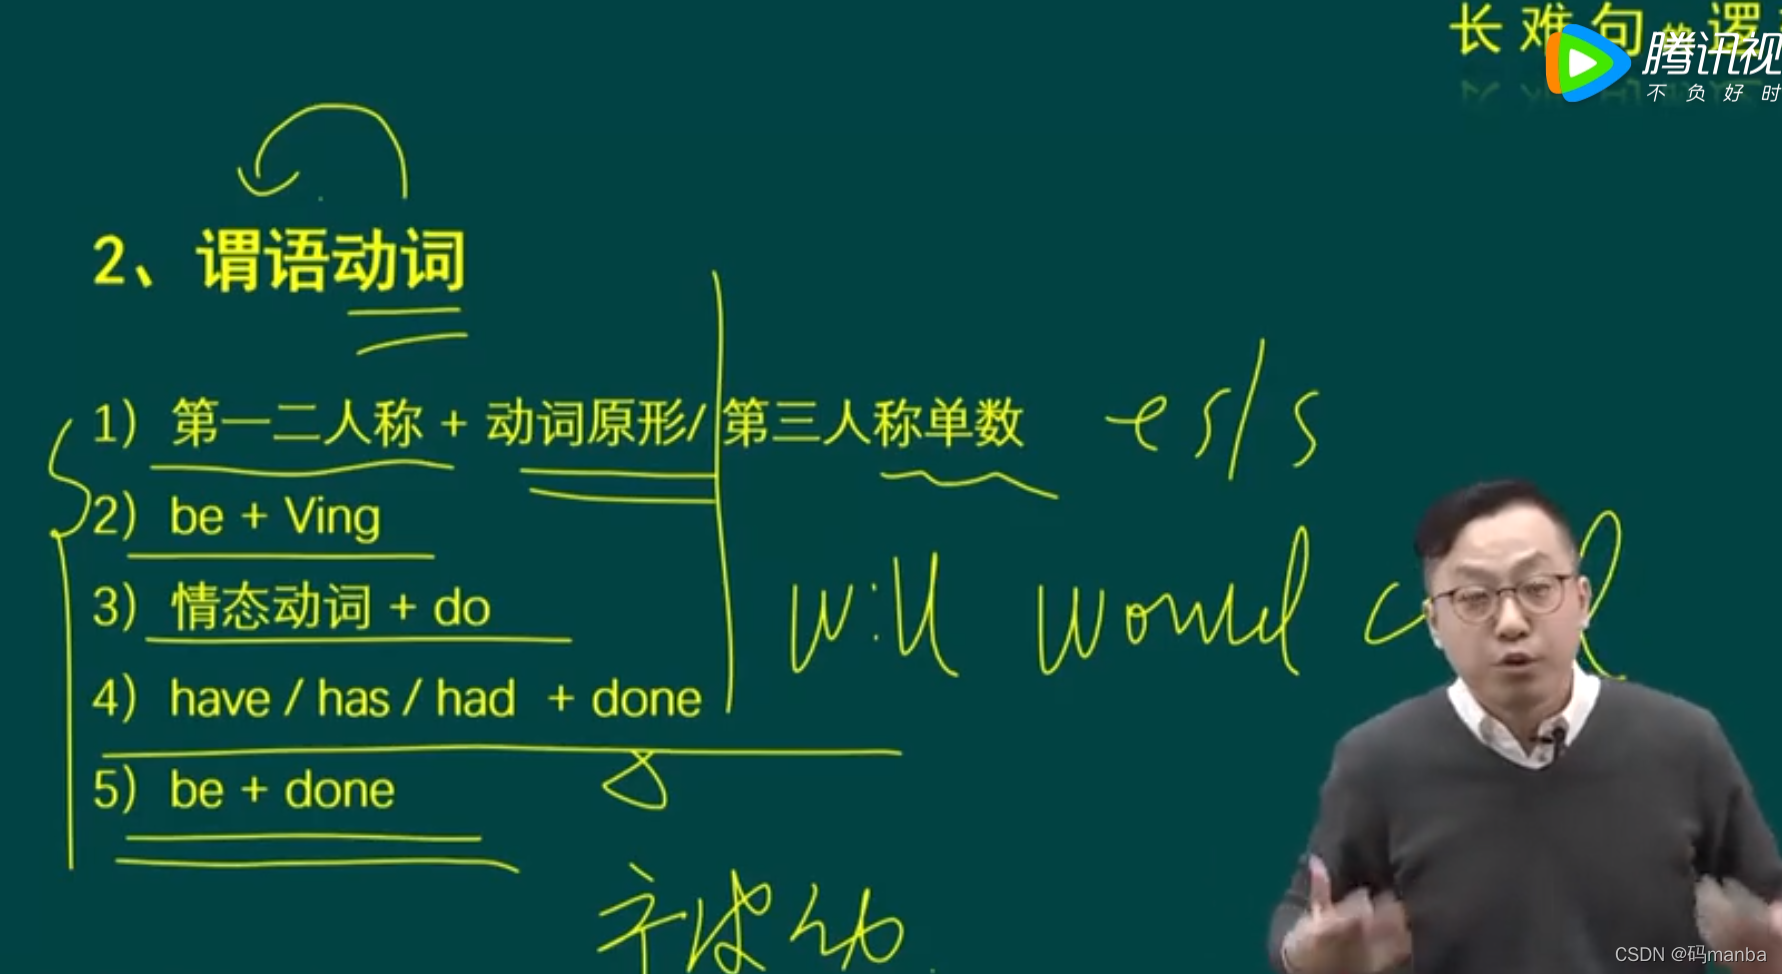
Notes of Tang Shu's grammar class in postgraduate entrance examination English
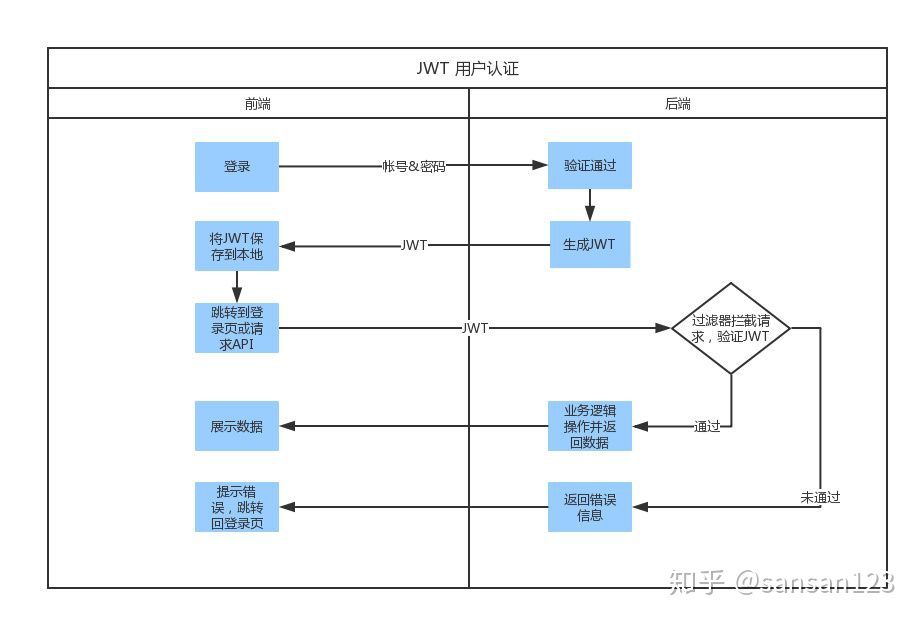
Five minutes to show you what JWT is

Zdns was invited to attend the annual conference of Tencent cloud basic resources and share the 2020 domain name industry development report

Matlab analytic hierarchy process to quickly calculate the weight
![[latex] 5 how to quickly write out the latex formula corresponding to the formula](/img/1f/3c5a332ce1d6852dde38040faea5bf.png)
[latex] 5 how to quickly write out the latex formula corresponding to the formula

上海回应“面粉官网是非法网站”:疏于运维被“黑”,警方已立案
Commit and ROLLBACK in DCL of 16mysql
16MySQL之DCL 中 COMMIT和ROllBACK
随机推荐
Es index (document name) fuzzy query method (database name fuzzy query method)
Modeling based on catiav6
Scripy tutorial - (2) write a simple crawler
Cadence Orcad Capture 批量更改元件封装功能介绍图文教程及视频演示
Installation and use of NVM
PCL点云处理之计算两平面交线(五十一)
Commit and ROLLBACK in DCL of 16mysql
NC basic usage 2
Local call feign interface message 404
RT-1052学习笔记 - GPIO架构分析
Linux64Bit下安装MySQL5.6-不能修改root密码
WordPress插件:WP-China-Yes解决国内访问官网慢的方法
Handwritten Google's first generation distributed computing framework MapReduce
Remote code execution in Win 11 using wpad / PAC and JScript
R language survival package coxph function to build Cox regression model, ggrisk package ggrisk function and two_ Scatter function visualizes the risk score map of Cox regression, interprets the risk
The R language uses the timeroc package to calculate the multi time AUC value of survival data without competitive risk, and uses the confint function to calculate the confidence interval value of mul
JDBC tool class jdbcconutil gets the connection to the database
Matlab analytic hierarchy process to quickly calculate the weight
16MySQL之DCL 中 COMMIT和ROllBACK
R language ggplot2 visualization: ggplot2 visualizes the scatter diagram and uses geom_ mark_ The ellipse function adds ellipses around data points of data clusters or data groups for annotation