当前位置:网站首页>Introduction to program debugging and its use
Introduction to program debugging and its use
2022-08-10 15:21:00 【Seven, seven.】
Article table of contents
Debug
First, the concept of program debugging
Program debugging is the process of testing
, correcting syntax errors and logic errors by hand or compiling the program before putting it into actual operation.
Second, program debugging steps
1. Find the existence of program errors.
2. Locate the found error
3. Find out the cause of the error
4. Correct the error
5. Re-test the corrected program
Third, debugging in Windows environment
We use VS to debug in the Windows environment, and gdb in the linux environment.Debugging on VS is divided into two versions: Debug version and release version.
Debug version contains program debugging information without optimization.
The release version has carried out various optimizations to the program, so that the size and speed of the program code have been improved.Mainly for user use.
You can compare the running size of the two versions, as shown in the figure: 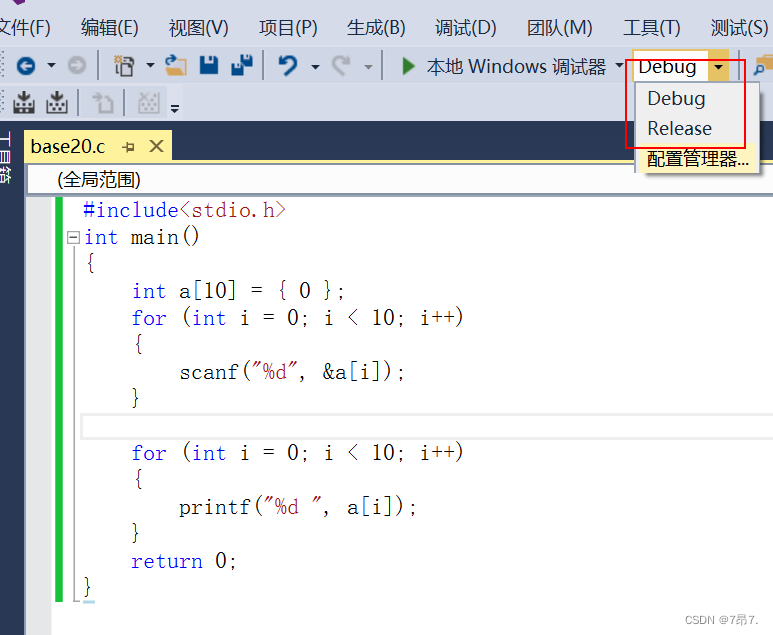
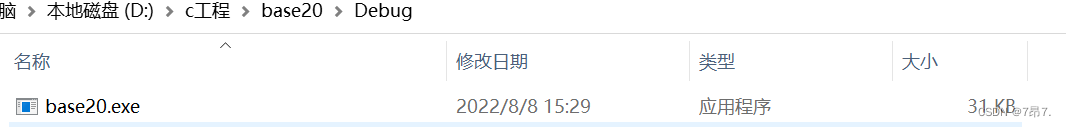
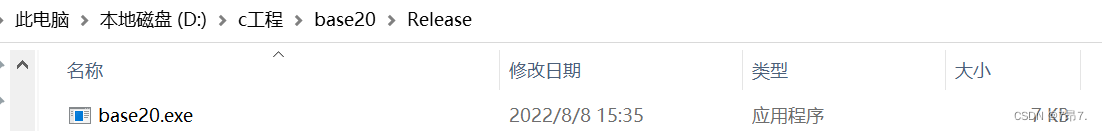
Obviously debug is much bigger than release.Normal debugging can only be performed under the debug version.
Fourth, debugging shortcuts
F5: Start debugging, often used to jump directly to the next breakpoint.
F9: The important role of creating breakpoints and canceling breakpoints. Breakpoints can be set anywhere in the program.In this way, the program can be stopped at the desired position at will, and then executed step by step.
F10: by procedure, used to process a procedure can be a function call, or a statement.
F11: statement by statement, execute a statement each time, this shortcut key can make our execution logic enter the function.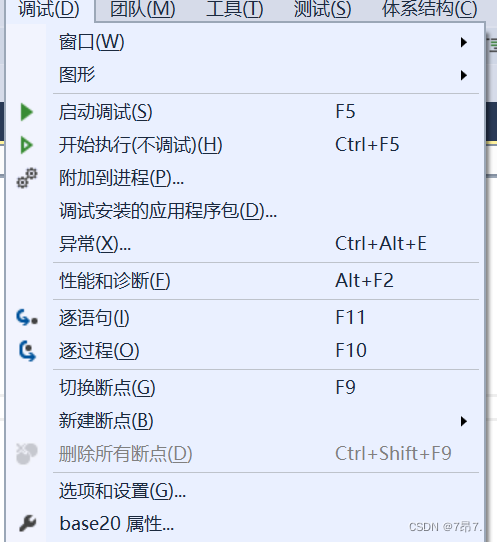
5. What debugging can do
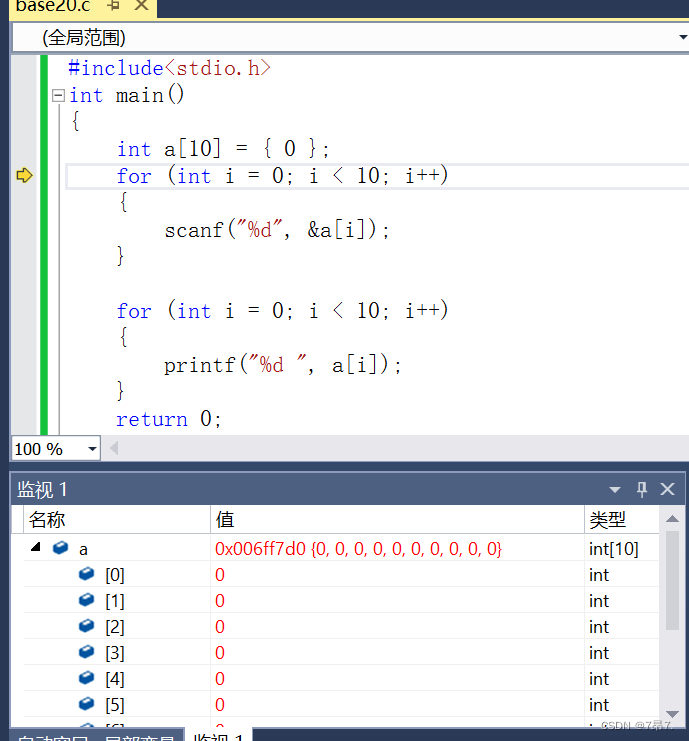
1. View the value of the temporary variable
Enter debugging, initialize the a array to 0 in the code as shown in the figure, and enter a in the monitor, and the values from 0 to 9 will be initialized to 0 as shown in the figure: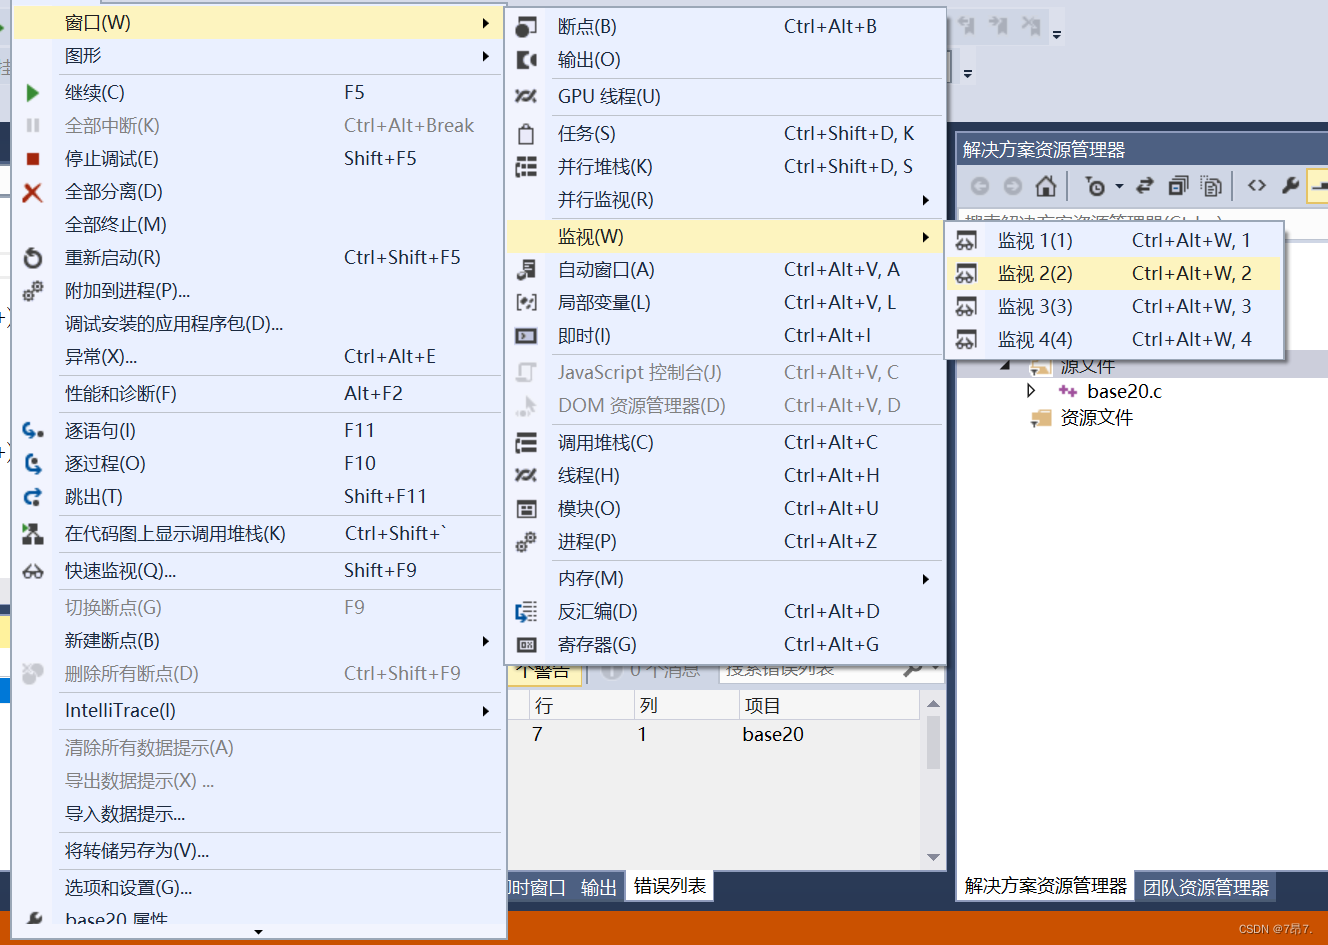
2. View memory information
Enter a in the memory to display the addresses of these 10 numbers: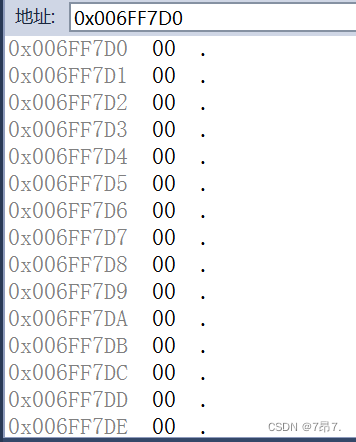
Of course, you can also see &a in the monitor, for example, enter &a[1], &a[9].As shown: 
3. View the call stack
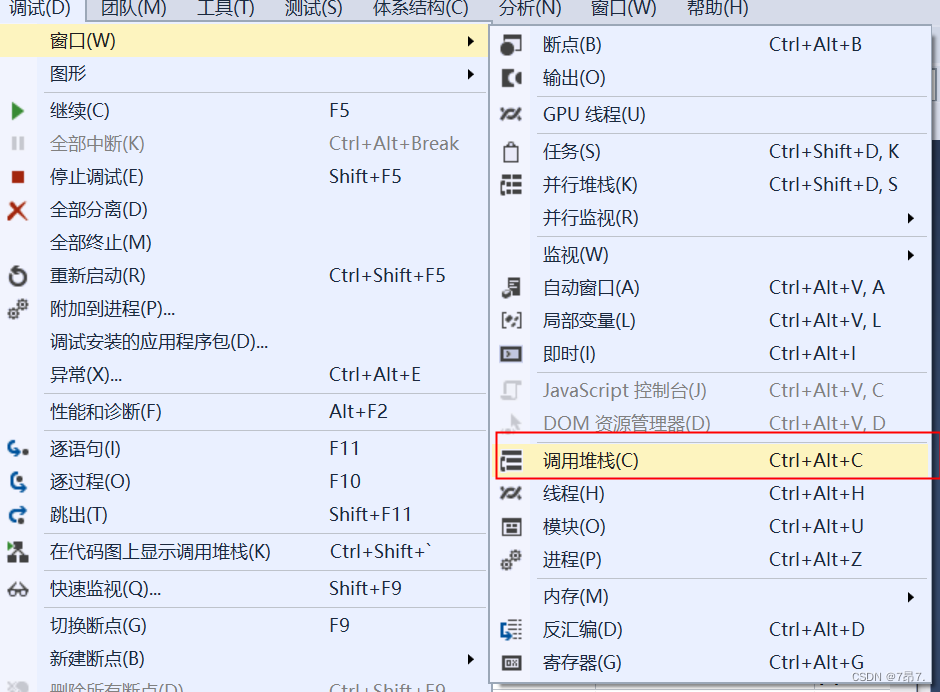
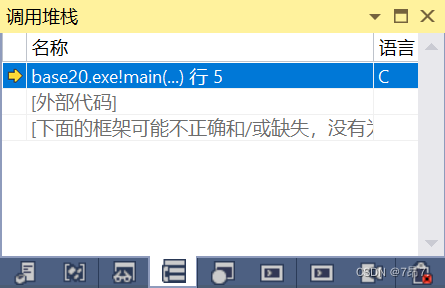
From the picture, we can see that the program only calls one main function.
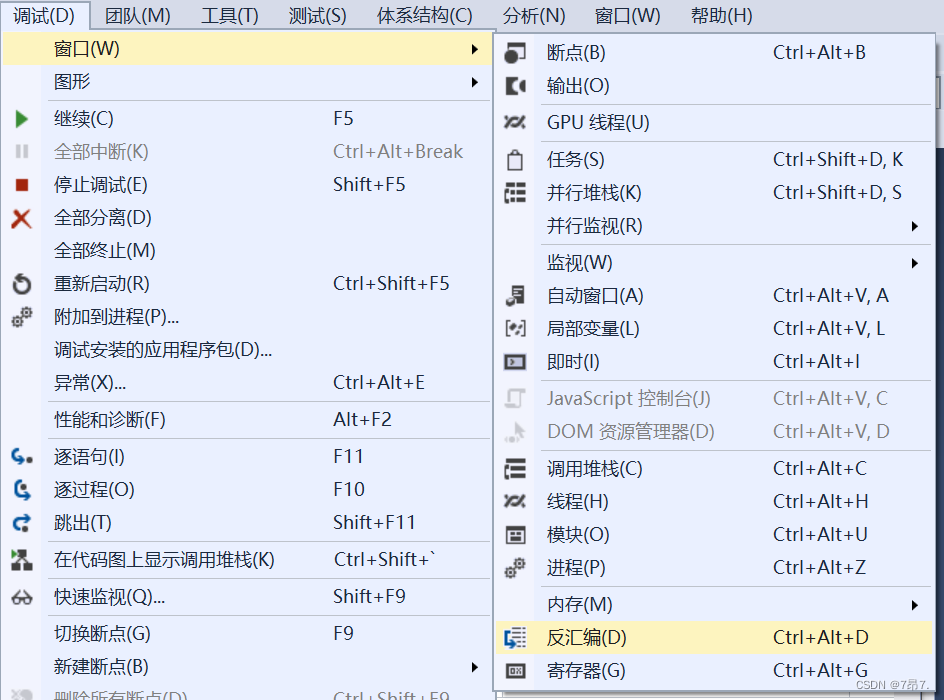
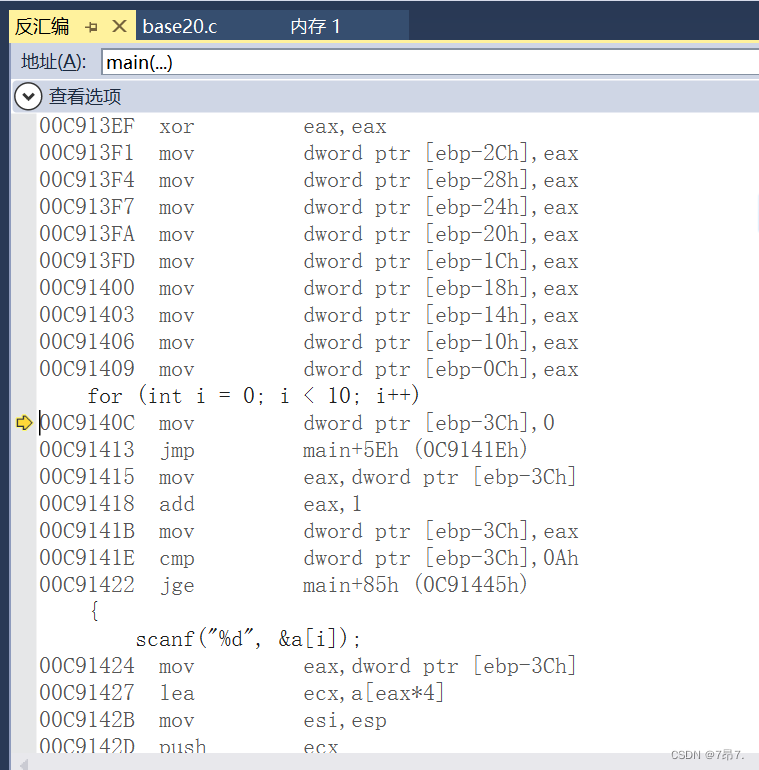
4. View assembly information
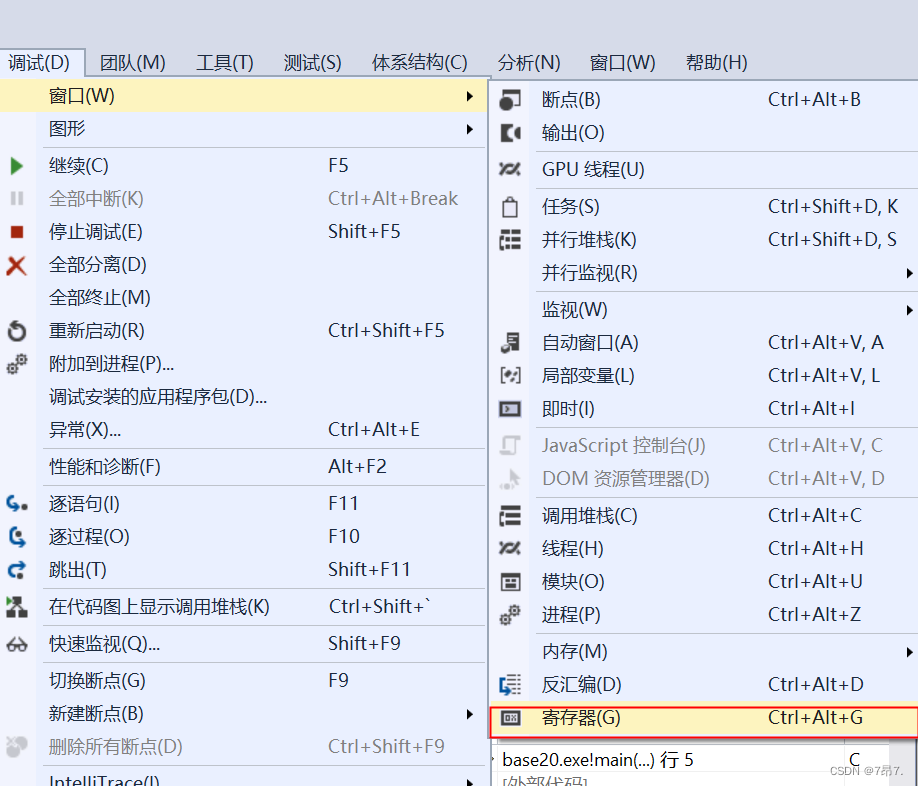
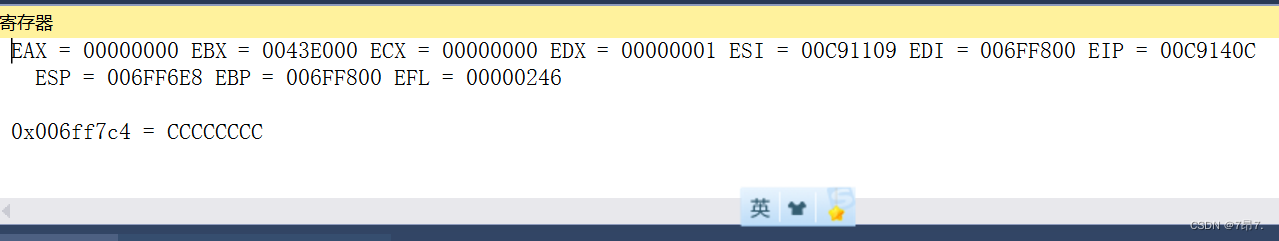
5. View register information
6. Common compilation errors
(1), compilation error
Look directly at the error message in the box below, or solve it with your own experience
(2), link error
Look at the error message and find the identifier in the error message in the code. Generally, the identifier name does not exist or is misspelled. For example, main is written as mian or a non-existent function name is written.
(3), runtime error
This is relatively hard to find and requires debugging to gradually locate the error.
边栏推荐
- High-paid programmers & interview questions series 135 How do you understand distributed?Do you know CAP theory?
- 基于inotify实现落盘文件的跨进程实时读写交互
- 强意识 压责任 安全培训筑牢生产屏障
- Custom picker scroll selector style
- LeetCode_2598_剑指Offer Ⅱ 091.粉刷房子
- SWIG教程《二》
- Azure IoT 合作伙伴技术赋能工作坊:IoT Dev Hack
- 王学岗————直播推流(软便)03x264集成与camera推流
- 符合信创要求的堡垒机有哪些?支持哪些系统?
- 正则表达式(包含各种括号,echo,正则三剑客以及各种正则工具)
猜你喜欢


随机推荐
"NIO Cup" 2022 Nioke Summer Multi-School Training Camp 7
软件测试用例篇
使用Uiautomator2进行APP自动化测试
Understanding_Data_Types_in_Go
How to code like a pro in 2022 and avoid If-Else
中学数学建模书籍及相关的视频等(2022.08.09)
640. Solving Equations: Simple Simulation Problems
奢侈品鉴定机构小程序开发制作功能介绍
Unfinished mathematics test paper ----- test paper generator (Qt includes source code)
SWIG教程《一》
从全球价值链视角看,京东云数智供应链对未来经济有何影响?
第五讲 测试技术与用例设计
基于ArcGIS水文分析、HEC-RAS模拟技术在洪水危险性及风险评估
Problem solving-->Online OJ (19)
2022年网络安全培训火了,缺口达95%,揭开网络安全岗位神秘面纱
TestLink导出用例转换工具
字节终面:CPU 是如何读写内存的?
List集合
How is the monthly salary table stored in the database?Ask for a design idea
易观分析联合中小银行联盟发布海南数字经济指数,敬请期待!