当前位置:网站首页>Jvm. Profiling tools (jconsole, jvisualvm, arthas, jprofiler, mat)
Jvm. Profiling tools (jconsole, jvisualvm, arthas, jprofiler, mat)
2022-08-11 00:20:00 【idle cat】
JVM commands
The most commonly used commands when locating and troubleshooting problems include: jps (process), jmap (memory), jstack (thread), jinfo (parameter), etc.
jps: Query all Java process information on the current machine
jmap: output memory of a Java process
jstack: print thread stack information of a Java thread
jinfo: for viewing jvm
JDK commands
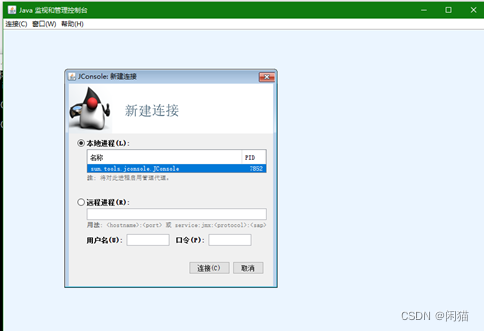
jconsole monitoring interface
window, cmd, directly enter jconsole and press Enter.
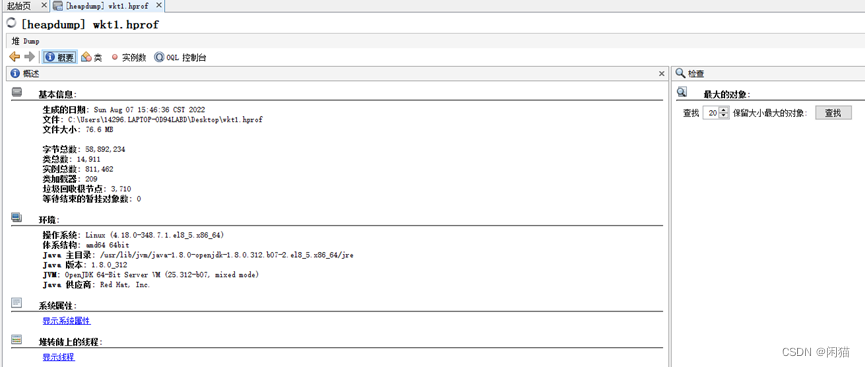
jvisualvm
Window visual interface, Ctr+R, CMD, enter jvisualvm and press Enter, after opening the main interface, click [Load] under [File]

Select file type: "Heap Dump..."

Click "Open"
 View the classes, you can see that different classes occupymemory size:
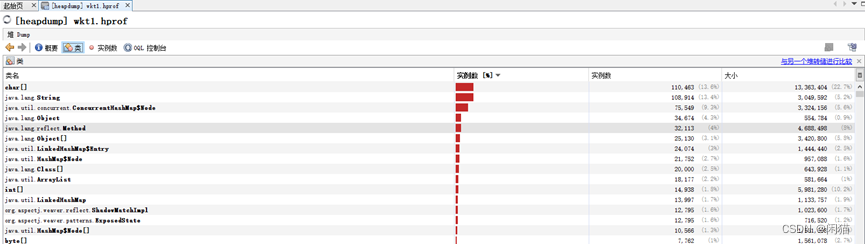
For example, click "java.lang.String" to enter to view the object:

The system is familiar with the parameters

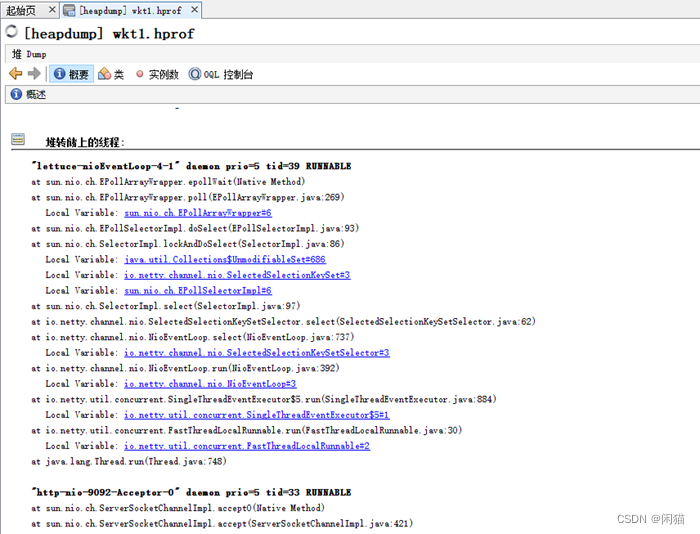
Thread
Arthas
Ali detection command tool
Ali open source product components, official website: Introduction| arthas

Third-party detection software
MAT
MAT (MemoryAnalyzerTool) is a memory analysis tool provided by Eclipse. As a relatively easy-to-use tool in Java memory analysis, mastering the basic usage of MAT is basically one of the most important basic skills in positioning problems.
Download:
Link: https://pan.baidu.com/s/1Qyy1bJQtosNlJ9VOt9GzVA
Extraction code: 8hgd
Directory after decompression:
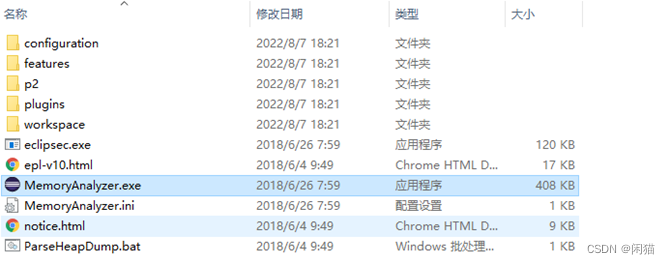
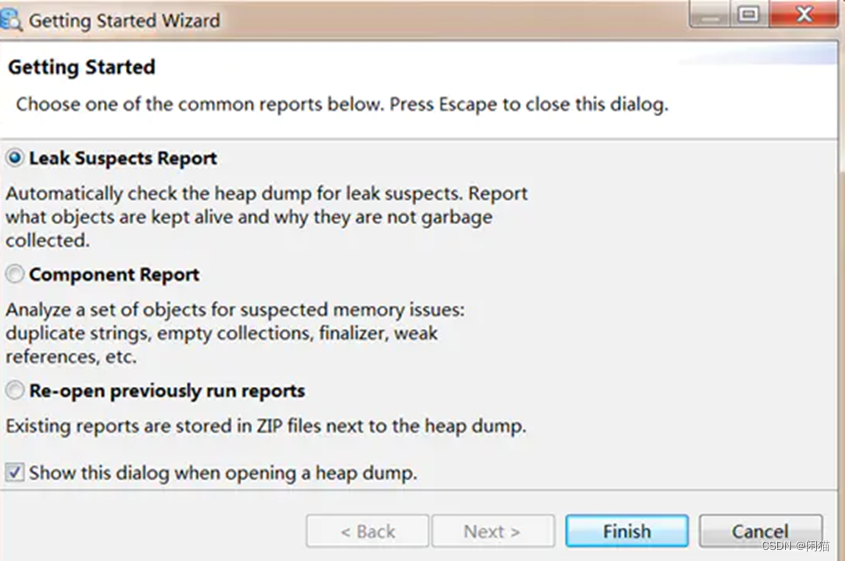
Main interface, open file, open heap dump...

Select the first one:
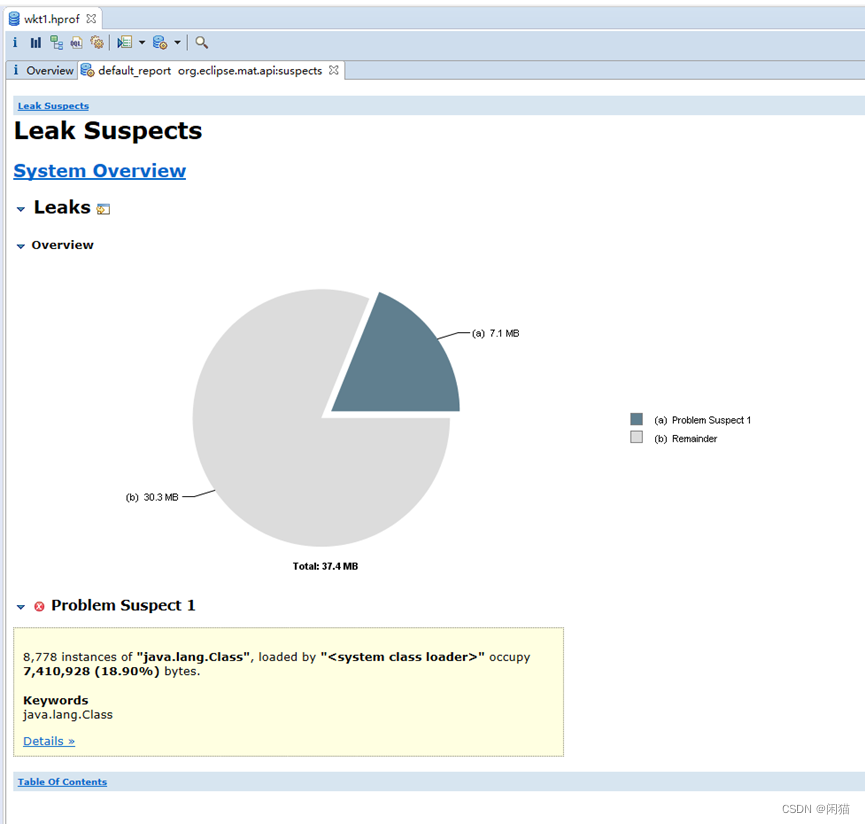
 Interface after loading:
Jprofiler
Visual analysis tools under the window
Link: https://pan.baidu.com/s/13o34g0OCueqp_7Mn-slj3A Extraction code: vgs2
Version: JProfiler 12.0.4
边栏推荐
- Easy-to-use translation plug-in - one-click automatic translation plug-in software
- Lens filter---about day and night dual-pass filter
- input输入框超出部分用省略号表示以及判断内容是否有超出(PC端)
- What is the ASIO4ALL
- 力扣------用栈操作构建数组
- NOR FLASH闪存芯片ID应用之软件保护场景
- 12. 处理 JSON
- [Excel knowledge and skills] Convert numeric format numbers to text format
- Mysql. Slow Sql
- [Excel knowledge and skills] Convert "false" date to "true" date format
猜你喜欢
工程师如何对待开源
虚拟电厂可视化大屏,深挖痛点精准减碳
![[Excel knowledge and skills] Convert text numbers to numeric format](/img/7e/16a068025ec2639b343436c7f5b245.png)
[Excel knowledge and skills] Convert text numbers to numeric format

① 数据库介绍 及 关系型数据库的关系代数表达式
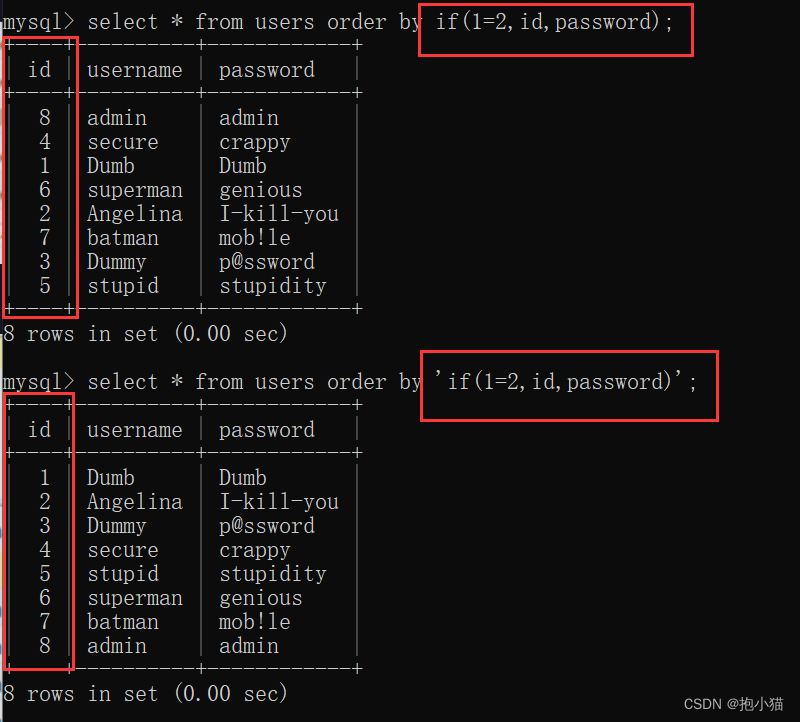
SQL injection base - order by injection, limit, wide byte
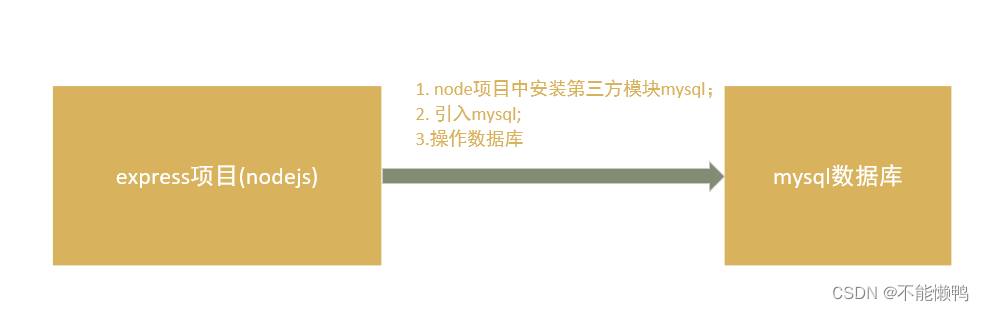
nodejs项目连接mysql数据库

Dump file generation, content, and analysis
3. 容器功能
报错:Client does not support authentication protocol requested by server; consider upgrading MySQL cli
![[Excel knowledge and skills] Convert numeric format numbers to text format](/img/fb/79d6928456f090d47f0fe7a5074979.png)
[Excel knowledge and skills] Convert numeric format numbers to text format
随机推荐
16. File upload
[Excel knowledge and skills] Convert text numbers to numeric format
PMP每日一练 | 考试不迷路-8.10(包含敏捷+多选)
如何做专利挖掘,关键是寻找专利点,其实并不太难
LeetCode_优先级队列_692.前K个高频单词
Which foreign language journals and conferences can be submitted for software engineering/system software/programming language?
地下管廊可视化管理系统搭建
“蔚来杯“2022牛客暑期多校训练营4 ADHK题解
【pypdf2】安装、读取和保存、访问页面、获取文本、读写元数据、加密解密
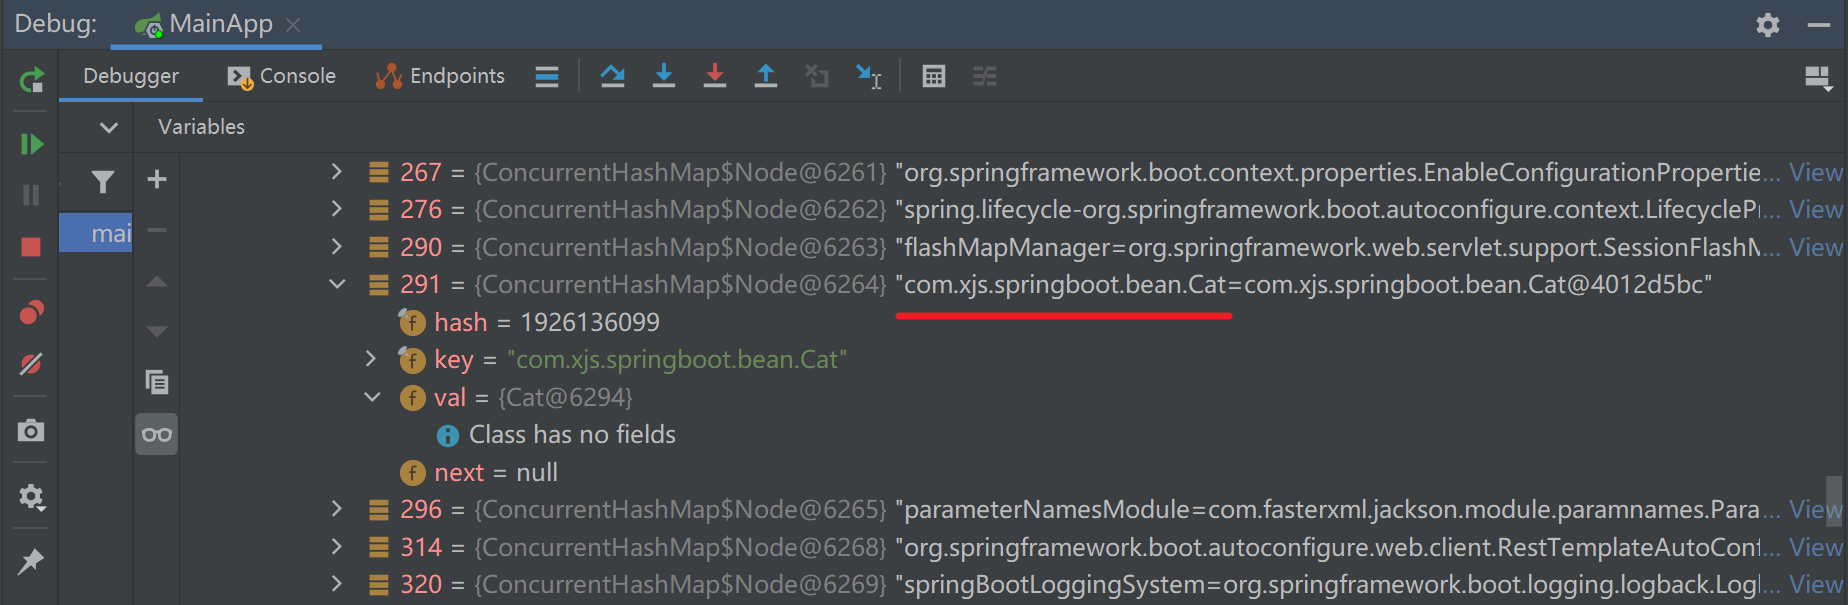
@Autowired注入RedisCache报错空指针
CF1427F-Boring Card Game【贪心】
Volatile和CAS
11. Custom Converter
微信小程序强制更新版本
力扣每日一题-第52天-387. 字符串中的第一个唯一字符
Analysis of LENS CRA and SENSOR CRA Matching Problems
百战RHCE(第四十八战:运维工程师必会技-Ansible学习3-构建Ansible清单)
Navicat 16-数据库工具
HGAME 2022 Week1 writeup
SQL injection base