当前位置:网站首页>Matplotlib tutorial 05 --- operating images
Matplotlib tutorial 05 --- operating images
2022-04-23 15:56:00 【KX-Lau】
List of articles
Welcome to the official account 【Python Developing actual combat 】, Get more !
Tools -matplotlib
Use matplotlib Can draw beautiful graphics .
stay matplotlib Read from 、 Generating and printing images is very simple .
Save image
Import matplotlib
import matplotlib
import matplotlib.pyplot as plt
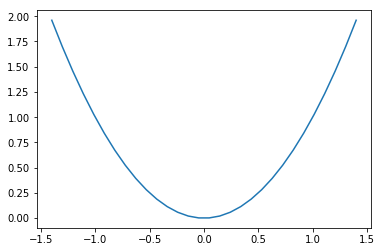
Saving graphics to disk is very simple , Just call savefig() function , And pass the saved name of the drawing . The graphics formats available depend on the graphics used .
plt.plot(x, x**2)
plt.savefig('my_square_function.png', transparent=True)
Read images
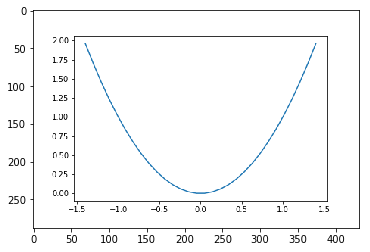
Just import matplotlib.image modular , And call imread() function , And pass the file name as a parameter , The image data will be displayed in numpy Array returns . Now read the square function saved before .
import matplotlib.image as mpimg

img = mpimg.imread('my_square_function.png')
print(img.shape, img.dtype)
(288, 432, 4) float32
The above results show that the loaded image is a 288×432 Of , Each pixel is represented by a four element array : Red 、 green 、 Blue and alpha, Stored as 0 To 1 Between 32 Bit floating point . Now call imshow() function .
plt.imshow(img)
plt.show()
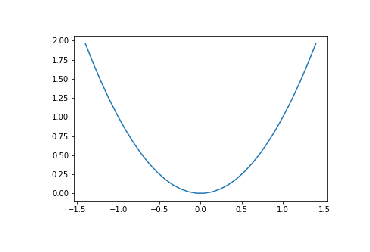
When displaying an image , It's better to hide the axis display .
plt.imshow(img)
plt.axis('off')
plt.show()
Generate the image
It's also easy to generate an image .
import numpy as np
img = np.arange(100*100).reshape(100, 100)
print(img)
plt.imshow(img)
plt.show()
[[   0    1    2 ...   97   98   99]
 [ 100  101  102 ...  197  198  199]
 [ 200  201  202 ...  297  298  299]
 ...
 [9700 9701 9702 ... 9797 9798 9799]
 [9800 9801 9802 ... 9897 9898 9899]
 [9900 9901 9902 ... 9997 9998 9999]]
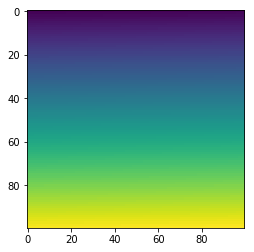
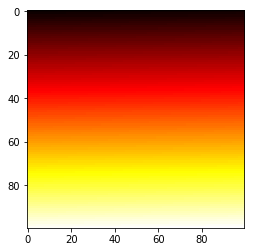
Because no RGB Level ,imshow() The function automatically maps the value to the color gradient , By default , Color gradient from blue ( Low value ) Turn red ( High value ), But you can choose other colors .
plt.imshow(img, cmap='hot')
plt.show()
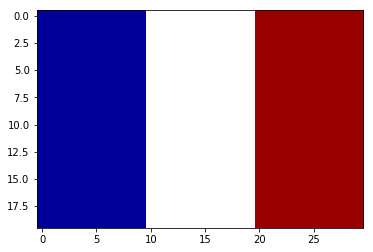
You can also directly generate a RGB Images .
img = np.empty((20, 30, 3))
img[:, :10] = [0, 0, 0.6]
img[:, 10:20] = [1, 1, 1]
img[:, 20:] = [0.6, 0, 0]
plt.imshow(img)
plt.show()
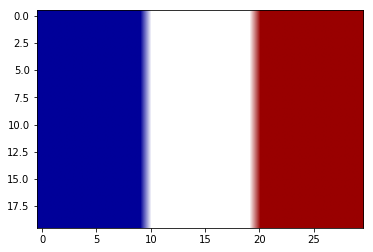
because img The array is very small (20×30), When imshow() When the function is displayed , Will increase the image to figure Size . Stretch the original image , A blank space is left between the original pixels . By default ,imshow() The function shades each blank pixel with the color of the nearest non blank pixel . This will produce a pixelated image . Different interpolation methods can also be used , Such as bilinear interpolation to fill the blank pixels , But this can lead to blurred edges , It may be better in some cases .
plt.imshow(img, interpolation='bilinear')
plt.show()
版权声明
本文为[KX-Lau]所创,转载请带上原文链接,感谢
https://yzsam.com/2022/04/202204231549498258.html
边栏推荐
- Redis主从复制过程
- Do we media make money now? After reading this article, you will understand
- Basic greedy summary
- C#,贝尔数(Bell Number)的计算方法与源程序
- R语言中绘制ROC曲线方法二:pROC包
- Intersection, union and difference sets of spark operators
- 贫困的无网地区怎么有钱建设网络?
- [split of recursive number] n points K, split of limited range
- Go concurrency and channel
- js正則判斷域名或者IP的端口路徑是否正確
猜你喜欢
IronPDF for .NET 2022.4.5455

Do we media make money now? After reading this article, you will understand
Partitionby of spark operator
一文读懂串口及各种电平信号含义

How can poor areas without networks have money to build networks?
Distinct use of spark operator
ESP32编译环境的搭建
贫困的无网地区怎么有钱建设网络?
Why disable foreign key constraints
多生成树MSTP的配置
随机推荐
Intersection, union and difference sets of spark operators
Single architecture system re architecture
Fastjon2他来了,性能显著提升,还能再战十年
现在做自媒体能赚钱吗?看完这篇文章你就明白了
布隆过滤器在亿级流量电商系统的应用
Config组件学习笔记
Vision of building interstellar computing network
Algorithem_ ReverseLinkedList
为啥禁用外键约束
Config learning notes component
Metalife established a strategic partnership with ESTV and appointed its CEO Eric Yoon as a consultant
js正则判断域名或者IP的端口路径是否正确
Treatment of idempotency
5 minutes, turn your excel into an online database, the magic cube net table Excel database
一文读懂串口及各种电平信号含义
IronPDF for . NET 2022.4.5455
C language self compiled string processing function - string segmentation, string filling, etc
糖尿病眼底病变综述概要记录
[self entertainment] construction notes week 2
shell_2