当前位置:网站首页>Function summary of drawing object arrangement in R language
Function summary of drawing object arrangement in R language
2022-04-23 15:53:00 【zoujiahui_ two thousand and eighteen】
List of articles
par(mfrow=c(n,m)) Basic mapping
par(mfrowc(n,m)) yes R Functions in basic drawing , Only basic mapping functions plot Objects that work
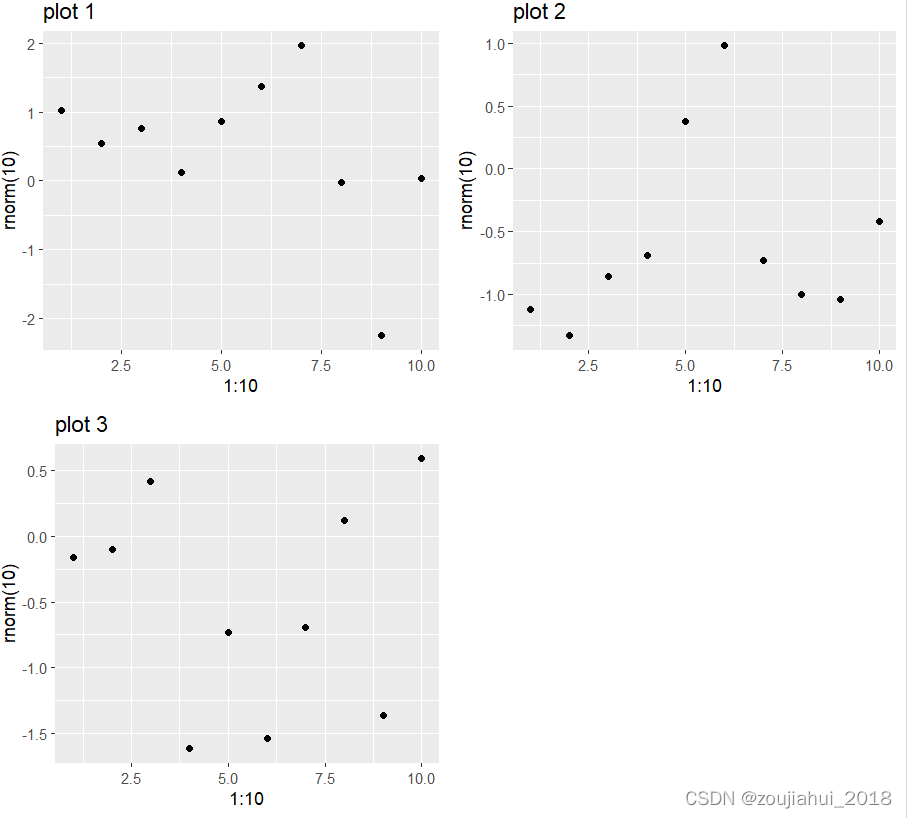
gridExtra::grid.arrange() in the light of ggplot object
grid.arrange() Function can only be used on ggplot Arrange objects
usage
#  All parameters
grid.arrange(..., grobs = list(...), layout_matrix, vp = NULL,
  name = "arrange", as.table = TRUE, respect = FALSE, clip = "off",
  nrow = NULL, ncol = NULL, widths = NULL, heights = NULL, top = NULL,
  bottom = NULL, left = NULL, right = NULL, padding = unit(0.5, "line"),newpage=TRUE)

# Common formats
grid.arrange(p1,p2,p3,...,ncol=n,nrow=m)
example
library(gridExtra)
library(ggplot2)
p1=qplot(1:10, rnorm(10), main=paste("plot", 1))
p2=qplot(1:10, rnorm(10), main=paste("plot", 2))
p3=qplot(1:10, rnorm(10), main=paste("plot", 3))
grid.arrange(p1,p2,p3,nrow=2,ncol=2)
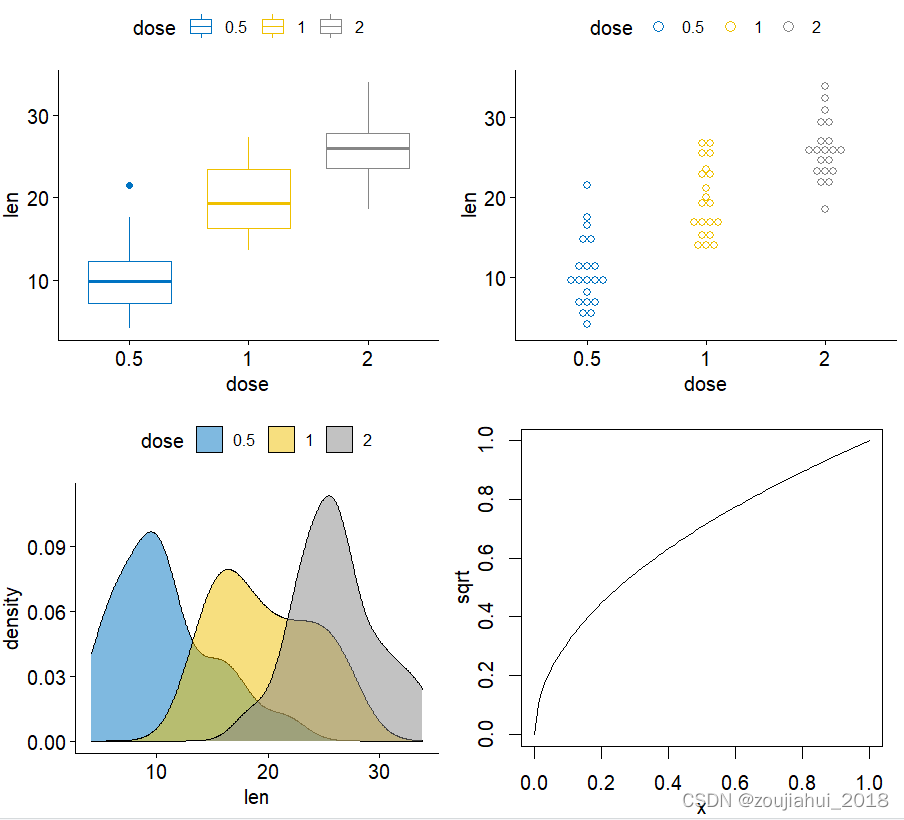
ggpubr::ggarrange() Treatable ggplot Object and foundation plot object
usage
ggarrange(
  ...,
  plotlist = NULL,
  ncol = NULL,
  nrow = NULL,
  labels = NULL,
  label.x = 0,
  label.y = 1,
  hjust = -0.5,
  vjust = 1.5,
  font.label = list(size = 14, color = "black", face = "bold", family = NULL),
  align = c("none", "h", "v", "hv"),
  widths = 1,
  heights = 1,
  legend = NULL,
  common.legend = FALSE,
  legend.grob = NULL
)
example
library(ggplot2)
library(ggpubr)
data("ToothGrowth")
df <- ToothGrowth
df$dose <- as.factor(df$dose)

bxp <- ggboxplot(df, x = "dose", y = "len",
                 color = "dose", palette = "jco")
dp <- ggdotplot(df, x = "dose", y = "len",
                color = "dose", palette = "jco")
dens <- ggdensity(df, x = "len", fill = "dose", palette = "jco")


plt<- ~{

    par(
      mar = c(3, 3, 1, 1),
      mgp = c(2, 1, 0)
    )
    plot(sqrt)
  }

# Arrange
# ::::::::::::::::::::::::::::::::::::::::::::::::::
ggarrange(bxp, dp,dens,plt, ncol = 2, nrow = 2)
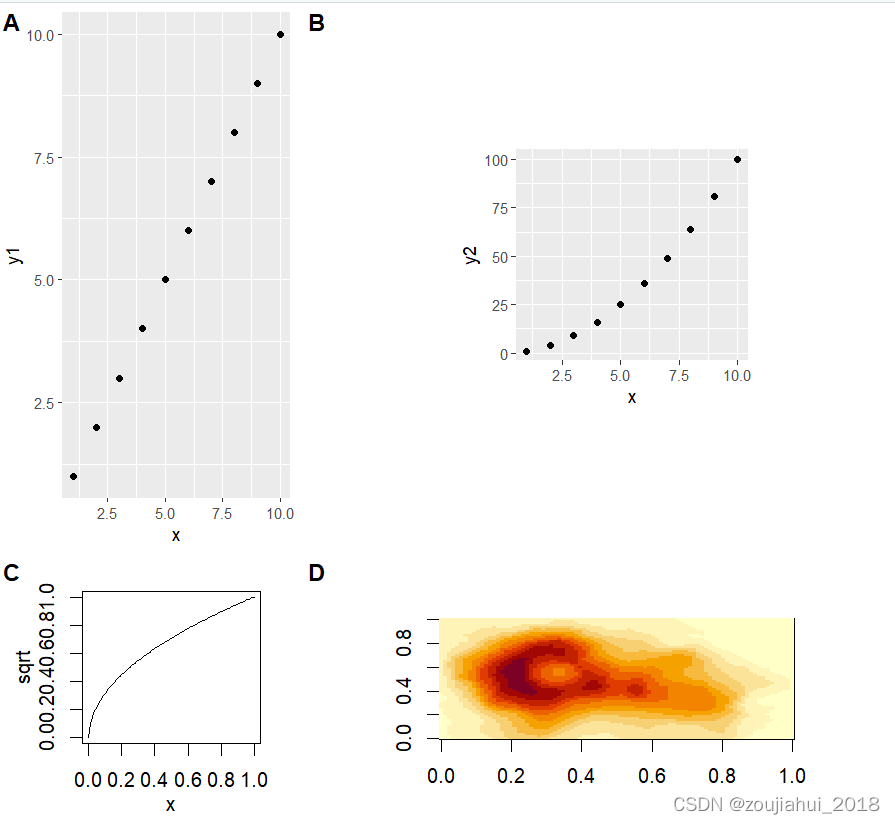
cowplot::plot_grid() Can be used for different objects
usage
plot_grid(
  ...,
  plotlist = NULL,
  align = c("none", "h", "v", "hv"),
  axis = c("none", "l", "r", "t", "b", "lr", "tb", "tblr"),
  nrow = NULL,
  ncol = NULL,
  rel_widths = 1,
  rel_heights = 1,
  labels = NULL,
  label_size = 14,
  label_fontfamily = NULL,
  label_fontface = "bold",
  label_colour = NULL,
  label_x = 0,
  label_y = 1,
  hjust = -0.5,
  vjust = 1.5,
  scale = 1,
  greedy = TRUE,
  byrow = TRUE,
  cols = NULL,
  rows = NULL
)
example
library(ggplot2)
library(cowplot)
df <- data.frame(
x = 1:10, y1 = 1:10, y2 = (1:10)^2, y3 = (1:10)^3, y4 = (1:10)^4
)
p1 <- ggplot(df, aes(x, y1)) + geom_point()
p2 <- ggplot(df, aes(x, y2)) + geom_point()
p6 <- ~{
par(
mar = c(3, 3, 1, 1),
mgp = c(2, 1, 0)
)
plot(sqrt)
}
p7 <- function() {
par(
mar = c(2, 2, 1, 1),
mgp = c(2, 1, 0)
)
image(volcano)
}
# ggarrange(p1,p2,p3,p4)
# making rows and columns of different widths/heights
plot_grid(
p1, p2,p6,p7, nrow = 2,ncol=2,rel_heights = c(2,1), rel_widths = c(1, 2),labels = "AUTO",scale = c(1, .5, .9, .7)
)
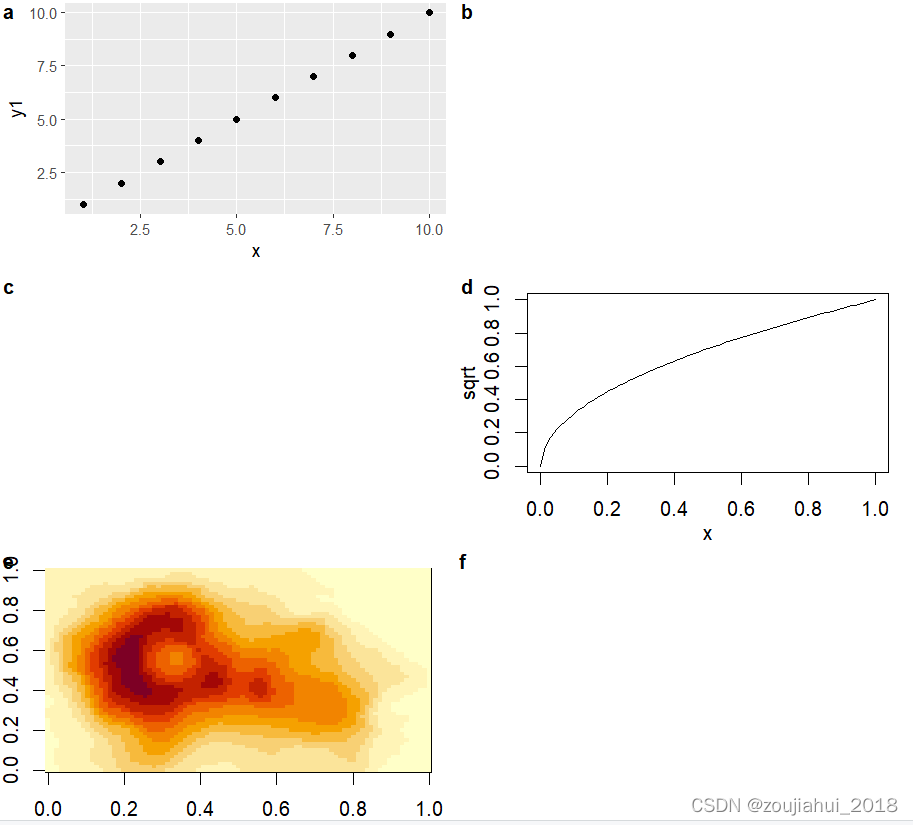
#' # missing plots in some grid locations, auto-generate lower-case labels
plot_grid(
p1, NULL, NULL, p6, p7, NULL,
ncol = 2,
labels = "auto",
label_size = 12,
align = "v"
)
customLayout::lay_new() More powerful and flexible
To be continued …
版权声明
本文为[zoujiahui_ two thousand and eighteen]所创,转载请带上原文链接,感谢
https://yzsam.com/2022/04/202204231547288840.html
边栏推荐
- Upgrade MySQL 5.1 to 5.611
- One brush 314 sword finger offer 09 Implement queue (E) with two stacks
- MySQL - MySQL查询语句的执行过程
- Filter usage of spark operator
- Accumulation of applet knowledge points
- Control structure (I)
- Treatment of idempotency
- 开源项目推荐:3D点云处理软件ParaView,基于Qt和VTK
- 多线程原理和常用方法以及Thread和Runnable的区别
- 【开源工具分享】单片机调试助手(示波/改值/日志) - LinkScope
猜你喜欢
Codejock Suite Pro v20.3.0
IronPDF for .NET 2022.4.5455
Config learning notes component

Do we media make money now? After reading this article, you will understand

王启亨谈Web3.0与价值互联网“通证交换”
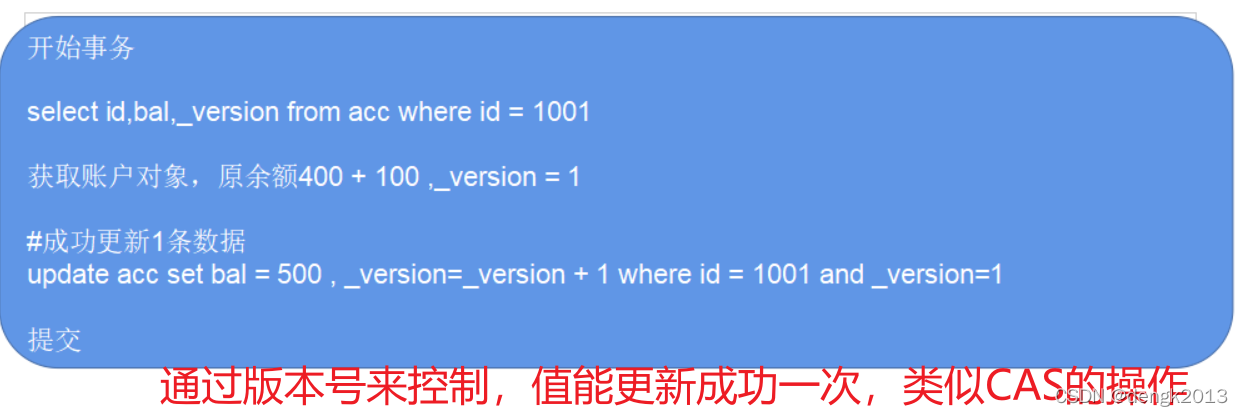
MySQL optimistic lock to solve concurrency conflict
MySQL集群模式与应用场景

Implement default page
Spark 算子之交集、并集、差集

API IX JWT auth plug-in has an error. Risk announcement of information disclosure in response (cve-2022-29266)
随机推荐
北京某信护网蓝队面试题目
Go语言切片,范围,集合
怎么看基金是不是reits,通过银行购买基金安全吗
PHP classes and objects
Upgrade MySQL 5.1 to 5.611
Go language, array, pointer, structure
Spark 算子之交集、并集、差集
C语言自编字符串处理函数——字符串分割、字符串填充等
现在做自媒体能赚钱吗?看完这篇文章你就明白了
JS regular determines whether the port path of the domain name or IP is correct
PS add texture to picture
R语言中绘制ROC曲线方法二:pROC包
Go language, condition, loop, function
Spark 算子之groupBy使用
shell_ two
Neodynamic Barcode Professional for WPF V11. 0
Why is IP direct connection prohibited in large-scale Internet
The principle and common methods of multithreading and the difference between thread and runnable
Mobile finance (for personal use)
Sortby use of spark operator