当前位置:网站首页>Solution architect's small bag - 5 types of architecture diagrams
Solution architect's small bag - 5 types of architecture diagrams
2022-04-23 16:57:00 【Amazon cloud developer】
Statement :
In this paper, from DEV Community Website , Article translation is provided by the developer community ;
Click on the link below , Check the English text :
In the meetings you have attended , Has anyone ever explained how software systems work ?
I've talked to a solution architect who's just started , He tried to describe to me the system they designed : It includes about eight different components , Communicate with each other in different ways .
In describing this solution , They keep using gestures , And a lot of “ This part passes ...... Communicate with that component ” Sentence patterns .
I know every word they say , But when it's connected, I don't understand .
When explaining a complex conceptual architecture , Language will lose its meaning . I'm following an idea to build a mental model . I need a visual presentation .
I need a chart
But it's not an ordinary chart . Architecture diagram is not a universal solution .
We recently discussed , As a solution architect , The important thing is to effectively communicate your ideas to technical and non-technical audiences .
Your chart must take this into account . If you want to pass ideas on to different people , You have to make different versions of the chart .
What we are going to discuss here is , Should be based on 5 Different audiences , Make 5 There are different types of charts .
We will be true API,Gopher Holes Unlimited For example , Add a new query to the system gopher.
flow chart
Flow charts are the most common 、 The most influential chart . It is a medium and high-level chart , Include all parts of the workflow .
This diagram shows the active part of a business process .

Audience
The audience of the flow chart is generally technical . It can be used to present ideas to the architecture committee , You can also describe to developers how a business process works .
matters needing attention
The architecture flow chart is mainly composed of various activity parts . In our serverless AWS Environment , We give each hosted service , And which services can communicate with each other and label .
We don't describe in detail how the parts interact , But it shows the connection , This shows how data flows through the system .
Service map
The service diagram shows connectivity at a higher level . It doesn't contain details such as workflow or how services run , It's a key part of the show . The following figure shows the internal and external services used in the application .

Audience
IT And network engineers are often most interested in this type of chart . They care about how to connect with external services , in addition , They also want to know if any internal connections need to be monitored .
I often use service diagrams to explain how the system works to senior executives . They want to know how the main applications are connected , There is nothing better than a service diagram to present these connections .
matters needing attention
When building an architecture service diagram , It's best to list all the microservices that make up an application or ecosystem . Indicate which services communicate with each other , And make sure to distinguish between internal services and external services .
In such high-level charts , There is no need to specify how each service works . This is true for all services that make applications run .
Role diagram
Show that your architecture can solve business problems , This is very important . The role diagram shows a chronological view , And different roles in a particular workflow . It's the best tool to prove that you take business into account when developing solutions .

Audience
The target audience of such charts includes business oriented individuals and product owners . They focus on characters , And how to interact with the system . Such a display “ who , When , What did you do ” The chart , Be able to describe your system perfectly to the audience .
matters needing attention
The role diagram is a bit similar to BPMN Model , Use swimlanes to show the different roles in the workflow . Such charts are often low-level , Because it contains more details . Identify the role 、 Workflow and how business processes move from one step to another .
Role maps can also help developers who have just set foot in a field , Provide rich background information for what they are about to develop .
Infrastructure map
The infrastructure map is a “ What you see is what you get ” Model of . It represents everything that has been implemented . It is essentially a low-level chart , Including services / application / Everything that exists in the ecosystem .
The purpose of the infrastructure map is to show what has been established and how the system currently works . Think of it as a blueprint for the application you build .

Audience
Infrastructure maps have different audiences . It can be used to show developers the problems that need to be handled in a specific microservice . It can also be used to show customers all the resources your company uses to complete a task .
Technicians are the main users of infrastructure maps . Because you provided a list , Instead of presenting ideas or business processes , Therefore, the expected scope of use of such diagrams is limited to information . It's for those who like “ all the minor details ” It was prepared by the people of .
matters needing attention
When making architectural infrastructure drawings , Don't miss anything . The goal of this kind of chart is to show everything in the application , And how they are connected . You don't need to go into all the details , Instead, make sure that all parts of the application are included in the diagram .
Developer map
When you need to know more about the situation , Developer map is the best choice . It contains everything developers need to build a solution . The goal is to answer any questions that may arise when viewing the flowchart , And incorporate it into the design . This is the lowest level chart , Designed to convey your ideas in your absence .
Someone should be able to read this picture , And clearly know what to do .

Audience
The audience of this kind of diagram is the developer who implements the solution . For people outside the team , The level of detail contained in the chart is unnecessary . occasionally , For audiences who don't need too much detail , Too many details can be a bad thing .
Providing implementation details to people outside the development team is a good illustration that too much detail is not a good thing . It can lead to distraction , And cover up other messages you want to convey .
matters needing attention
Developer diagram is essentially a flow chart with added details . Mark out any specific implementation details you can think of , And mark important transitions .
Such charts do not replace user stories , But it does help strengthen user stories , Improve the understanding level of the whole development team . Use... When you can use developer diagrams , Because after the implementation , You have a tool that you can refer to in the future .
summary
There are many types of architecture diagrams . Each has a special purpose , Serve different audiences . As a solution architect , You must be able to present ideas at the same time , Provide the right type of chart to the right audience .
In many cases , One version of the chart is not enough . When I started working on a new design , I always start with a flowchart . I will write down all my thoughts , Then get the approval of other solution architects . Once we agree on a solution , I'll turn it into a character map , Then show it to the business staff .
When I get the approval of the business department , I can make developer maps and service maps . The service chart is for executives , To ensure that they have a high level of understanding of what we are doing . The developer diagram is for engineers who will implement the solution .
Once the solution is built , We can update the infrastructure map , New jobs will be covered .
One picture is worth a thousand words , But the architecture diagram may be better than 5000 . Can make people relaxed 、 Quickly understand your thoughts , Is the key to becoming a good solution architect .
Be able to create different types of charts for different audiences , You are ready for success .
P.S. - I'm used to using draw.io To build a chart . This is a free tool , It provides beautiful and detailed charts 、 All the resources needed for models and diagrams .
The authors : Allen Helton
Allen Helton for AWS Community Builders
版权声明
本文为[Amazon cloud developer]所创,转载请带上原文链接,感谢
https://yzsam.com/2022/04/202204231338177793.html
边栏推荐
猜你喜欢
New project of OMNeT learning
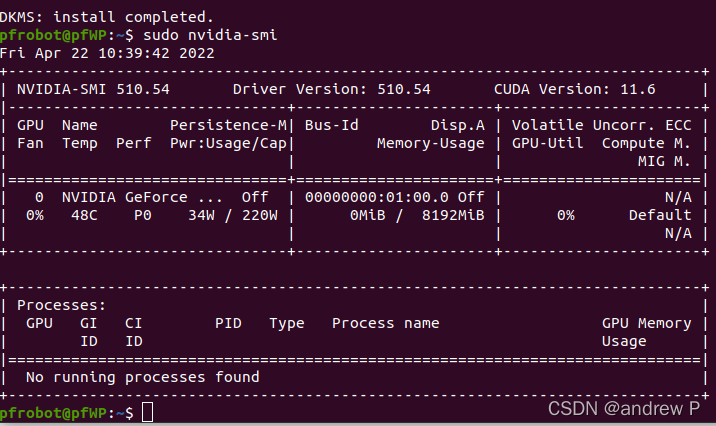
NVIDIA graphics card driver error
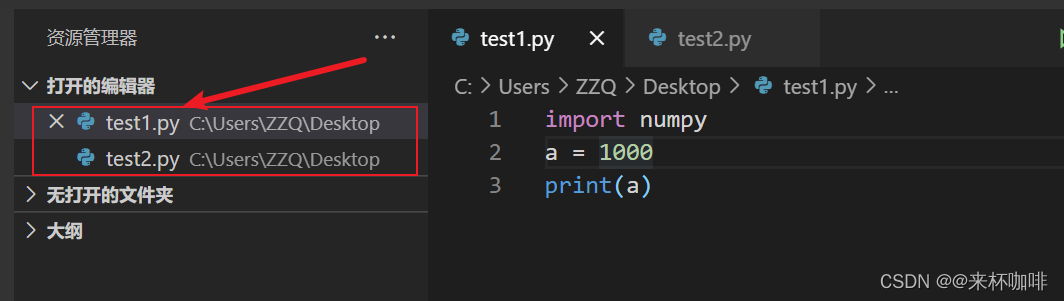
How vscode compares the similarities and differences between two files
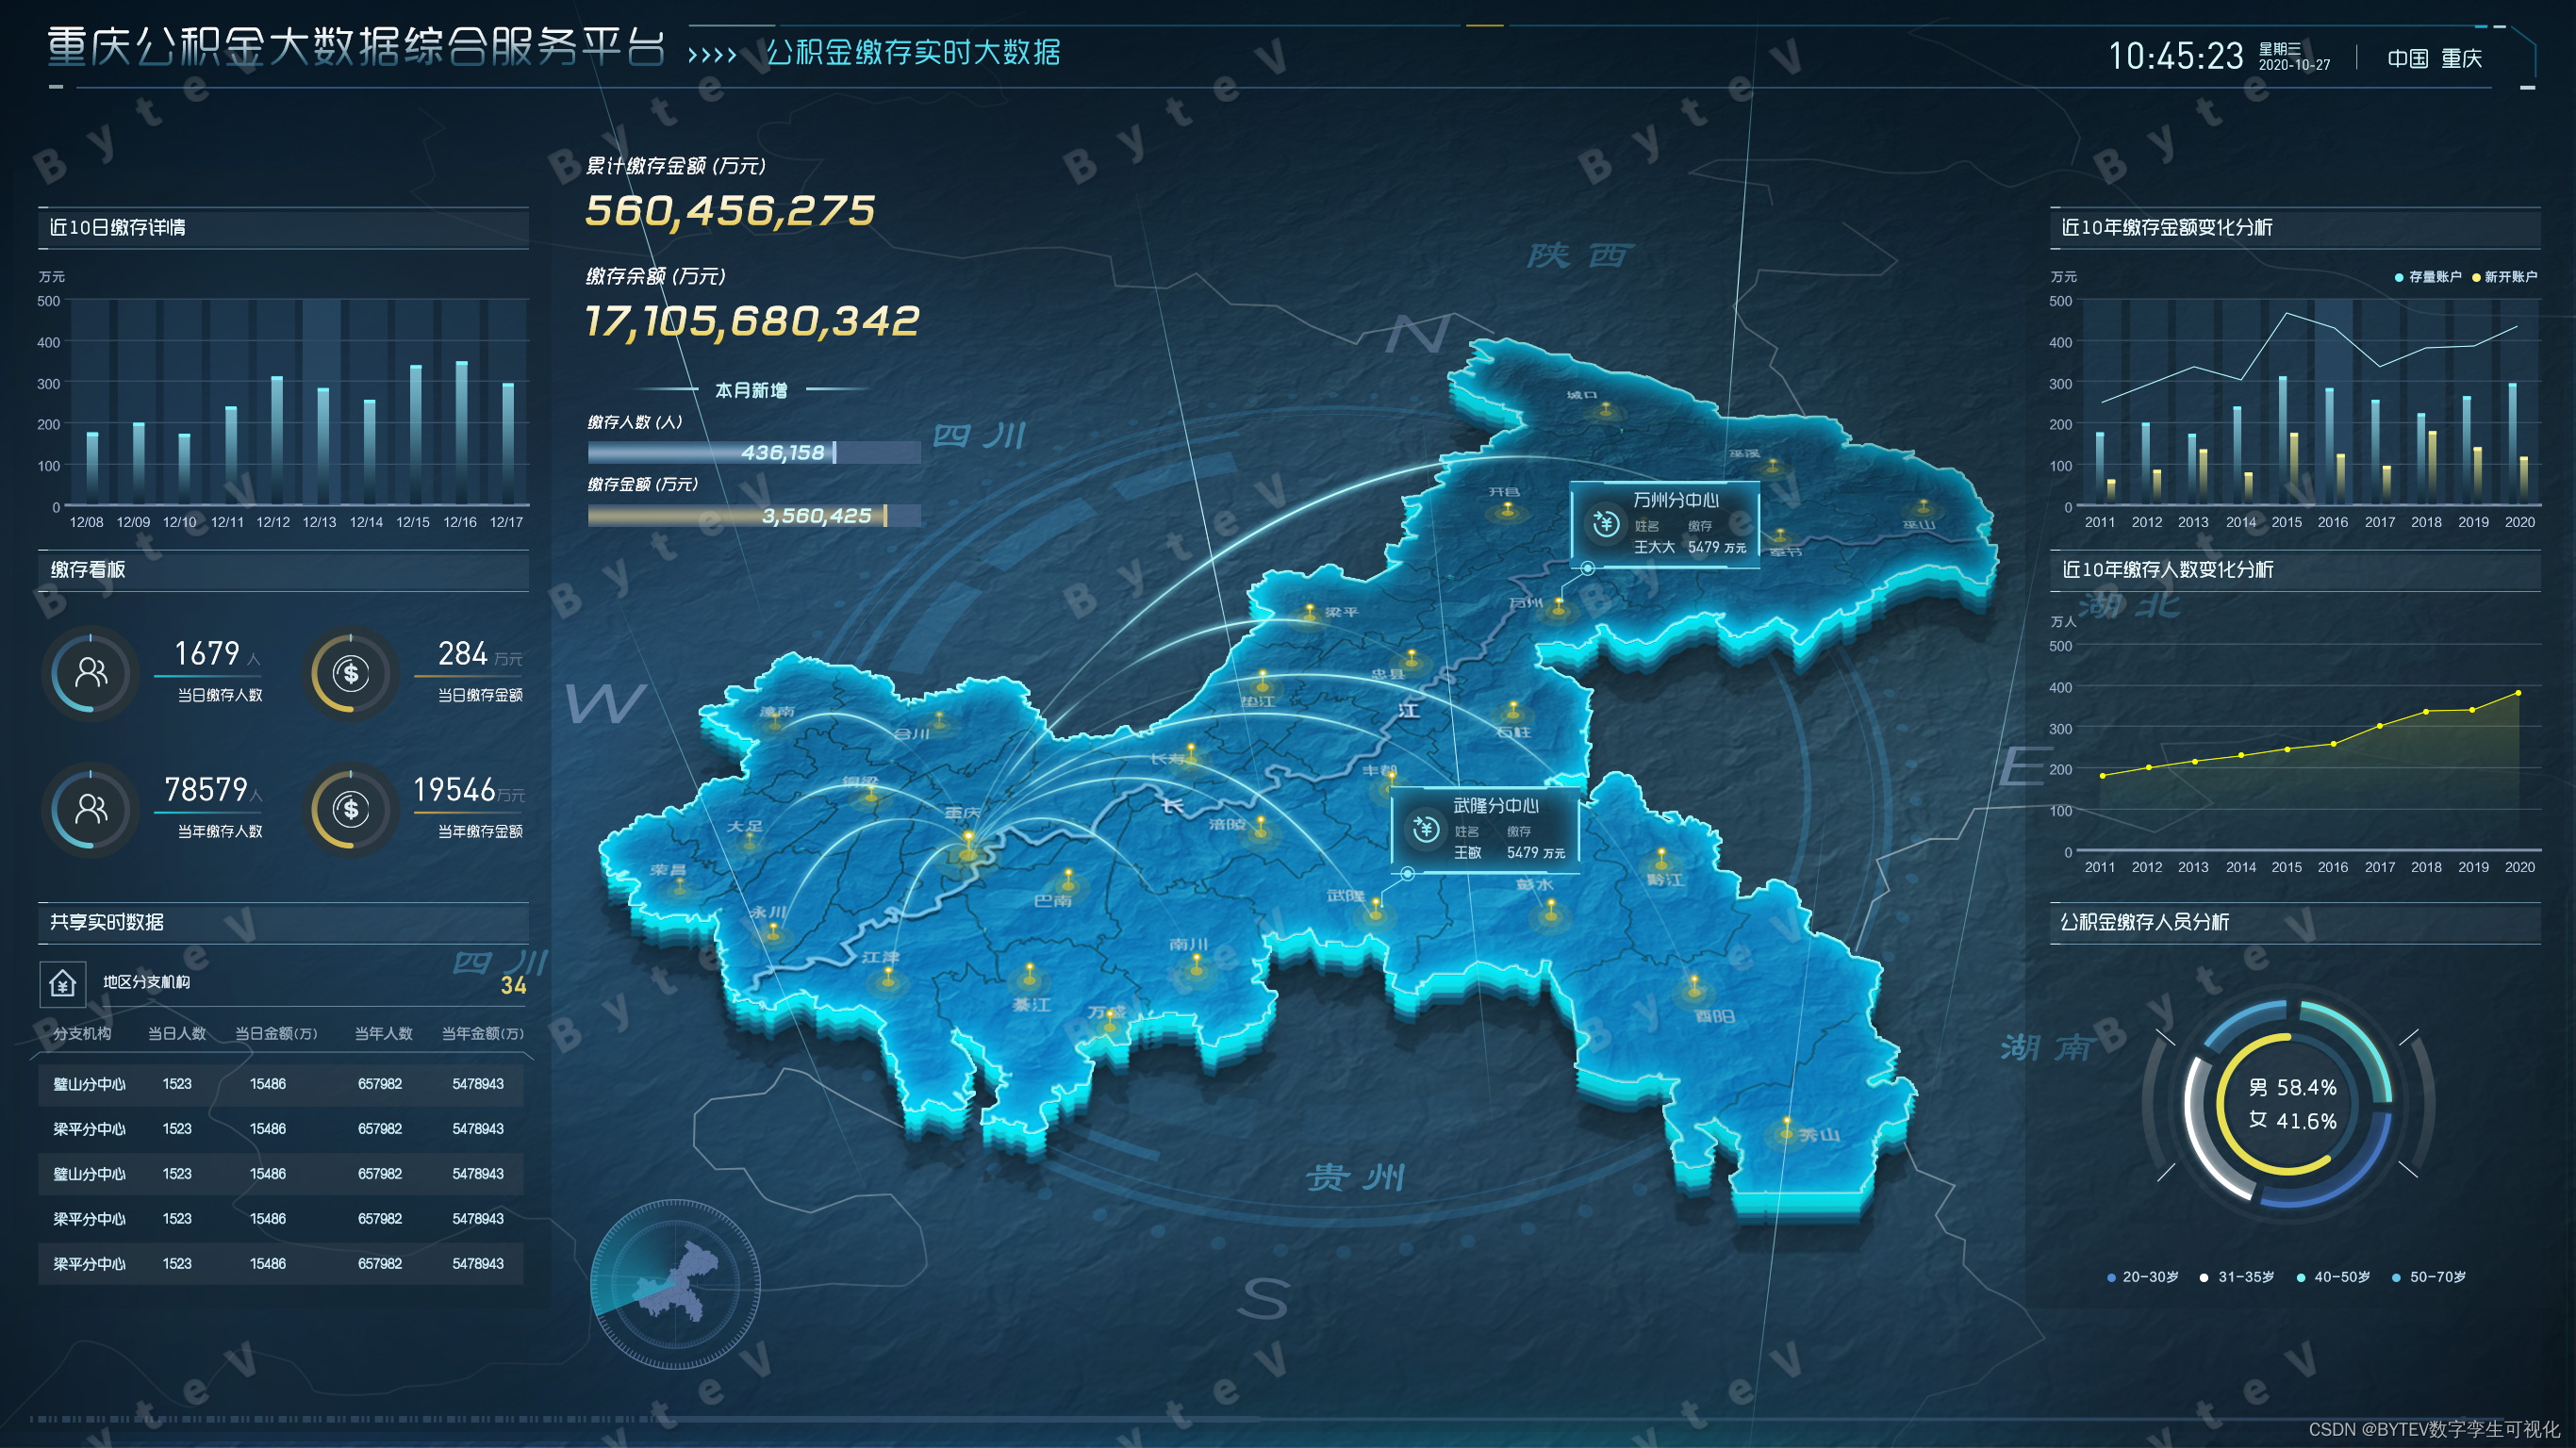
Bytevcharts visual chart library, I have everything you want
自定义my_strcpy与库strcpy【模拟实现字符串相关函数】
PyMySQL
DanceNN:字节自研千亿级规模文件元数据存储系统概述
Lock锁
Pycham connects to the remote server and realizes remote debugging
Milvus 2.0 质量保障系统详解
随机推荐
Deeply understand the relevant knowledge of 3D model (modeling, material mapping, UV, normal), and the difference between displacement mapping, bump mapping and normal mapping
MySQL modify master database
websocket
Paging the list collection
RTKLIB 2.4.3源码笔记
如何建立 TikTok用户信任并拉动粉丝增长
[pimf] openharmony paper Club - what is the experience of wandering in ACM survey
无线鹅颈麦主播麦手持麦无线麦克风方案应当如何选择
Knowledge points and examples of [seven input / output systems]
◰ GL shader handler encapsulation
MySQL master-slave replication
信息摘要、数字签名、数字证书、对称加密与非对称加密详解
扫码登录的原理你真的了解吗?
Public variables of robotframework
博士申请 | 厦门大学信息学院郭诗辉老师团队招收全奖博士/博后/实习生
Getting started with JDBC
Server log analysis tool (identify, extract, merge, and count exception information)
Detailed explanation of information abstract, digital signature, digital certificate, symmetric encryption and asymmetric encryption
Milvus 2.0 质量保障系统详解
PyTorch:train模式与eval模式的那些坑