当前位置:网站首页>Thinkphp5 + data large screen display effect
Thinkphp5 + data large screen display effect
2022-04-23 20:49:00 【A bone preference】
1 Controller code display :

Controller code :
    //  The data output after loading the page
    public function index()
    {
    	$data =  Db::name('index')->limit(5)->select();
        $this->assign('data',$data);
        $this->display();
        return view('index');
    }
    //  Get data asynchronously
    public function data(){

        $list = Db::name('index')->limit(5)->select();
        //  Reorganize array
        foreach ($list as $key => $value) {

            $arr['id'][] = $value['id'];
            $arr['name'][] = $value['name'];
            $arr['number'][] = $value['number'];
            $arr['details'][] = $value['details'];
            $arr['create_time'][] = $value['create_time'];
        }
        die(json_encode($arr)); // Convert to json Data output
    }
html Code :
<!DOCTYPE html>
<html>
<head>
<meta charset="utf-8">
<title>ECharts</title>
<!-- introduce echarts.js -->
<script src="echarts.min.js"></script>
</head>
<body>
<!-- by ECharts Prepare one with size ( Wide and high ) Of Dom -->
<div id="main" style="width: 600px;height:400px;"></div>
</body>
<script src="http://code.jquery.com/jquery-2.2.1.min.js"></script>
<script type="text/javascript">
var myChart;
myChart = echarts.init(document.getElementById('main'));
myChart.setOption({
title: {
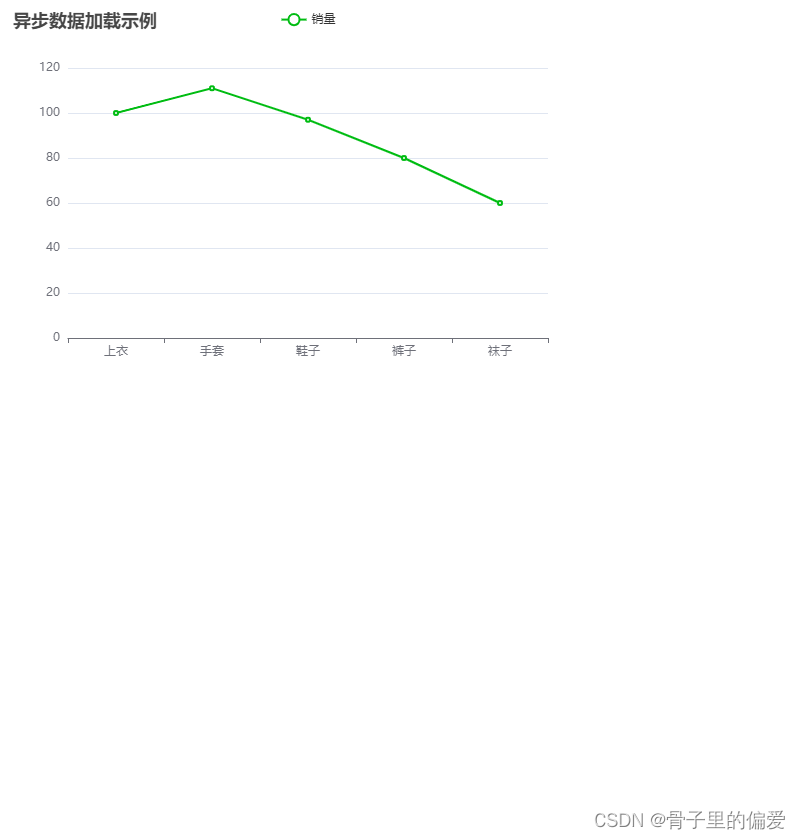
text: ' Asynchronous data loading example '
},
tooltip: {
},
legend: {
data:[' sales ']
},
xAxis: {
// Display in the chart after loading the page X Axis information
data: [<?php foreach($data as $v){
; ?>"<?php echo $v['name'] ?>",<?php }; ?>]
},
yAxis: {
},
series: [{
name: ' sales ',
// type: 'line',// Broken line diagram
type: 'bar',// Histogram
// Display in the chart after loading the page Y Axis information
data: [<?php foreach($data as $v){
; ?>"<?php echo $v['number'] ?>",<?php }; ?>],
itemStyle:{
// Color definition
normal:{
color:'#00bc12'}
}
}]
});
// Load background data asynchronously , Through the timer to achieve
var i = 0;
function run() {
i++;
$.ajax({
url: "{:url('index/index/data')}",
type: 'POST',
dataType: 'JSON',
data:{
page:i},
success:function(json){
if(json.datetime.length != 5){
clearInterval(time);
return;
}
myChart.setOption({
xAxis: {
data: json.create_time
},
series: [{
name: ' sales ',
data: json.details
}]
});
}
})
};
<!--var time = setInterval(run,3000);-->
</script>
</html>
Display effect display :

Database display :

Line chart effect :
版权声明
本文为[A bone preference]所创,转载请带上原文链接,感谢
https://yzsam.com/2022/04/202204232047427945.html
边栏推荐
- Elastic box model
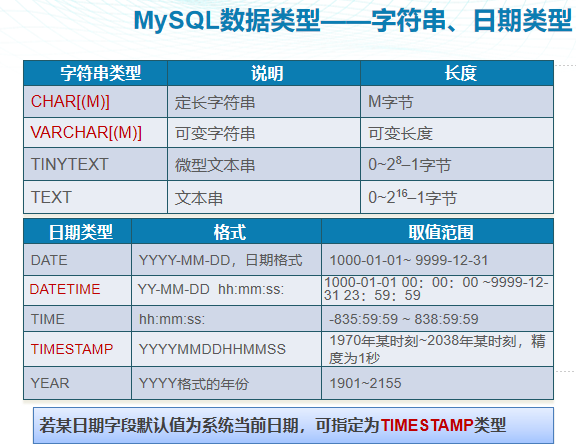
- MySQL advanced common functions
- Centralized record of experimental problems
- Singleton mode
- Recommended usage scenarios and production tools for common 60 types of charts
- Lunch on the 23rd day at home
- Reentrant function
- 浅谈数据库设计之三大范式
- Solution: NPM err! code ELIFECYCLE npm ERR! errno 1
- GO语言开发天天生鲜项目第三天 案例-新闻发布系统二
猜你喜欢
![[matlab 2016 use mex command to find editor visual studio 2019]](/img/34/dd883f0ce4358234eb694287228687.png)
[matlab 2016 use mex command to find editor visual studio 2019]
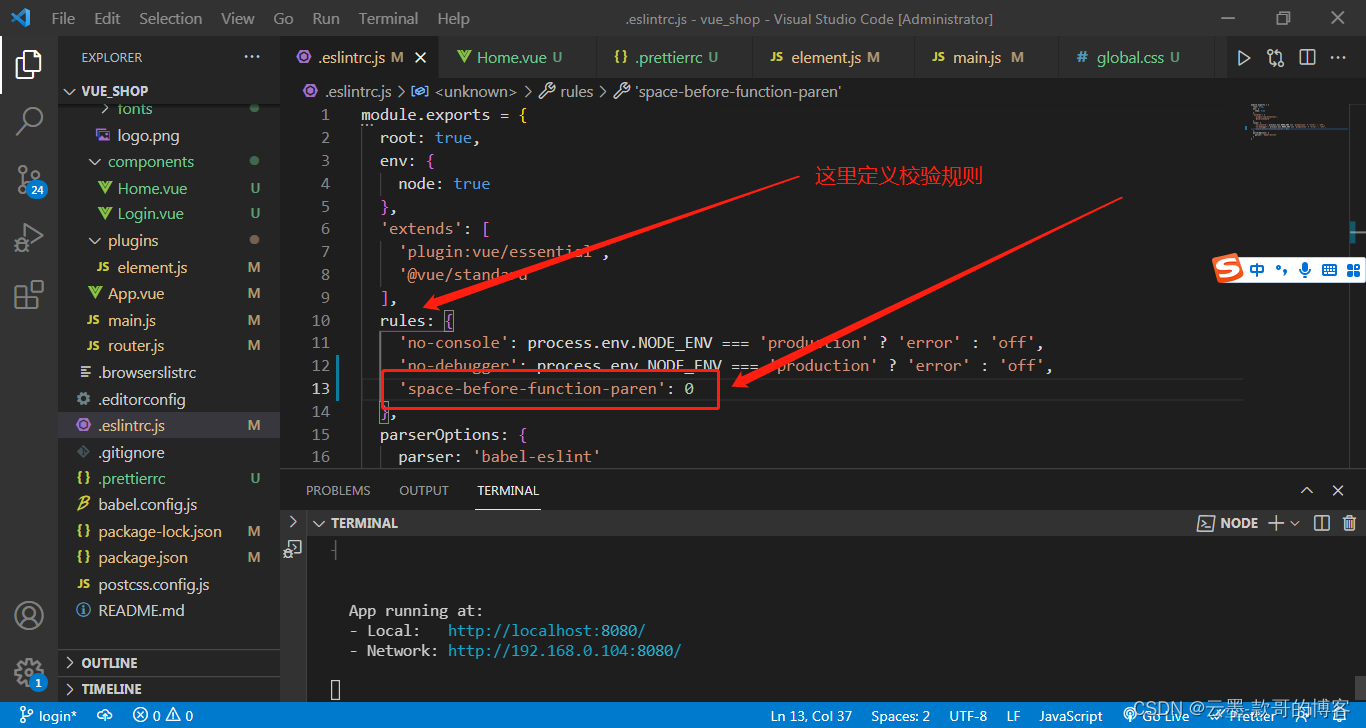
Resolve the eslint warning -- ignore the warning that there is no space between the method name and ()
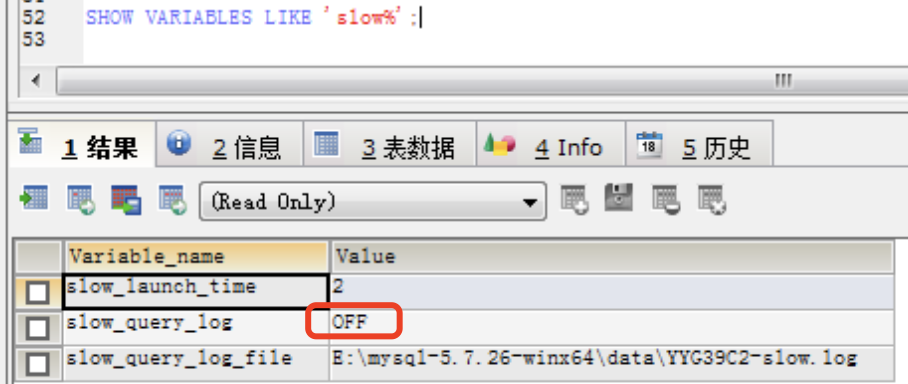
高薪程序员&面试题精讲系列91之Limit 20000加载很慢怎么解决?如何定位慢SQL?
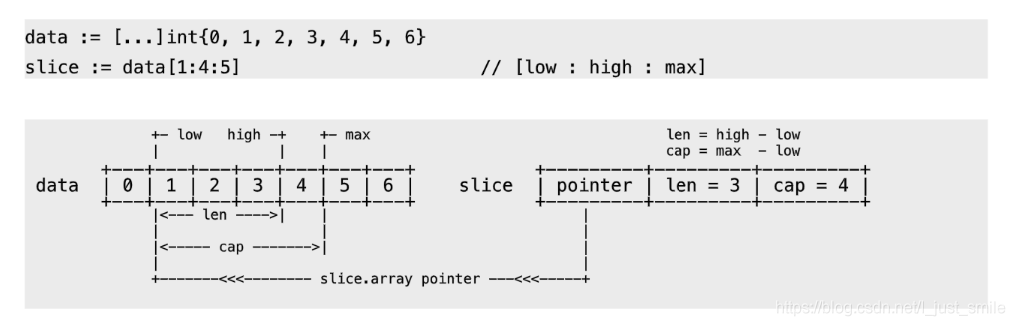
go slice

Matlab matrix index problem
MySQL基础之写表(创建表)
MySQL基础合集

亚马逊和Epic将入驻,微软应用商城向第三方开放
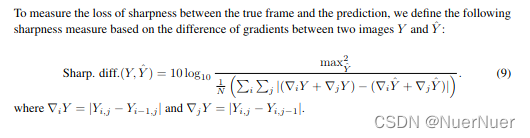
Sharpness difference (SD) calculation method of image reconstruction and generation domain index
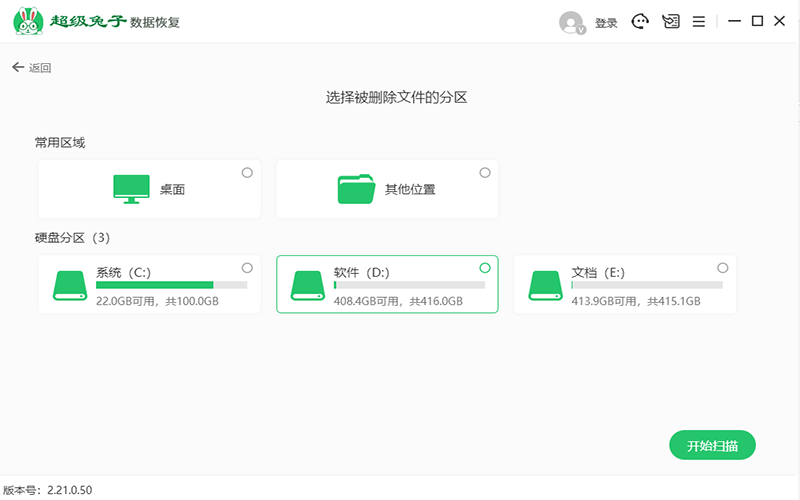
The more you use the computer, the slower it will be? Recovery method of file accidental deletion
随机推荐
Fastdfs mind map
Introduction to standardization, regularization and normalization
How to use PM2 management application? Come in and see
Learn to C language fourth day
How to do after winning the new debt? Is it safe to open an account online
mmap、munmap
Gsi-ecm digital platform for engineering construction management
Assertionerror: invalid device ID and runtimeerror: CUDA error: invalid device ordinal
Preliminary understanding of cache elimination algorithm (LRU and LFU)
go array
MySQL数据库常识之储存引擎
Unity ECS dots notes
学会打字后的思考
深入探究ASP.NET Core读取Request.Body的正确方式
Matlab matrix index problem
Leetcode 709, convert to lowercase
Elastic box model
高薪程序员&面试题精讲系列91之Limit 20000加载很慢怎么解决?如何定位慢SQL?
Prim、Kruskal
Vulnhub DC: 1 penetration notes