当前位置:网站首页>R语言中绘制ROC曲线方法二:pROC包
R语言中绘制ROC曲线方法二:pROC包
2022-04-23 15:47:00 【zoujiahui_2018】
介绍
pROC包中的roc()可以绘制分类问题的roc曲线,创建的是S3对象;ROCR包也可以绘制roc曲线,但是创建的是S4对象。
roc()函数介绍
roc(...)
## S3 method for class 'formula'
roc(formula, data, ...)
## S3 method for class 'data.frame'
roc(data, response, predictor,
ret = c("roc", "coords", "all_coords"), ...)
## Default S3 method:
roc(response, predictor, controls, cases,
density.controls, density.cases,
levels=base::levels(as.factor(response)), percent=FALSE, na.rm=TRUE,
direction=c("auto", "<", ">"), algorithm = 6, quiet = FALSE,
smooth=FALSE, auc=TRUE, ci=FALSE, plot=FALSE, smooth.method="binormal",
smooth.n=512, ci.method=NULL, density=NULL, ...)
roc_(data, response, predictor, ret = c("roc", "coords", "all_coords"), ...)
参数介绍
-
response
就是真实分类的情况
a factor, numeric or character vector of responses (true class), typically encoded with 0 (controls) and 1 (cases). Only two classes can be used in a ROC curve. If the vector contains more than two unique values, or if their order could be ambiguous, use levels to specify which values must be used as control and case value. If the first argument was a data.frame, response should be the name of the column in data containing the response, quoted for roc_, and optionally quoted for roc.data.frame (non-standard evaluation or NSE). -
predictor
预测的概率
a numeric or ordered vector of the same length than response, containing the predicted value of each observation. If the first argument was a data.frame, predictor should be the name of the column in data containing the predictor, quoted for roc_, and optionally quoted for roc.data.frame (non-standard evaluation or NSE). -
controls, cases
instead of response, predictor, the data can be supplied as two numeric or ordered vectors containing the predictor values for control and case observations. -
density.controls, density.cases
a smoothed ROC curve can be built directly from two densities on identical x points, as in smooth. -
formula, data
a formula of the type response~predictor. If mulitple predictors are passed, a named list of roc objects will be returned. Additional arguments data and subset, but not na.action are supported, see model.frame for more details. -
levels
the value of the response for controls and cases respectively. By default, the first two values of levels(as.factor(response)) are taken, and the remaining levels are ignored. It usually captures two-class factor data correctly, but will frequently fail for other data types (response factor with more than 2 levels, or for example if your response is coded “controls” and “cases”, the levels will be inverted) and must then be specified here. If your data is coded as 0 and 1 with 0 being the controls, you can safely omit this argument. -
percent
if the sensitivities, specificities and AUC must be given in percent (TRUE) or in fraction (FALSE, default). -
na.rm
if TRUE, the NA values will be removed (ignored by roc.formula). -
direction
in which direction to make the comparison? “auto” (default): automatically define in which group the median is higher and take the direction accordingly. “>”: if the predictor values for the control group are higher than the values of the case group (controls > t >= cases). “<”: if the predictor values for the control group are lower or equal than the values of the case group (controls < t <= cases). You should set this explicity to “>” or “<” whenever you are resampling or randomizing the data, otherwise the curves will be biased towards higher AUC values. -
algorithm
the method used to compute sensitivity and specificity, an integer of length 1 between 0 and 6. 1: a safe, well-tested, pure-R code that is efficient when the number of thresholds is low. It goes with O(T*N). 2: an alternative pure-R algorithm that goes in O(N). Typically faster than 1 when the number of thresholds of the ROC curve is above 1000. Less tested than 1. 3: a C++ implementation of 1, about 3-5x faster. Typically the fastest with ROC curves with less than 50-100 thresholds, but has a very bad worst-case when that number increases. 4 (debug only, slow): runs algorithms 1 to 3 and makes sure they return the same values. 5: select 2 or 3 based on the number of thresholds. 6 (default): quickly select the algorithm on the class of the data: 2 for numeric and 3 for ordered. 0: use microbenchmark to choose between 2 and 3. -
ret
for roc.data.frame only, whether to return the threshold sensitivity and specificity at all thresholds (“coords”), all the coordinates at all thresholds (“all_coords”) or the roc object (“roc”). -
quiet
set to TRUE to turn off messages when direction and levels are auto-detected. -
smooth
if TRUE, the ROC curve is passed to smooth to be smoothed. -
auc
compute the area under the curve (AUC)? If TRUE (default), additional arguments can be passed to auc. -
ci
compute the confidence interval (CI)? If set to TRUE, additional arguments can be passed to ci. -
plot
plot the ROC curve? If TRUE, additional arguments can be passed to plot.roc. -
smooth.method, smooth.n, ci.method
in roc.formula and roc.default, the method and n arguments to smooth (if smooth=TRUE) and of=“auc”) must be passed as smooth.method, smooth.n and ci.method to avoid confusions. -
density
density argument passed to smooth. -
…
further arguments passed to or from other methods, and especially:-
auc: partial.auc, partial.auc.focus, partial.auc.correct.
-
ci: of, conf.level, boot.n, boot.stratified, progress
-
ci.auc:, reuse.auc, method
-
ci.thresholds: thresholds
-
ci.se: sensitivities
-
ci.sp: specificities
-
plot.roc: add, col and most other arguments to the plot.roc function. See plot.roc directly for more details.
-
smooth: method, n, and all other arguments. See smooth for more details.
-
返回值
-
auc
if called with auc=TRUE, a numeric of class “auc” as defined in auc. -
ci
if called with ci=TRUE, a numeric of class “ci” as defined in ci. -
response
the response vector. Patients whose response is not %in% levels are discarded. If NA values were removed, a na.action attribute similar to na.omit stores the row numbers. -
predictor
the predictor vector converted to numeric as used to build the ROC curve. Patients whose response is not %in% levels are discarded. If NA values were removed, a na.action attribute similar to na.omit stores the row numbers. -
original.predictor, original.response
the response and predictor vectors as passed in argument. -
levels
the levels of the response as defined in argument. -
controls
the predictor values for the control observations. -
cases
the predictor values for the cases. -
percent
if the sensitivities, specificities and AUC are reported in percent, as defined in argument. -
direction
the direction of the comparison, as defined in argument. -
fun.sesp
the function used to compute sensitivities and specificities. Will be re-used in bootstrap operations. -
sensitivities
the sensitivities defining the ROC curve. -
specificities
the specificities defining the ROC curve. -
thresholds
the thresholds at which the sensitivities and specificities were computed. See below for details. -
call
how the function was called. See match.call for more details.
实例
data(aSAH)
# With a formula:
roc(outcome ~ s100b, data=aSAH)
# Call:
# roc.formula(formula = outcome ~ s100b, data = aSAH)
#
# Data: s100b in 72 controls (outcome Good) < 41 cases (outcome Poor).
# Area under the curve: 0.7314
# Plot and CI (see plot.roc and ci for more options):
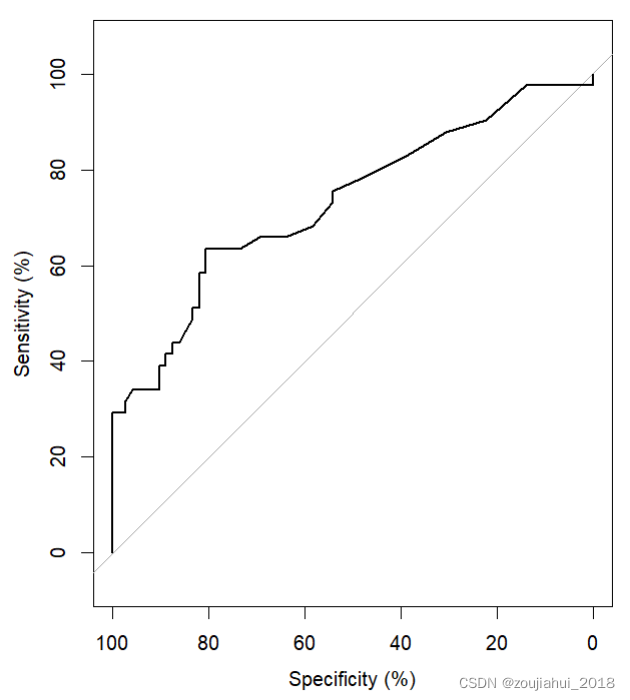
roc(aSAH$outcome, aSAH$s100b,
percent=TRUE, plot=TRUE, ci=TRUE)
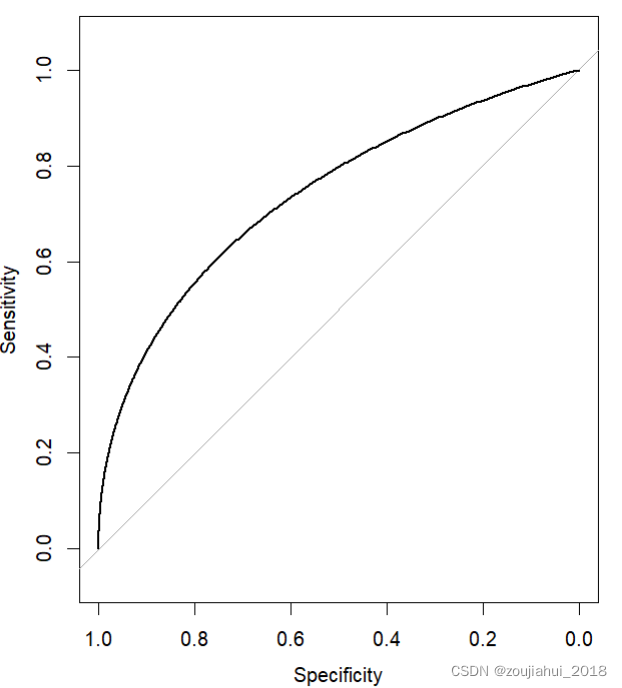
# Smoothed ROC curve
roc(aSAH$outcome, aSAH$s100b, plot=TRUE,smooth=TRUE)
版权声明
本文为[zoujiahui_2018]所创,转载请带上原文链接,感谢
https://blog.csdn.net/qq_18055167/article/details/124333898
边栏推荐
- Large factory technology implementation | industry solution series tutorials
- 【自娱自乐】构造笔记 week 2
- How can poor areas without networks have money to build networks?
- C, calculation method and source program of bell number
- 建设星际计算网络的愿景
- 现在做自媒体能赚钱吗?看完这篇文章你就明白了
- 怎么看基金是不是reits,通过银行购买基金安全吗
- PHP classes and objects
- 基于 TiDB 的 Apache APISIX 高可用配置中心的最佳实践
- MySQL optimistic lock to solve concurrency conflict
猜你喜欢
基于 TiDB 的 Apache APISIX 高可用配置中心的最佳实践
ICE -- 源码分析

Demonstration meeting on startup and implementation scheme of swarm intelligence autonomous operation smart farm project
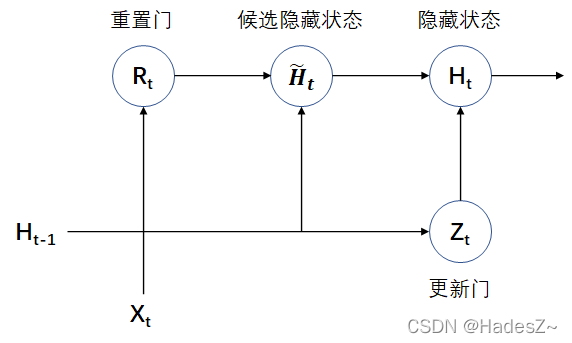
Timing model: gated cyclic unit network (Gru)
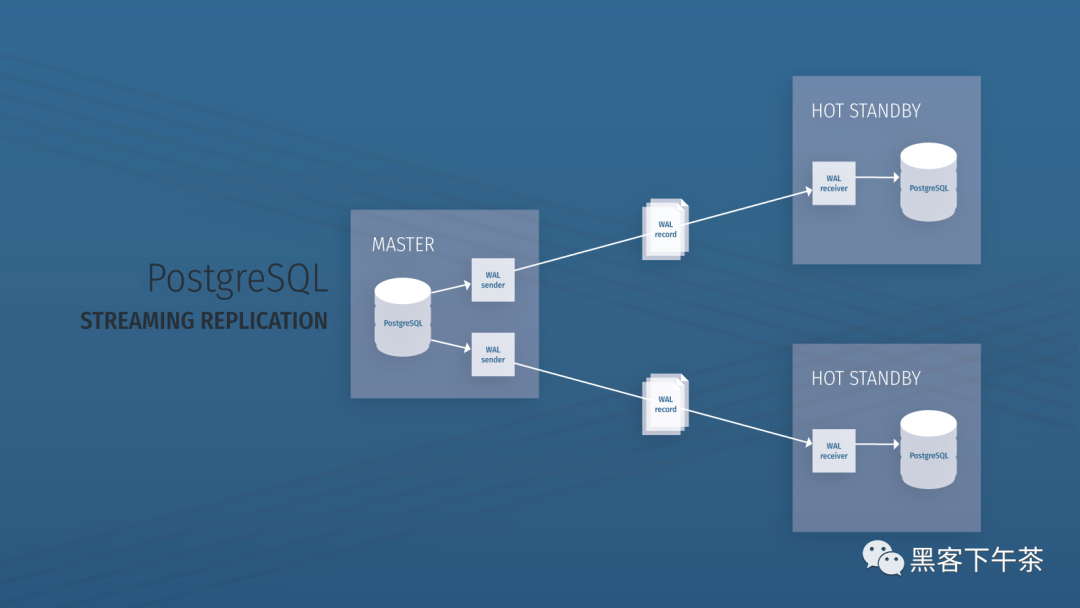
Use bitnami PostgreSQL docker image to quickly set up stream replication clusters
Spark 算子之filter使用
KNN, kmeans and GMM
Advantages, disadvantages and selection of activation function
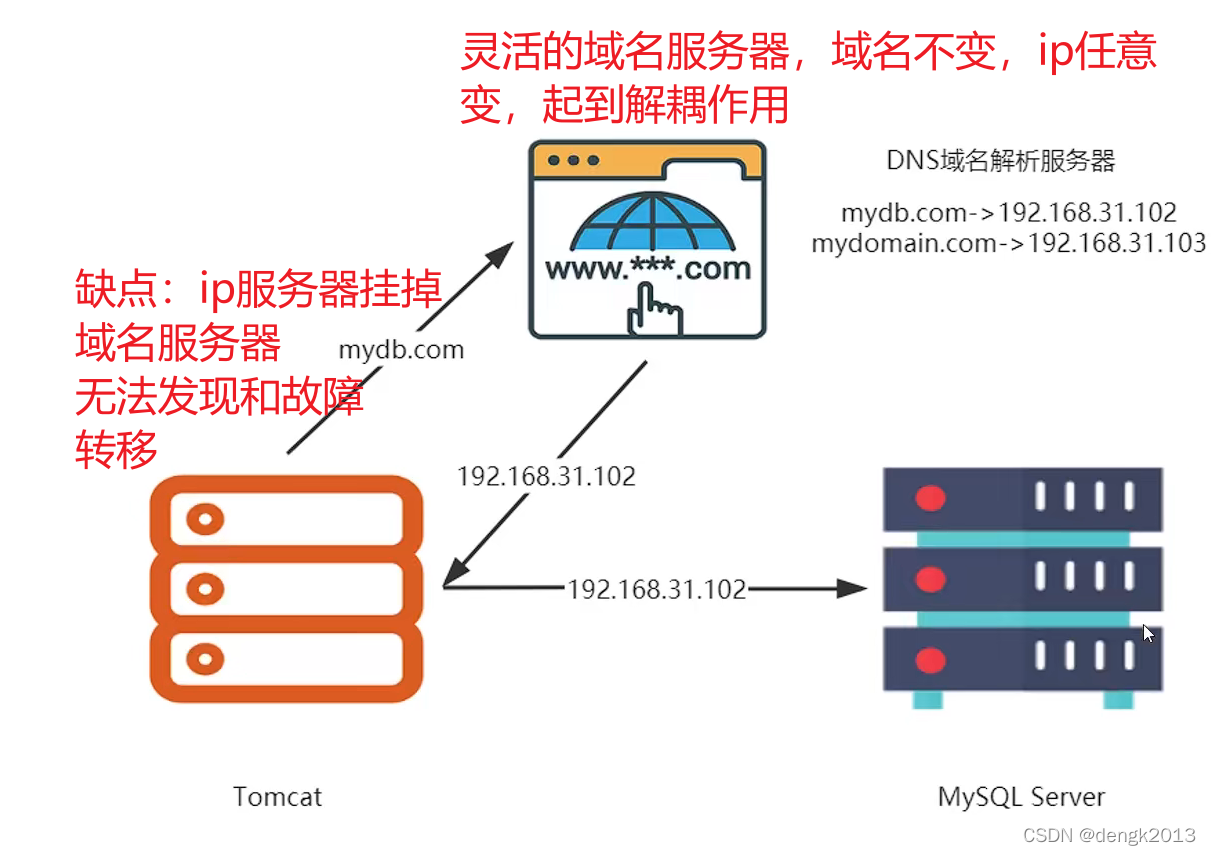
Why is IP direct connection prohibited in large-scale Internet
服务器中毒了怎么办?服务器怎么防止病毒入侵?
随机推荐
C#,贝尔数(Bell Number)的计算方法与源程序
c语言---指针进阶
Upgrade MySQL 5.1 to 5.67
CVPR 2022 quality paper sharing
字符串排序
APISIX jwt-auth 插件存在错误响应中泄露信息的风险公告(CVE-2022-29266)
字符串最后一个单词的长度
MetaLife与ESTV建立战略合作伙伴关系并任命其首席执行官Eric Yoon为顾问
Named in pytoch_ parameters、named_ children、named_ Modules function
Go语言数组,指针,结构体
Metalife established a strategic partnership with ESTV and appointed its CEO Eric Yoon as a consultant
Calculate the number of occurrences of a character
Sorting and replying to questions related to transformer
Temporal model: long-term and short-term memory network (LSTM)
使用 Bitnami PostgreSQL Docker 镜像快速设置流复制集群
贫困的无网地区怎么有钱建设网络?
Upgrade MySQL 5.1 to 5.68
Extract non duplicate integers
单体架构系统重新架构
MySQL optimistic lock to solve concurrency conflict