当前位置:网站首页>Analyzes how Flink task than YARN container memory limit
Analyzes how Flink task than YARN container memory limit
2022-08-11 10:55:00 【InfoQ】
问题背景
<property><name>yarn.nodemanager.pmem-check-enabled</name><value>true</value></property>异常信息
2020-04-15 01:59:33,000 INFO org.apache.flink.yarn.YarnResourceManager - Closing TaskExecutor connection container_e05_1585737758019_0901_01_000003 because: Container [pid=3156625,containerID=container_e05_1585737758019_0901_01_000003] is running beyond physical memory limits. Current usage: 6.1 GB of 6 GB physical memory used; 14.5 GB of 28 GB virtual memory used. Killing container.Dump of the process-tree for container_e05_1585737758019_0901_01_000003 :|- PID PPID PGRPID SESSID CMD_NAME USER_MODE_TIME(MILLIS) SYSTEM_TIME(MILLIS) VMEM_USAGE(BYTES) RSSMEM_USAGE(PAGES) FULL_CMD_LINE|- 3156625 3156621 3156625 3156625 (bash) 0 0 15441920 698 /bin/bash -c /usr/java/default/bin/java -Xms4148m -Xmx4148m -XX:MaxDirectMemorySize=1996m -javaagent:lib/aspectjweaver-1.9.1.jar -Dlog.file=/data_sdh/nodemanager/log/application_1585737758019_0901/container_e05_1585737758019_0901_01_000003/taskmanager.log -Dlogback.configurationFile=file:./logback.xml -Dlog4j.configuration=file:./log4j.properties org.apache.flink.yarn.YarnTaskExecutorRunner --configDir . 1> /data_sdh/nodemanager/log/application_1585737758019_0901/container_e05_1585737758019_0901_01_000003/taskmanager.out 2> /data_sdh/nodemanager/log/application_1585737758019_0901/container_e05_1585737758019_0901_01_000003/taskmanager.err|- 3156696 3156625 3156625 3156625 (java) 12263 1319 15553892352 2119601 /usr/java/default/bin/java -Xms4148m -Xmx4148m -XX:MaxDirectMemorySize=1996m -javaagent:lib/aspectjweaver-1.9.1.jar -Dlog.file=/data_sdh/nodemanager/log/application_1585737758019_0901/container_e05_1585737758019_0901_01_000003/taskmanager.log -Dlogback.configurationFile=file:./logback.xml -Dlog4j.configuration=file:./log4j.properties org.apache.flink.yarn.YarnTaskExecutorRunner --configDir .Container killed on request. Exit code is 143Container exited with a non-zero exit code 143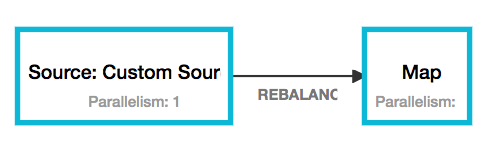
A few questions to be resolved
分析过程
YARN内存检测机制
JVM related routine testing
GC
[[email protected] ~]$ jstat -gcutil 12984 1000S0 S1 E O M CCS YGC YGCT FGC FGCT GCT99.96 0.00 79.06 4.78 94.92 89.38 2 0.164 0 0.000 0.16499.96 0.00 86.77 4.78 94.92 89.38 2 0.164 0 0.000 0.16499.96 0.00 94.48 4.78 94.92 89.38 2 0.164 0 0.000 0.1640.00 99.98 1.95 10.24 94.93 89.38 3 0.255 0 0.000 0.2550.00 99.98 9.77 10.24 94.93 89.38 3 0.255 0 0.000 0.2550.00 99.98 17.58 10.24 94.93 89.38 3 0.255 0 0.000 0.2550.00 99.98 25.40 10.24 94.93 89.38 3 0.255 0 0.000 0.2550.00 99.98 35.16 10.24 94.93 89.38 3 0.255 0 0.000 0.2550.00 99.98 41.02 10.24 94.93 89.38 3 0.255 0 0.000 0.255Dump 内存
jmap -dump:format=b,file=heap1.bin 12984[[email protected] ~]$ ll -lh heap1.bin-rw------- 1 dcadmin datacentergroup 1016M Apr 15 09:15 heap1.binTasks: 1 total, 0 running, 1 sleeping, 0 stopped, 0 zombie%Cpu(s): 0.6 us, 0.1 sy, 0.0 ni, 99.3 id, 0.0 wa, 0.0 hi, 0.0 si, 0.0 stKiB Mem : 16394040 total, 5676652 free, 8114832 used, 2602556 buff/cacheKiB Swap: 0 total, 0 free, 0 used. 7523032 avail MemPID USER PR NI VIRT RES SHR S %CPU %MEM TIME+ COMMAND12984 dcadmin 20 0 16.258g 7.053g 15104 S 13.3 45.1 1:27.92 java划重点!
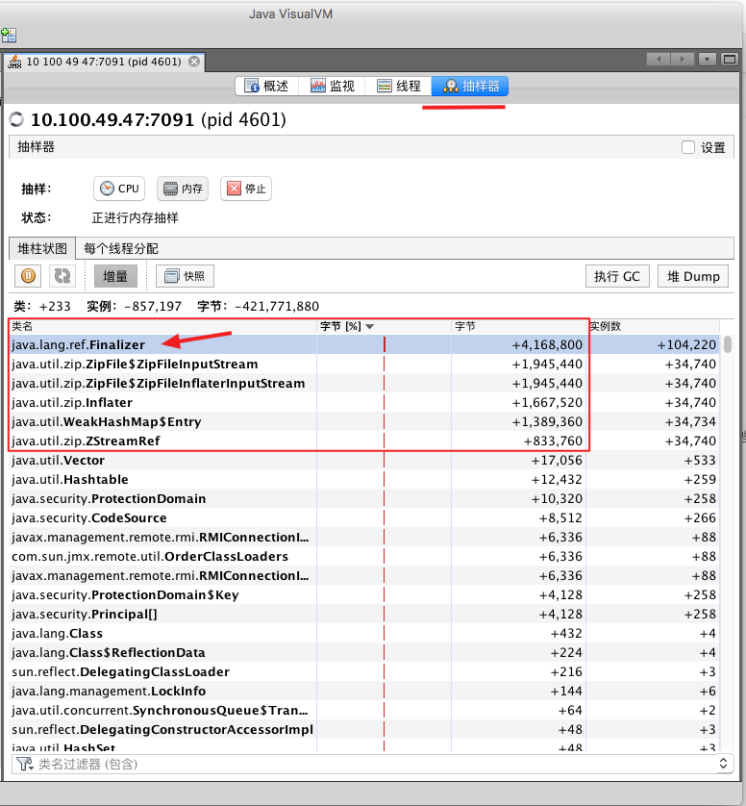
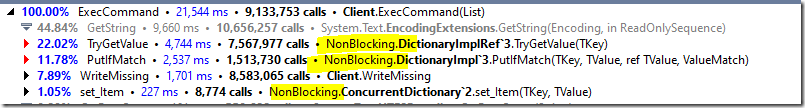
重点分析 RSS 内存的问题
Analyze off-heap memory allocations in
- Java Heap (reserved=4247552KB, committed=4247552KB)
 (mmap: reserved=4247552KB, committed=4247552KB)


- Class (reserved=1076408KB, committed=26936KB)
 (classes #1206)
 (malloc=19640KB #792)
 (mmap: reserved=1056768KB, committed=7296KB)

- Thread (reserved=42193KB, committed=42193KB)
 (thread #42)
 (stack: reserved=42016KB, committed=42016KB)
 (malloc=129KB #225)
 (arena=48KB #82)

- Code (reserved=250040KB, committed=5252KB)
 (malloc=440KB #1026)
 (mmap: reserved=249600KB, committed=4812KB)

- GC (reserved=177105KB, committed=177105KB)
 (malloc=21913KB #164)
 (mmap: reserved=155192KB, committed=155192KB)

- Compiler (reserved=150KB, committed=150KB)
 (malloc=19KB #61)
 (arena=131KB #3)

- Internal (reserved=19864KB, committed=19864KB)
 (malloc=19832KB #2577)
 (mmap: reserved=32KB, committed=32KB)

- Symbol (reserved=2285KB, committed=2285KB)
 (malloc=1254KB #255)
 (arena=1031KB #1)

- Native Memory Tracking (reserved=88KB, committed=88KB)
 (malloc=6KB #64)
 (tracking overhead=83KB)

- Arena Chunk (reserved=215KB, committed=215KB)
 (malloc=215KB)
分析 RSS 中 7GB What exactly is in memory
yum install -y gdb[[email protected] ~]$ pmap -x 21567 | sort -n -k3 | more---------------- ------- ------- ------- 0000000000400000 0 0 0 r-x-- java0000000000600000 0 0 0 rw--- java0000000000643000 0 0 0 rw--- [ anon ]00000006bcc00000 0 0 0 rw--- [ anon ]00000007c00e0000 0 0 0 ----- [ anon ]......00007fb2ec000000 65508 36336 36336 rw--- [ anon ]00007fb3c4000000 65536 41140 41140 rw--- [ anon ]00007fb2d8000000 65508 46692 46692 rw--- [ anon ]00007fb2e4000000 65508 47640 47640 rw--- [ anon ]00007fb2e0000000 65508 48596 48596 rw--- [ anon ]00007fb2dc000000 65512 49088 49088 rw--- [ anon ]00007fb2cc000000 65508 50380 50380 rw--- [ anon ]00007fb2d4000000 65508 53476 53476 rw--- [ anon ]00007fb238000000 131056 59668 59668 rw--- [ anon ]00000006bcc00000 4248448 1866536 1866536 rw--- [ anon ][[email protected] ~]$ cat /proc/21567/maps | grep 7fb2dc7fb2dbff9000-7fb2dc000000 ---p 00000000 00:00 07fb2dc000000-7fb2dfffa000 rw-p 00000000 00:00 0gdb attach 21567dump memory mem.bin 0x7fb2dc000000 0x7fb2dfffa000strings mem.bin | more...xcx.userprofile.kafkasource.bootstrap.servers=xxx-01:9096,xxx-02:9096,xxx-03:9096xcx.userprofile.kafkasource.topic=CENTER_search_trajectory_xcxxcx.userprofile.kafkasource.group=search_flink_xcx_userprofile_onlineapp.userprofile.kafkasource.bootstrap.servers=xxx-01:9096,xxx-02:9096,xxx-03:9096app.userprofile.kafkasource.topic=CENTER_search_trajectory_appapp.userprofile.kafkasource.group=search_flink_app_userprofile_onlinexcx.history.kafkasource.bootstrap.servers=xxx-01:9096,xxx-02:9096,xxx-03:9096xcx.history.kafkasource.topic=CENTER_search_trajectory_xcx...分析/简化业务代码
public class StreamingJob {
public static void main(String[] args) throws Exception {
StreamExecutionEnvironment env = StreamExecutionEnvironment.getExecutionEnvironment();
DataStream<String> text = env.socketTextStream("10.101.52.18", 9909);
text.map(new MapFunction<String, String>() {
@Override
public String map(String value) throws Exception {
TestFun testFun = new TestFun();
testFun.update();
return null;
}
});
env.execute();
}
static class TestFun {
Properties properties;
public TestFun() throws IOException {
properties = new Properties();
properties.load(TestFun.class.getClassLoader().getResourceAsStream("application.properties"));
}
public void update() {}
}
}模拟复现
Java 程序模拟
public class TestJar {

 public static void main(String[] args) throws Exception {

 while (true) {

 Properties properties = new Properties();

 properties.load(TestJar.class.getClassLoader().getResourceAsStream("application.properties"));

 }

 }

}java -Xmx512m -Xms512m -XX:MaxDirectMemorySize=1996m -cp test.jar com.ly.search.job.TestJobMemory leak fixes and extensions
修复方案
public class TestJar {
 public static void main(String[] args) throws Exception {
 while (true) {
 Properties properties = new Properties();
 InputStream inStream = TestJar.class.getClassLoader().getResourceAsStream("application.properties")
 properties.load(inStream);
 inStream.close();
 }
 }
}
public class TestJar {
 public static void main(String[] args) throws Exception {
 while (true) {
 Properties properties = new Properties();
 InputStream inStream = TestJar.class.getClassLoader().getResourceAsStream("application.properties")
 properties.load(inStream);
 System.gc();
 }
 }
}
扩展研究
// 等价于,内存溢出
ClassLoader classLoader = TestJar.class.getClassLoader();
URL resource = classLoader.getResource("application.properties");
URLConnection urlConnection = resource.openConnection();
urlConnection.getInputStream();

// 等价于,内存溢出
URL url = new URL("jar:file:/home/dcadmin/test.jar!/com/ly/search/job/StreamingJob.class");
JarURLConnection conn = (JarURLConnection) url.openConnection();
conn.getInputStream();

// 不等价于,Memory does not overflow
URL url = new URL("jar:file:/home/dcadmin/test.jar!/com/ly/search/job/StreamingJob.class");
JarURLConnection conn = (JarURLConnection) url.openConnection();
conn.setDefaultUseCaches(false);
conn.getInputStream();

// 不等价于,Memory does not overflow
URL fileURL = new File("test.jar").toURI().toURL();

FileURLConnection fileUrlConn = (FileURLConnection) fileURL.openConnection();
fileUrlConn.connect();
fileUrlConn.getInputStream();边栏推荐
猜你喜欢
chrome设置为深色模式(包括整个网页)
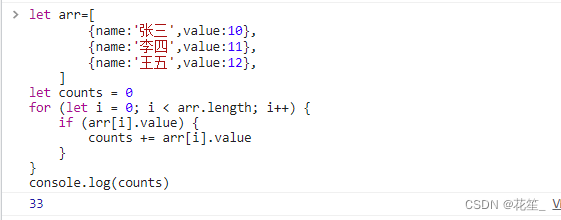
计算数组某个元素的和
数据库内核面试中我不会的问题(4)
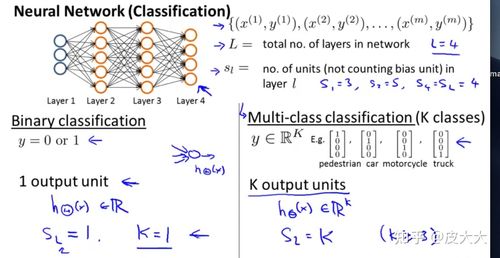
How to determine the neural network parameters, the number of neural network parameters calculation
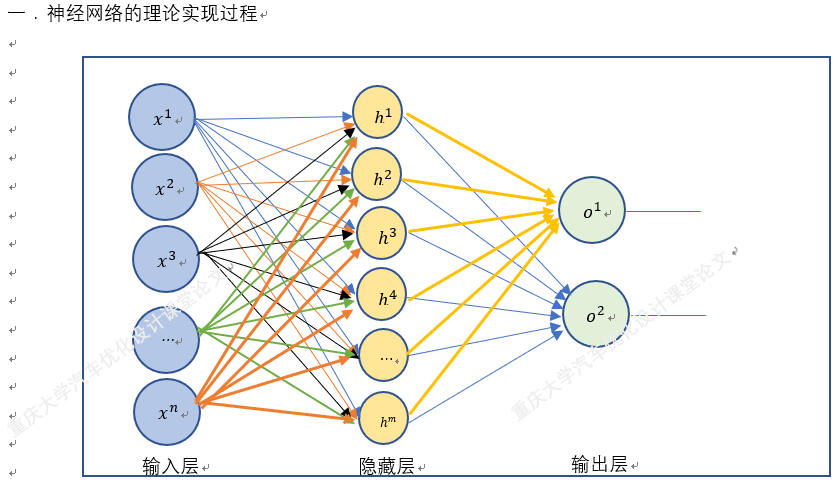
How to analyze the neural network diagram, draw the neural network structure diagram
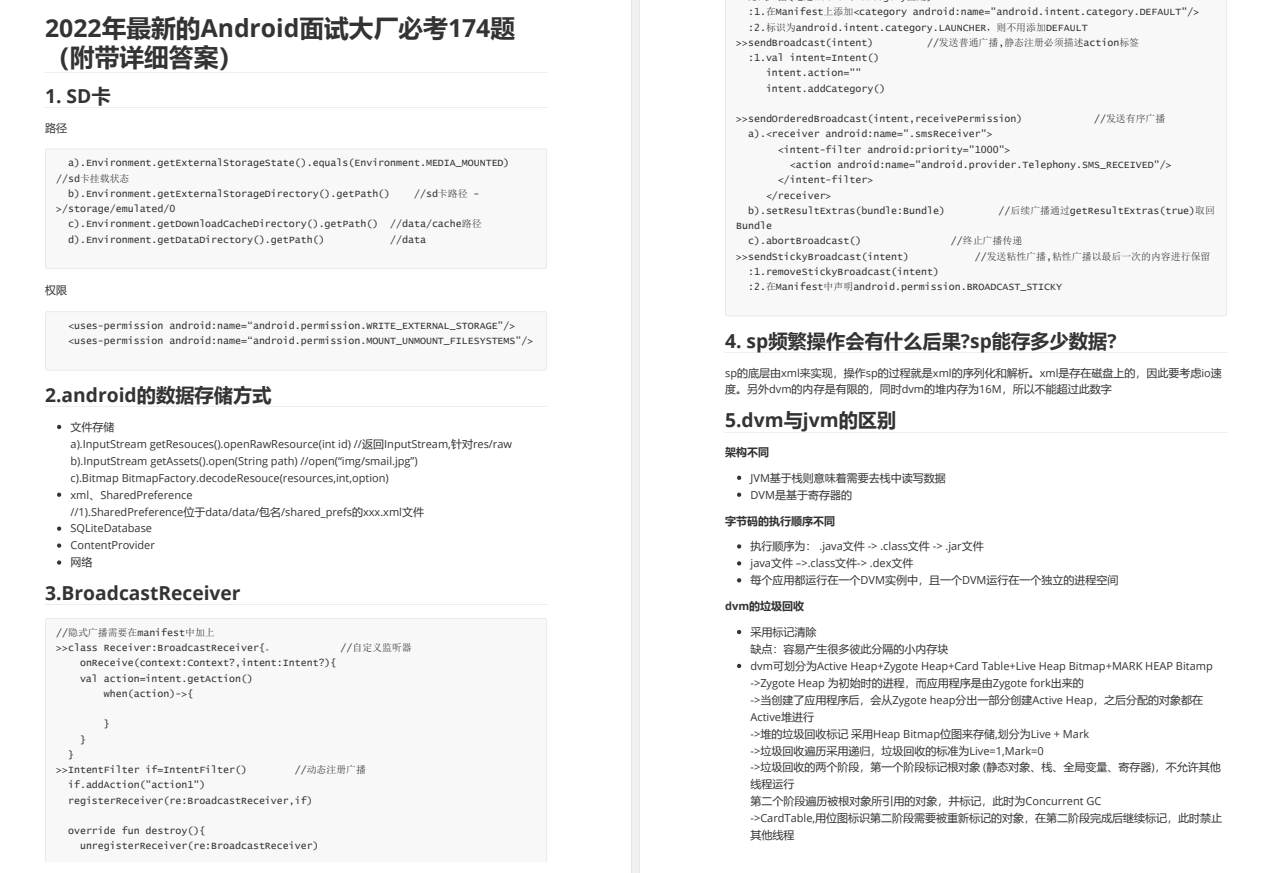
『独家』互联网 BAT 大厂 Android高级工程师面试题:174道题目让你做到面试无忧
Simple implementation of a high-performance clone of Redis using .NET (seven-end)
php将form表单内容提交到数据库后中文变成??(问号)
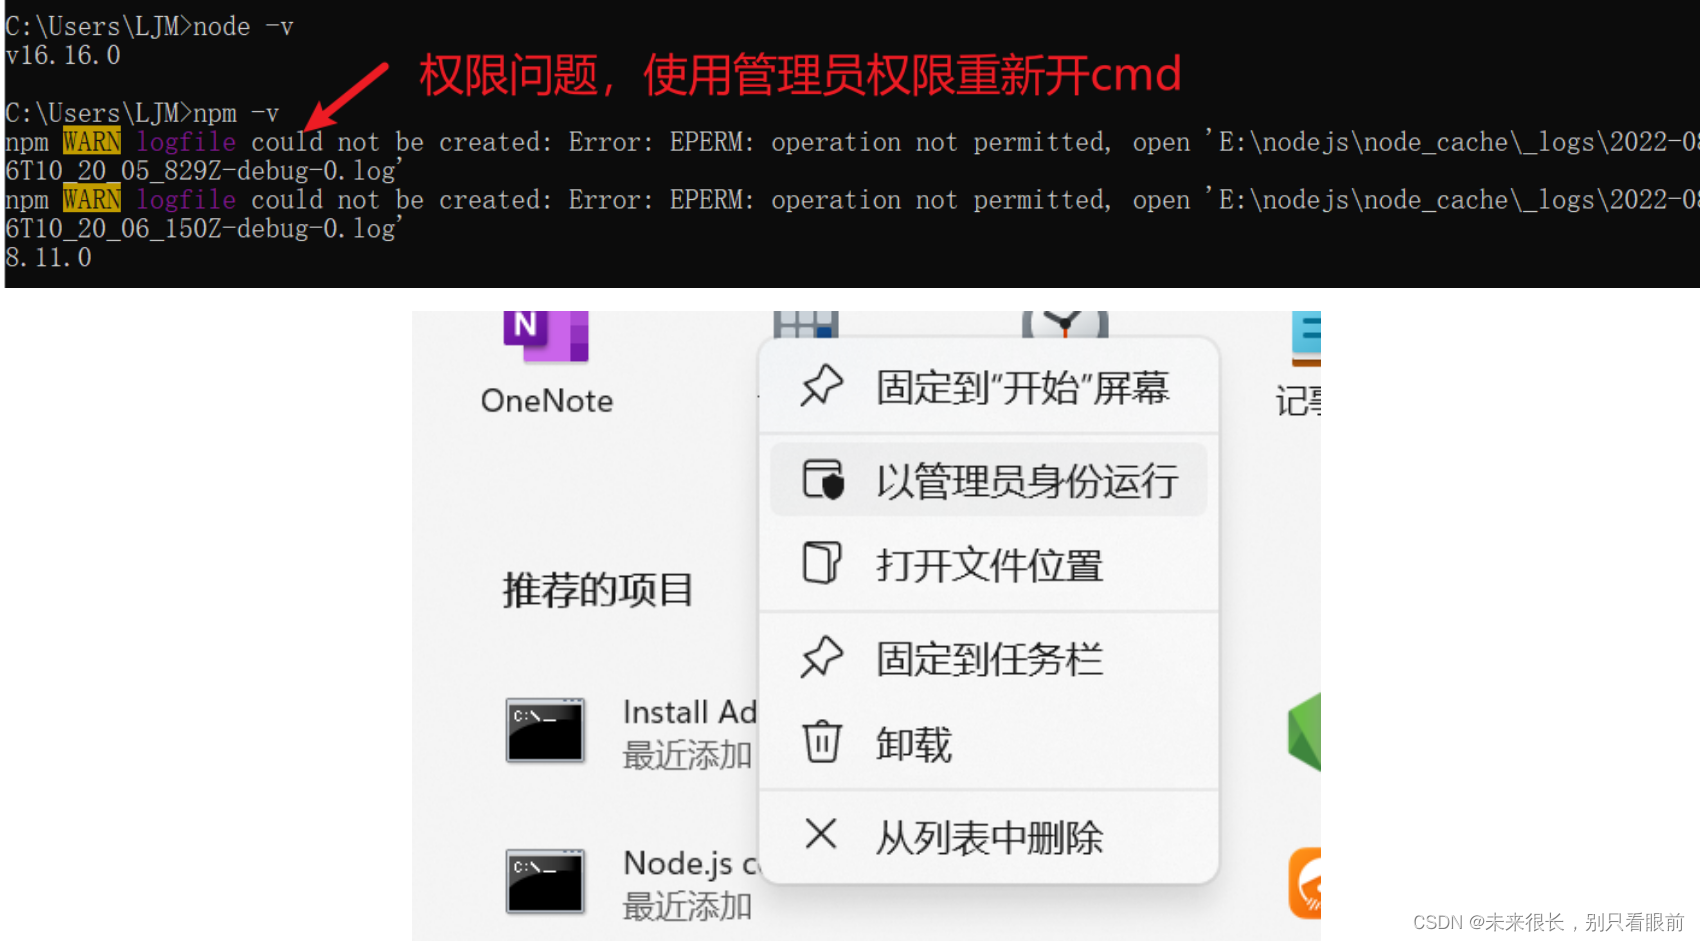
Install nodejs
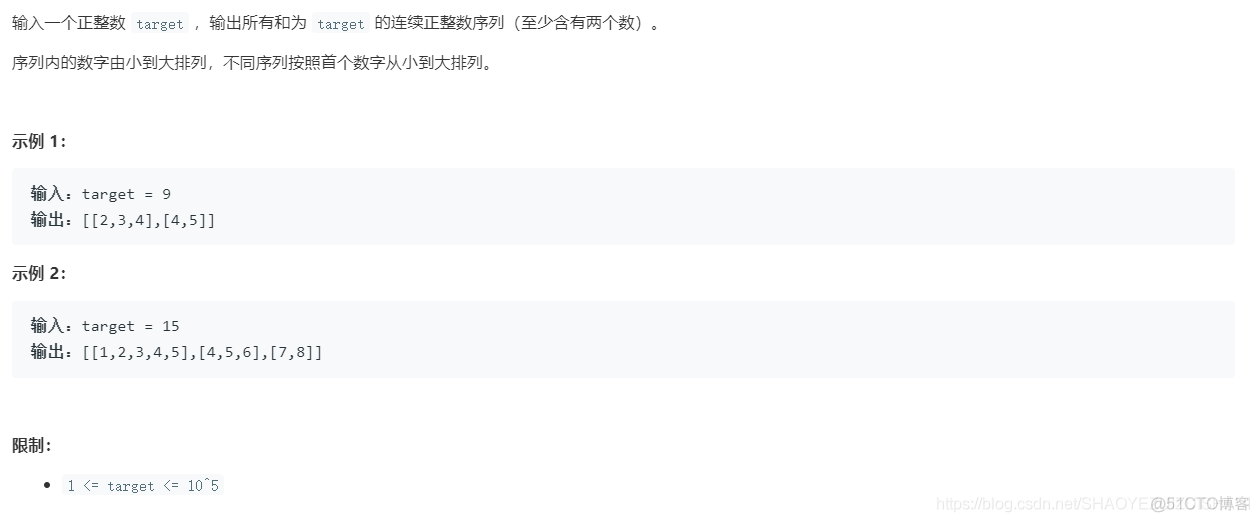
和为s的连续正数序列
随机推荐
php获取微信小程序码并存储到oss
【UOJ 454】打雪仗(通信题)(分块)
MySQL数据库基础01
二、第二章变量
【Prometheus】Alertmanager告警全方位讲解
[UE] 入坑
mySQL事务及其特性分析
[Ext JS]11.14 SimXhr.js?_dc=1659315492151:65 Uncaught TypeError problem analysis and solution
How to analyze the neural network diagram, draw the neural network structure diagram
数据库内核面试中我不会的问题(4)
The mathematical knowledge required for neural networks, the mathematical foundation of neural networks
论文笔记:《Time Series Generative Adversrial Networks》(TimeGAN,时间序列GAN)
unity初级面试分享
Word小技巧之图表实现自动编号和更新
I got the P8 "top" distributed architecture manual that went viral on Ali's intranet
人是怎么废掉的?人是怎么变强的?
数据库的索引和其底层数据结构
错误代码: 1118 - Row size too large (> 8126). Changing some columns to TEXT or BLOB may help. In current
【无标题】(完美解决)uni-app 小程序下拉刷新后刷新图标无法正常恢复的问题
MySQL数据库基础_常用数据类型_表设计