当前位置:网站首页>Master vscode remote GDB debugging
Master vscode remote GDB debugging
2022-04-23 15:52:00 【ZONG_ XP】
0 background
Recently, under the Amway of my colleagues , Tried to use vscode do gdb debugging , After use ,“ It's delicious ”.
Don't talk much , What this paper wants to achieve is : stay windows Terminal remote debugging linux The server and arm On embedded devices c++ Code , Yes gdb The configuration and use of debugging shall be sorted out .
Other :《 One article mastery vscode Remote debugging python Code 》
1 Remote connection
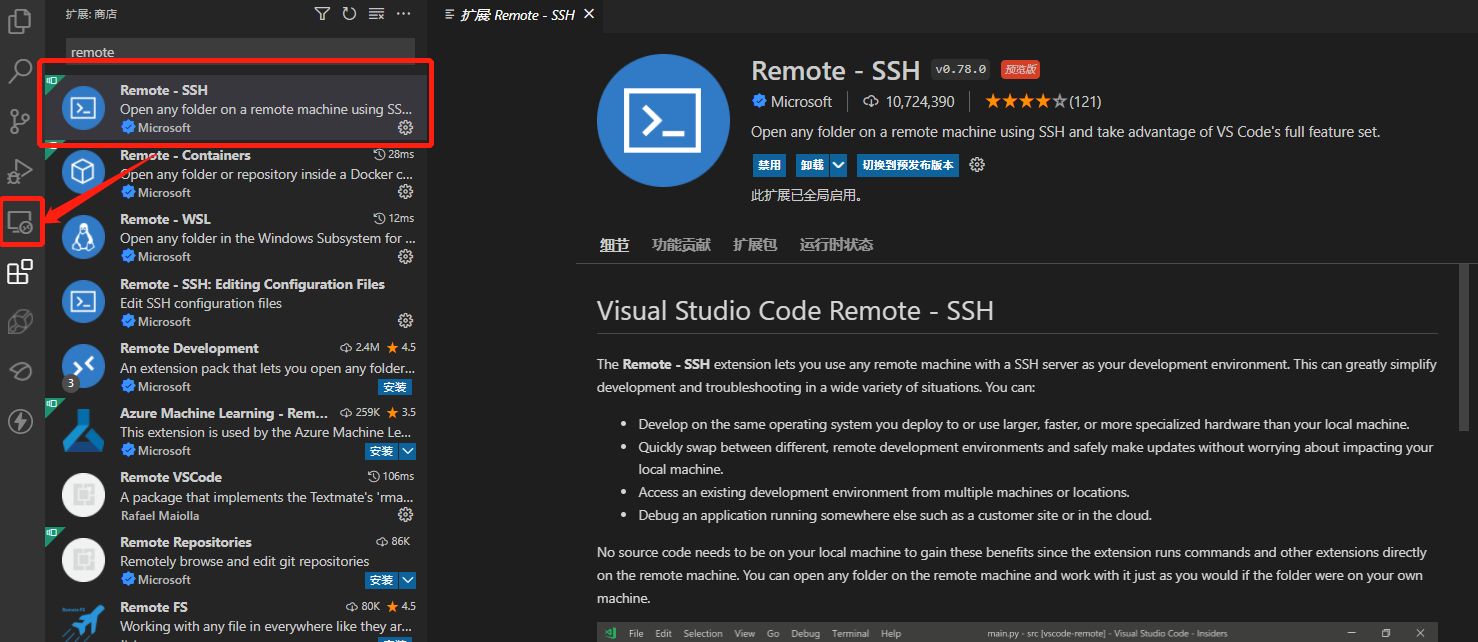
First, you need to realize remote connection to the server , Search in plug-in library “remote-ssh”, Double click to download and install ( In the figure below, I have installed ), After installation, remote Explorer appears in the sidebar
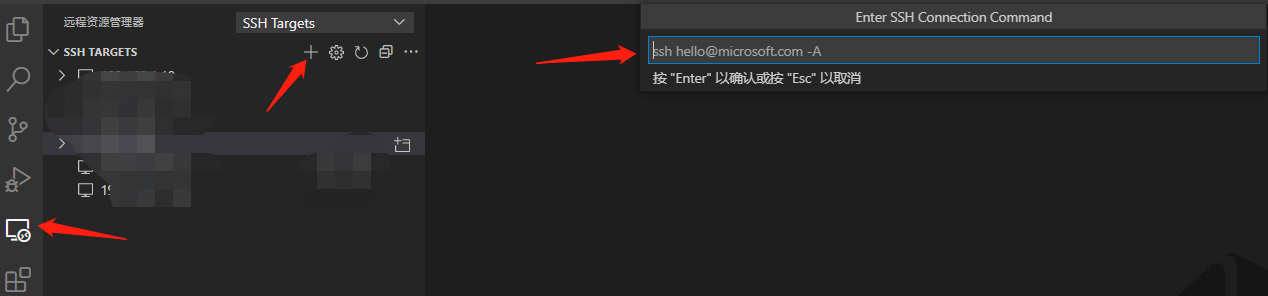
Click on + Number , In the pop-up command window, enter ssh Login instruction , Follow the instructions , Enter the password and confirm , You can connect successfully
2 To configure GDB Environmental Science
Create a c++ Code , Here we use 《Linux And C++ Get the system user name 》 For example, the code in , It's simple
#include <unistd.h>
#include <pwd.h>
#include <iostream>

int main()
{
	struct passwd* pwd;
	uid_t userid;
	userid = getuid();
	pwd = getpwuid(userid);

	std::cout << "pw_name:" << pwd->pw_name << std::endl;
	std::cout << "pw_passwd:" << pwd->pw_passwd << std::endl;
	std::cout << "pw_uid:" << pwd->pw_uid << std::endl;
	std::cout << "pw_gid:" << pwd->pw_gid << std::endl;
	std::cout << "pw_gecos:" << pwd->pw_gecos << std::endl;
	std::cout << "pw_dir:" << pwd->pw_dir << std::endl;
	std::cout << "pw_shell:" << pwd->pw_shell << std::endl;

    return 0;
}
Compile as follows , Be sure to add -g Instructions , Otherwise, we can't gdb debugging
g++ -g test.cpp -o testAnd then click file - Open folder , Find the created code path , after , In the Explorer on the left, you can see the code file .
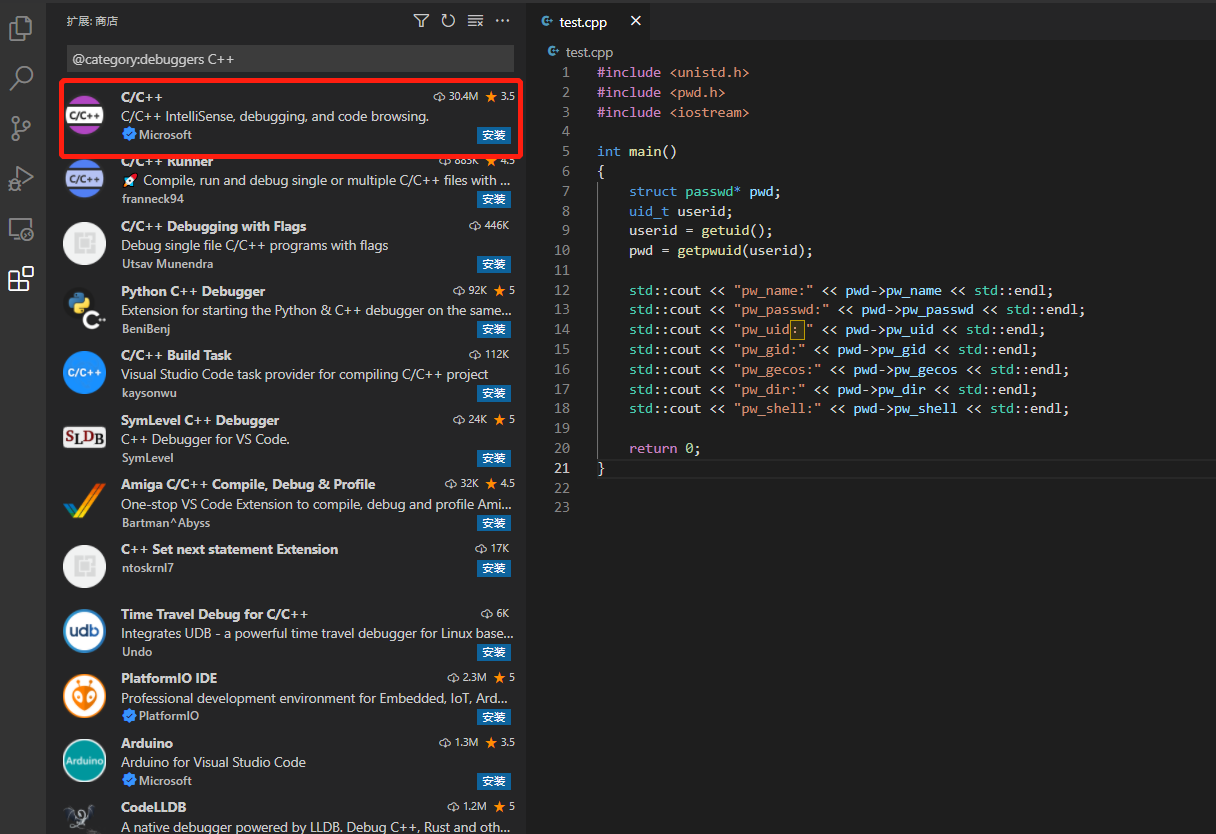
Installation is required for the first operation c++ An extension of , In the extension page , install C/C++
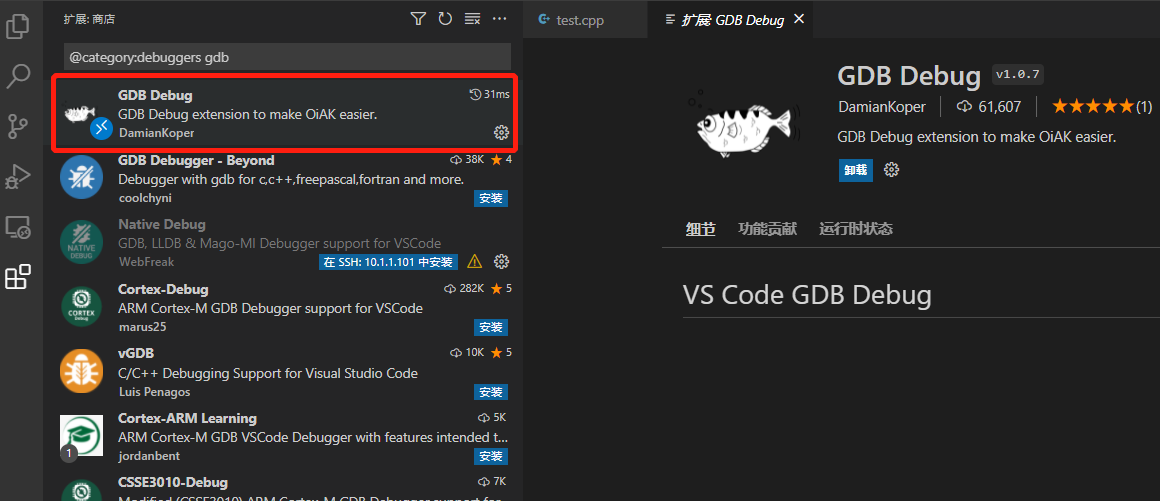
Simultaneous search GDB Debug And install
Once installed , Click on “ Operation and commissioning ” Button ,“ establish launch.json” file ,
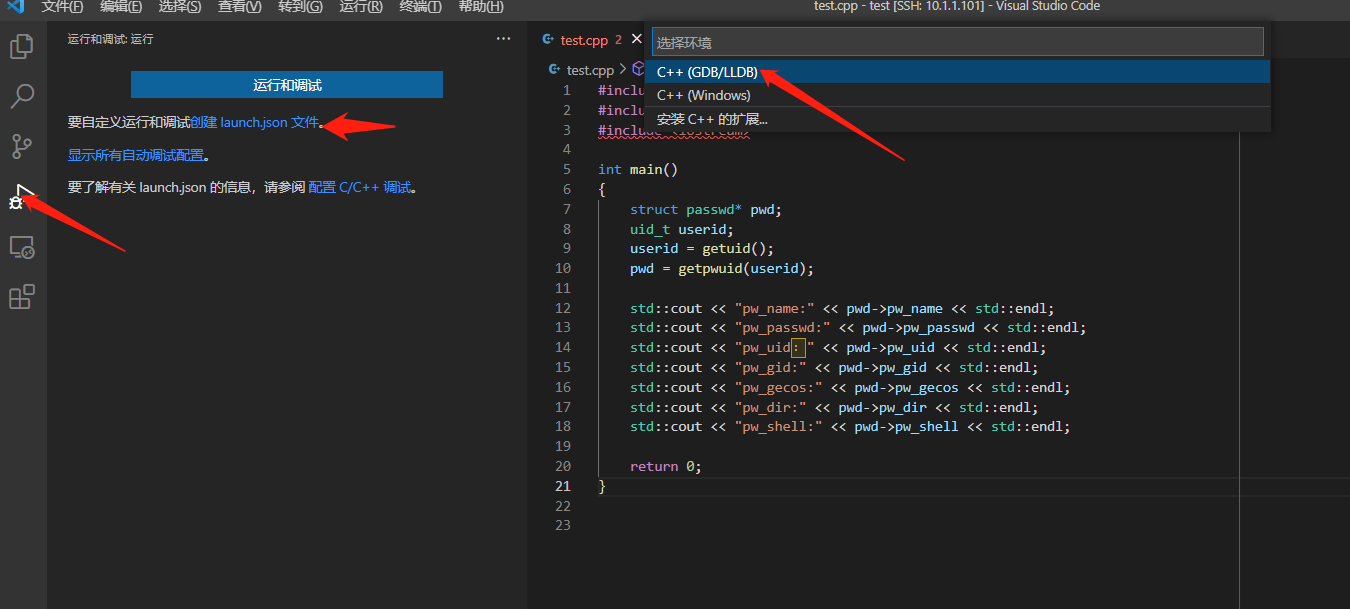
choice C++(GDB/LLDB) term , Automatic generation launch.json file , The contents are as follows
{
    //  Use  IntelliSense  Learn about properties .
    //  Hover to see the description of an existing property .
    //  For more information , Please visit : https://go.microsoft.com/fwlink/?linkid=830387
    "version": "0.2.0",
    "configurations": []
}
Follow the content below , Modify the corresponding
{
    //  Use  IntelliSense  Learn about properties .
    //  Hover to see the description of an existing property .
    //  For more information , Please visit : https://go.microsoft.com/fwlink/?linkid=830387
    "version": "0.2.0",
    "configurations": [
        {
            "name": "(gdb)  start-up ", // Configuration name , Displayed in the configuration drop-down menu
            "type": "cppdbg", // Configuration type
            "request": "launch", // Request configuration type , It can be startup or additional
            "program": "${workspaceFolder}/test", // The full path of the program executable ,${workspaceFolder} Indicates the initial path of the remote connection
            "args": [], // Command line arguments passed to the program
            "stopAtEntry": false,// Optional parameters , If true, The debugger should be at the entrance (main) Stop at
            "cwd": "${workspaceFolder}", // Target's working directory
            "environment": [], // Indicates the environment variable to be preset
            "externalConsole": false,// If true, Start the console for the debug object
            "MIMode": "gdb",// The console you want to connect to starts the program
            "setupCommands": [ // One or more... Executed to install the base debugger GDB/LLDB command
                {
                    "description": " by  gdb  Enable neat printing ",
                    "text": "-enable-pretty-printing",
                    "ignoreFailures": true
                }
            ]
        }
    ]
}
So far, the environment configuration is completed
3 GDB Debugging method
Click directly on the left side of the number of lines in the source code , You can add breakpoints , After setting the breakpoint , Click on “ Operation and commissioning ”--(gdb) start-up , as follows
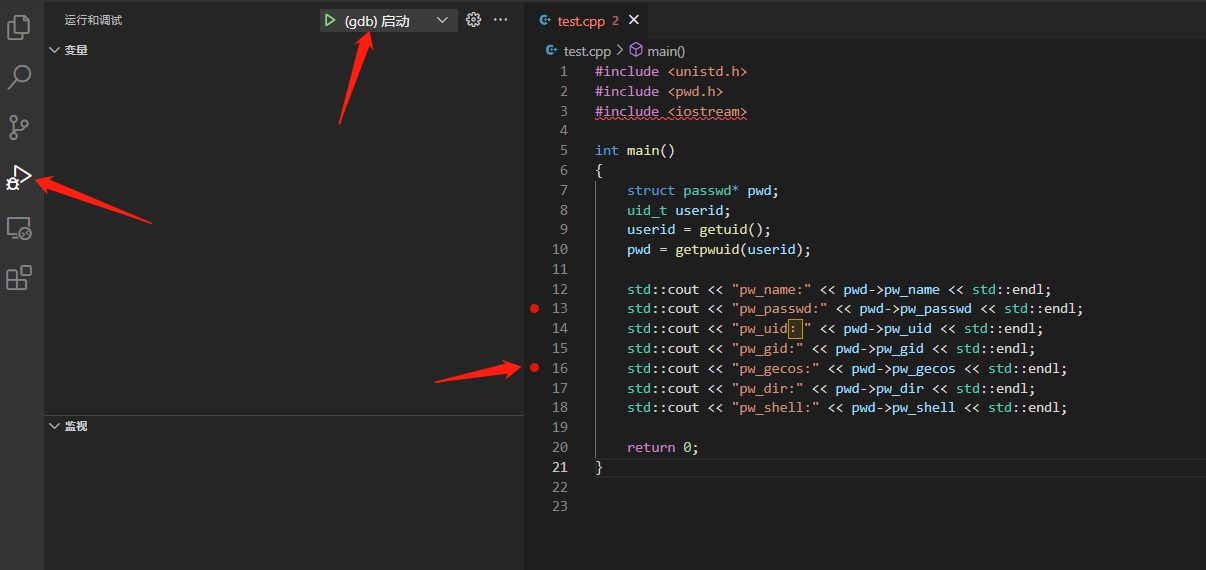
You can enter the debug page
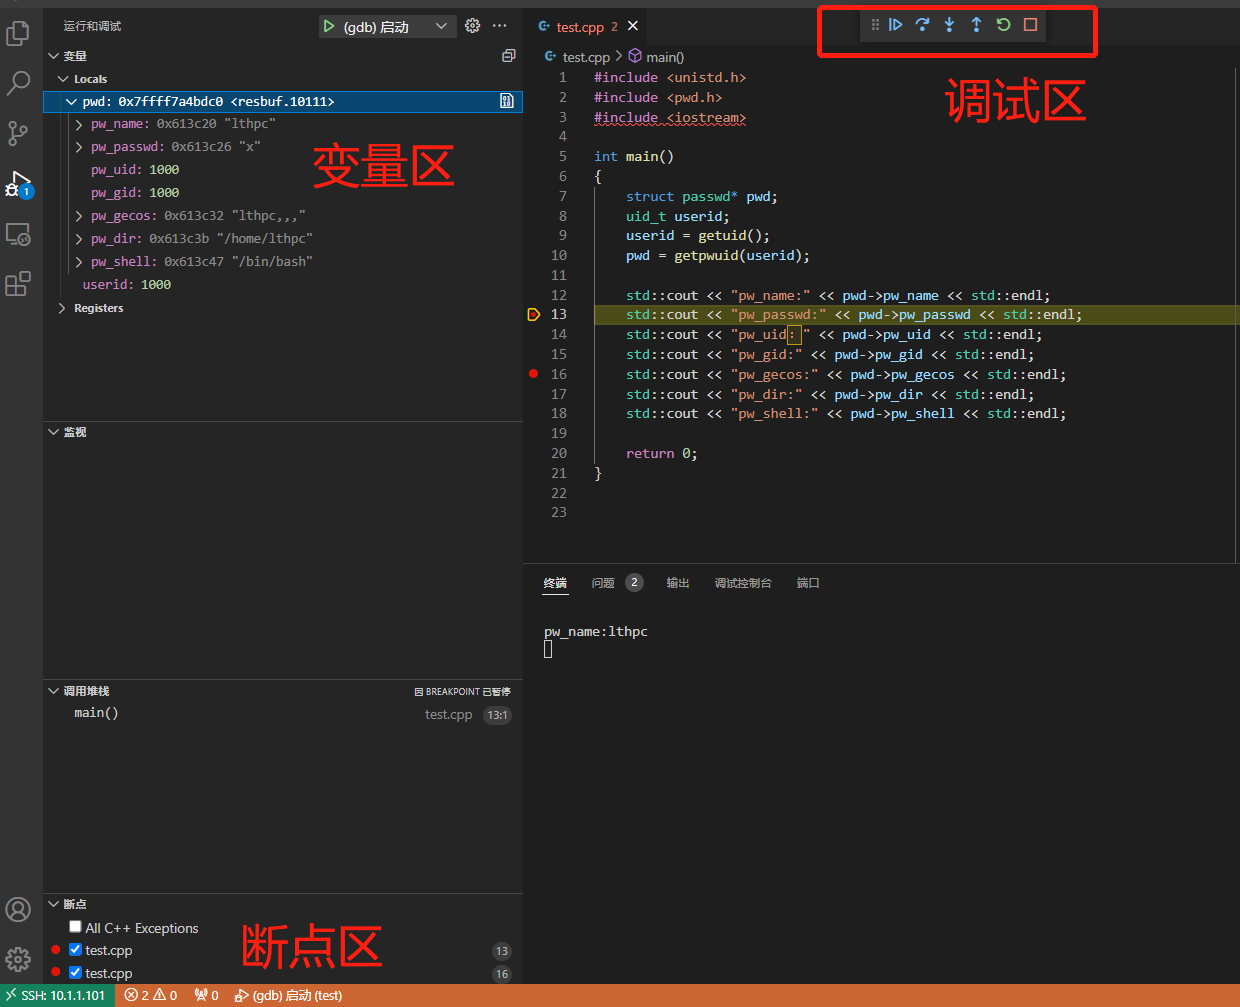
You can see the variable value directly in the variable area , Complete commissioning purpose .
Common debugging keys are as follows
F5 Start debugging
F10 Step over
F11 Step by step debugging
shift + F11 Step out
ctrl + shift + F5 Restart debugging
shift + F5 Stop debugging
版权声明
本文为[ZONG_ XP]所创,转载请带上原文链接,感谢
https://yzsam.com/2022/04/202204231547448963.html
边栏推荐
- cadence SPB17. 4 - Active Class and Subclass
- 基于 TiDB 的 Apache APISIX 高可用配置中心的最佳实践
- Go语言切片,范围,集合
- 单体架构系统重新架构
- 时序模型:门控循环单元网络(GRU)
- Spark 算子之partitionBy
- Deletes the least frequently occurring character in the string
- JVM-第2章-类加载子系统(Class Loader Subsystem)
- PS add texture to picture
- Temporal model: long-term and short-term memory network (LSTM)
猜你喜欢
JVM-第2章-类加载子系统(Class Loader Subsystem)
![[open source tool sharing] MCU debugging assistant (oscillograph / modification / log) - linkscope](/img/39/4d37c381f16dbe11acc64c92d0a1e5.png)
[open source tool sharing] MCU debugging assistant (oscillograph / modification / log) - linkscope
Filter usage of spark operator
Config learning notes component
Codejock Suite Pro v20. three
Large factory technology implementation | industry solution series tutorials
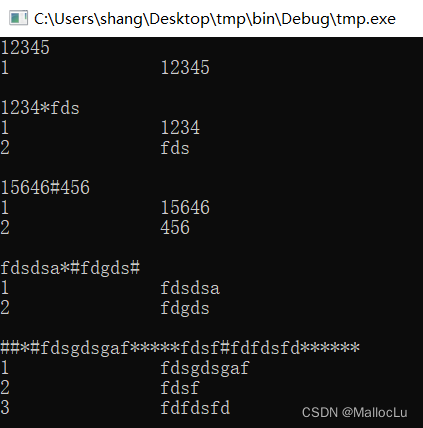
C语言自编字符串处理函数——字符串分割、字符串填充等
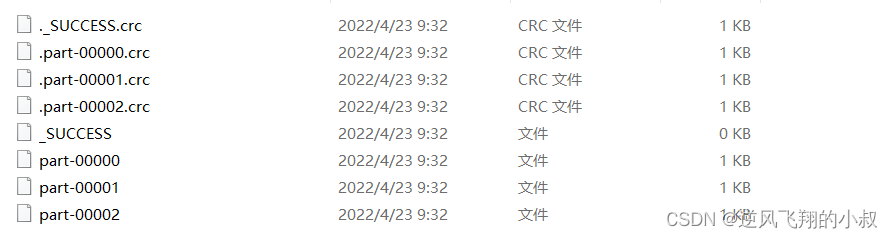
Coalesce and repartition of spark operators
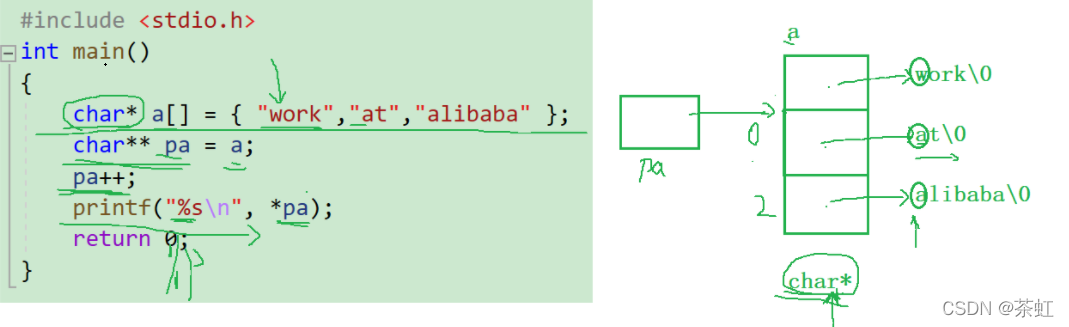
c语言---指针进阶
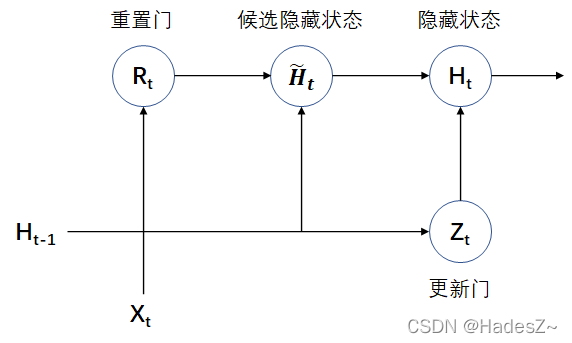
Timing model: gated cyclic unit network (Gru)
随机推荐
One brush 313 sword finger offer 06 Print linked list from end to end (E)
IronPDF for . NET 2022.4.5455
C语言自编字符串处理函数——字符串分割、字符串填充等
Large factory technology implementation | industry solution series tutorials
一文掌握vscode远程gdb调试
How can poor areas without networks have money to build networks?
Spark 算子之distinct使用
C language --- string + memory function
Calculate the number of occurrences of a character
The principle and common methods of multithreading and the difference between thread and runnable
leetcode-396 旋转函数
c语言---指针进阶
Fastjon2 here he is, the performance is significantly improved, and he can fight for another ten years
Single architecture system re architecture
Basic greedy summary
Neodynamic Barcode Professional for WPF V11.0
[split of recursive number] n points K, split of limited range
R语言中实现作图对象排列的函数总结
Accumulation of applet knowledge points
Why disable foreign key constraints