当前位置:网站首页>Website pressure measurement tools Apache AB, webbench, Apache jemeter
Website pressure measurement tools Apache AB, webbench, Apache jemeter
2022-04-23 15:53:00 【Light tears without trace】
Website pressure testing tool Apache-ab,webbench,Apache-Jemeter
1、 Build a test website
compile LAMP Website deployment :LAMP
web1 To configure :
yum How to build a website
initialization
cd /etc/yum.repos.d/
yum install -y wget
wget http://mirrors.aliyun.com/repo/Centos-7.repo
wget http://mirrors.aliyun.com/repo/epel-7.repo
mv CentOS-Base.repo CentOS-Base.repo.bak
yum clean all
yum makecache
systemctl stop firewalld
systemctl disable firewalld
sed -i 's/SELINUX=enforcing$/SELINUX=disabled/g' /etc/selinux/config
setenforce 0
yum Way to build PHP The website is used for pressure measurement
yum -y install httpd php php-mysqlnd php-gd
vi /var/www/html/index.php
<?php
phpinfo();
?>
Modify the system file configuration
vi /etc/security/limits.conf Add at the bottom
# Modify file open limit
* soft core unlimited
* hard core unlimited
* soft nproc 1000000
* hard nproc 1000000
* soft nofile 1000000
* hard nofile 1000000
* soft memlock 32000
* hard memlock 32000
* soft msgqueue 8192000
* hard msgqueue 8192000
Restart the device , Make system configuration effective
ulimit -n see limit Whether the configuration is effective
systemctl start httpd
systemctl enable httpd
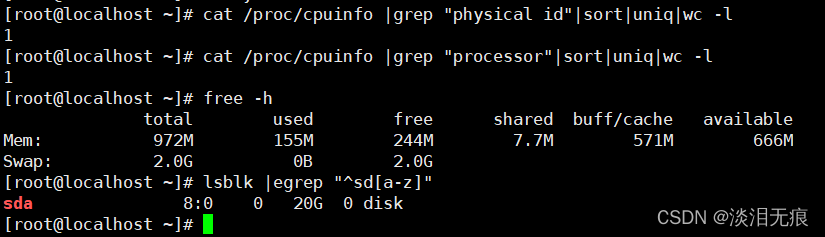
see web1 Hardware configuration
# see CPU Number
cat /proc/cpuinfo |grep "physical id"|sort|uniq|wc -l
# see CPU Bus number
cat /proc/cpuinfo |grep "processor"|sort|uniq|wc -l
# Look at the memory
free -h
# Check out the hard disk
lsblk |egrep "^sd[a-z]"
web2 Build a website like the above , Do system configuration
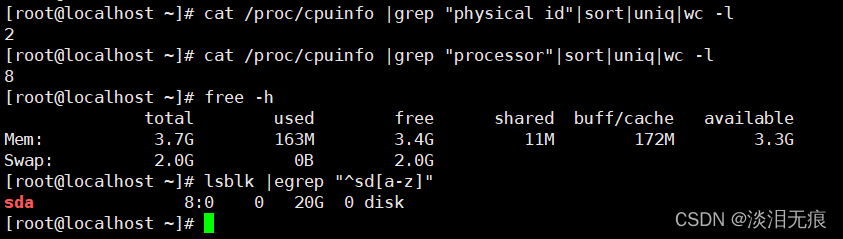
 see web2 Hardware configuration
# see CPU Number
cat /proc/cpuinfo |grep "physical id"|sort|uniq|wc -l
# see CPU Bus number
cat /proc/cpuinfo |grep "processor"|sort|uniq|wc -l
# Look at the memory
free -h
# Check out the hard disk
lsblk |egrep "^sd[a-z]"
2、Apache Bring their own tools ab
ab yes Apache The pressure test tool that comes with you . It can be to apache The server carries on the website visit stress test , Generate detailed website test information , So as to help developers optimize the website .
Test on pressure measuring equipment web1
yum install -y httpd-tools
ab -c 100 -n 2000 -k http://192.168.116.133/index.php

-c   Specify the number of concurrent
-n   Specify the total number of requests
-k   Test with persistent connections

Server Software:        Apache/2.4.6       #httpd Version of
Server Hostname:        192.168.116.133    # host IP
Server Port:            80                 # Host port

Document Path:          /index.php         # Web file name
Document Length:        61877 bytes        # Page file size

Concurrency Level:      100                # Concurrency
Time taken for tests:   2.566 seconds      # Total test time
Complete requests:      2000               # Total number of requests
Failed requests:        203                # Number of failed requests
   (Connect: 0, Receive: 0, Length: 203, Exceptions: 0)
Write errors:           0                  # Write error
Keep-Alive requests:    0                  # Number of hold request connections
Total transferred:      124119771 bytes   # Total request size
HTML transferred:       123753771 bytes    #HTML Request size

# Mainly look at these values
Requests per second:    779.47 [#/sec] (mean) # Number of requests processed per second
Time per request:       128.293 [ms] (mean)    # Request time per second
# Average concurrent request time
Time per request:       1.283 [ms] (mean, across all concurrent requests)
# Transmission rate
Transfer rate:          47239.93 [Kbytes/sec] received

# Connection time
Connection Times (ms)
              minimum value      Average      Median      Maximum
              min  mean[+/-sd] median   max
# Connection time
Connect:        0    1   1.5      0       9
# Data processing time
Processing:     6  124  22.5    124     625
# Waiting time
Waiting:        2  123  19.5    123     187
# All the time
Total:         15  125  21.7    125     626

Percentage of the requests served within a certain time (ms)
  50%    125
  66%    127
  75%    128
  80%    128
  90%    135
  95%    159
  98%    183
  99%    187
 100%    626 (longest request)
Test on pressure measuring equipment web2
yum install -y httpd-tools

ab -c 100 -n 2000 -k http://192.168.116.134/index.php

Server Software:        Apache/2.4.6
Server Hostname:        192.168.116.134
Server Port:            80

Document Path:          /index.php
Document Length:        61877 bytes

Concurrency Level:      100
Time taken for tests:   0.898 seconds
Complete requests:      2000
Failed requests:        198
   (Connect: 0, Receive: 0, Length: 198, Exceptions: 0)
Write errors:           0
Keep-Alive requests:    0
Total transferred:      124119797 bytes
HTML transferred:       123753797 bytes
Requests per second:    2227.90 [#/sec] (mean)
Time per request:       44.885 [ms] (mean)
Time per request:       0.449 [ms] (mean, across all concurrent requests)
Transfer rate:          135022.76 [Kbytes/sec] received

Connection Times (ms)
              min  mean[+/-sd] median   max
Connect:        0    2   1.6      1       8
Processing:     8   42   5.3     42      56
Waiting:        3   40   5.3     40      53
Total:         16   44   4.6     43      58

Percentage of the requests served within a certain time (ms)
  50%     43
  66%     45
  75%     46
  80%     47
  90%     49
  95%     50
  98%     53
  99%     54
 100%     58 (longest request)
web1 Main values of
 This value is generally 0 It's the best
Failed requests:        203                # Number of failed requests
   (Connect: 0, Receive: 0, Length: 203, Exceptions: 0)

 Devices with poor performance have a lower rate of processing requests per second
Requests per second:    779.47 [#/sec] (mean) # Number of requests processed per second

 Equipment with poor performance has high time delay
Time per request:       128.293 [ms] (mean)    # Request time per second
# Average concurrent request time
Time per request:       1.283 [ms] (mean, across all concurrent requests)

 The transmission rate of equipment with poor performance is low
# Transmission rate
Transfer rate:          47239.93 [Kbytes/sec] received
web2 Main values of
 This value is generally 0 It's the best
Failed requests:        198
   (Connect: 0, Receive: 0, Length: 198, Exceptions: 0)

 Devices with good performance process higher requests per second
Requests per second:    2227.90 [#/sec] (mean)

 The equipment with good performance has low time delay
Time per request:       44.885 [ms] (mean)
Time per request:       0.449 [ms] (mean, across all concurrent requests)

 The equipment with good performance has higher transmission rate
Transfer rate:          135022.76 [Kbytes/sec] received
3、webbench
webbench:Webbench It's a linux Under the use of a very simple website pressure testing tool . It USES fork() Simulate multiple clients accessing our settings at the same time URL, Test the performance of a website under pressure , You can simulate at most 3 Ten thousand concurrent connections to test the load capacity of the website .
GitHub Code :webbench Source code
webbench Official website :webbench
Compile and install the pressure measuring equipment webbench
yum install -y gcc ctags
wget http://home.tiscali.cz/~cz210552/distfiles/webbench-1.5.tar.gz
tar xf webbench-1.5.tar.gz
mkdir -m 644 -p /usr/local/webbench/man/man1   Create installation directory
cd webbench-1.5
make      Start compilation
# If the following warning appears, ignore it
cc -Wall -ggdb -W -O   -c -o webbench.o webbench.c
webbench.c:  In function ‘alarm_handler’ in :
webbench.c:77:31:  Warning : Unused parameters ‘signal’ [-Wunused-parameter]
 static void alarm_handler(int signal)
                               ^
cc -Wall -ggdb -W -O  -o webbench webbench.o
ctags *.c

make install PREFIX=/usr/local/webbench
cp webbench /usr/bin/

 Command line options :
 Short ginseng 	 Long parameters 	 effect
-f	--force	     There is no need to wait for the server to respond
-r	--reload	 Send reload request
-t	--time	     How long does it run , Company : second " -p --proxy server:port  Use a proxy server to send requests  -c --clients  How many clients are created , Default 1 individual "
-9	--http09	 Use  HTTP/0.9
-1	--http10	 Use  HTTP/1.0  agreement
-2	--http11	 Use  HTTP/1.1  agreement
--get	         Use  GET Request method
--head	         Use  HEAD Request method
--options	     Use  OPTIONS Request method
--trace	          Use  TRACE Request method
-?/-h	--help	 Print help
-V	--version	 Display version number
test 2 The performance of a website
 test web1
webbench -c 1000 -t 10 http://192.168.116.133/index.php

 You can see that when concurrency is 1000 when , Response requests per minute 38040 individual , The amount of data transmitted per second 38634276 byte
Speed=38040 pages/min, 38634276 bytes/sec.

 The total number of requests is 6340 individual
Requests: 6340 susceed, 0 failed.

 test web2, You can see that several values are better than web1 Much better
webbench -c 1000 -t 10 http://192.168.116.134/index.php

 You can see that when concurrency is 1000 when , Response requests per minute 84474 individual , The amount of data transmitted per second 85981248 byte
Speed=84474 pages/min, 85981248 bytes/sec.

 The total number of requests is 14079 individual
Requests: 14079 susceed, 0 failed.
4、Windows Lower installation Apache-Jmeter
Apache JMeter Can be used to test static and dynamic resources 、Web The performance of dynamic applications .
It can be used to simulate servers 、 Server groups 、 Heavy load on network or object , To test its strength or analyze the overall performance under different load types .
jmeter need java Environmental Science , So you need to install java
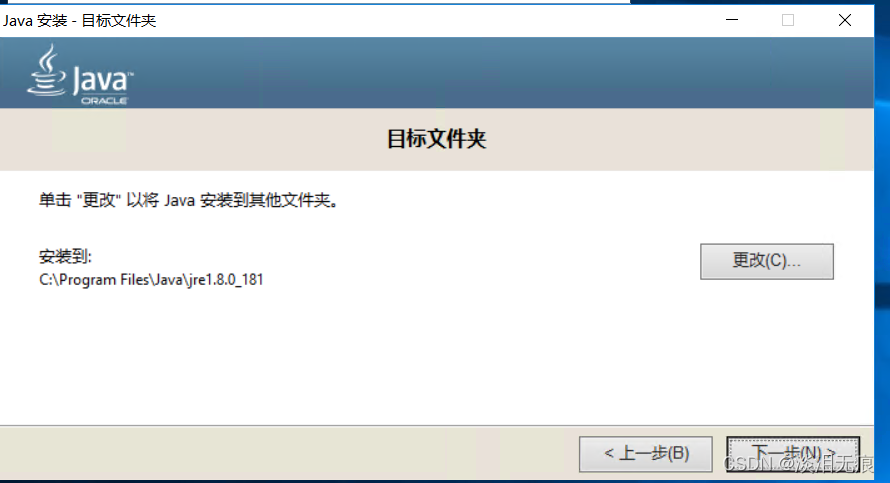
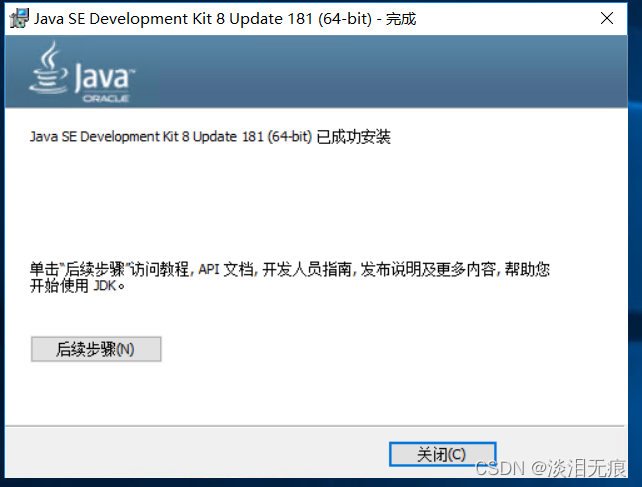
download java:Windows-java8, Then directly open the installation
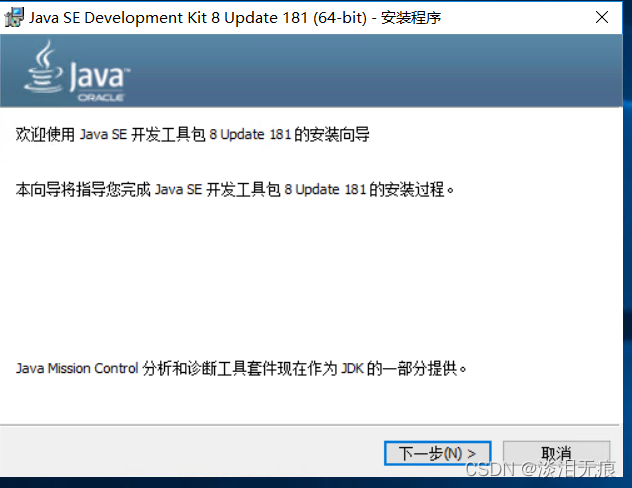
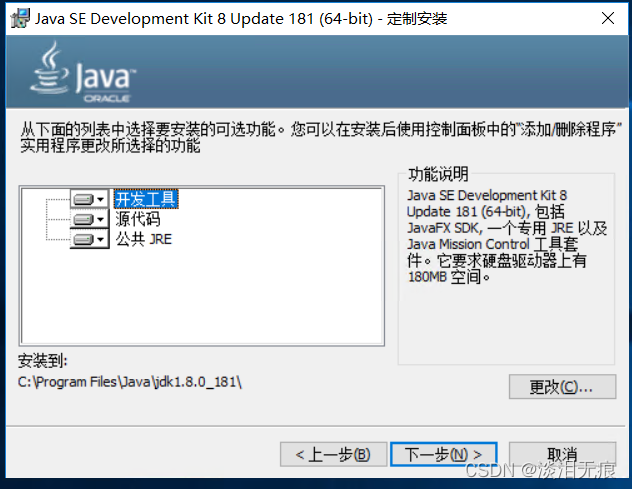
Select all default and next steps
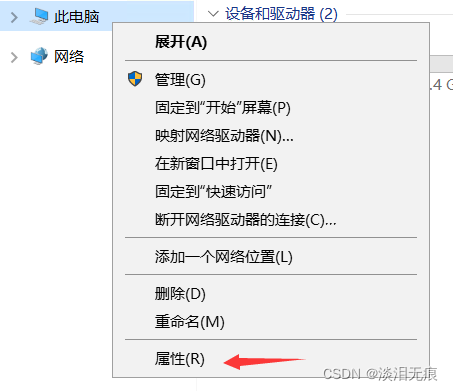
Right click this computer and click Properties
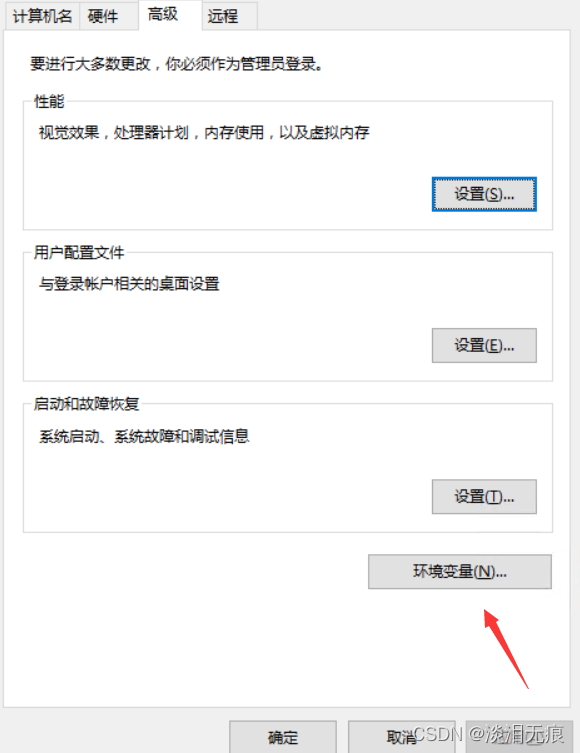
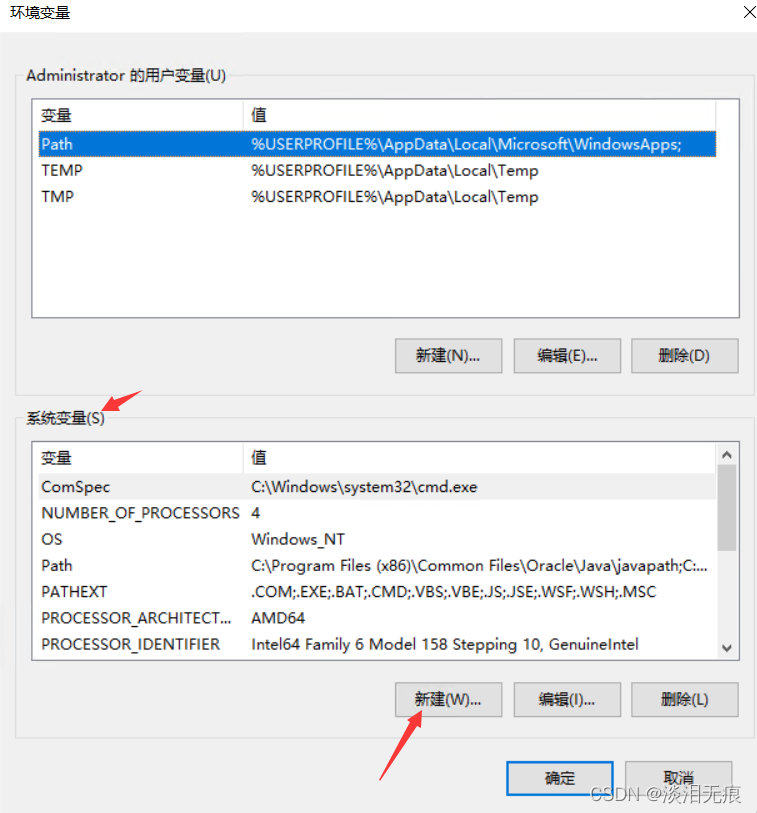
Select advanced system settings

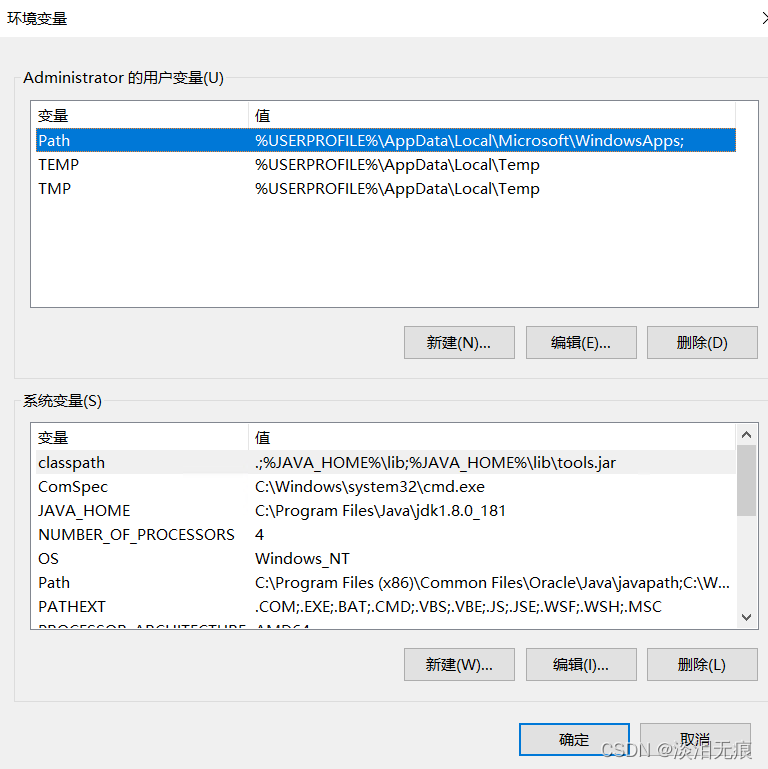
Choose environment variables
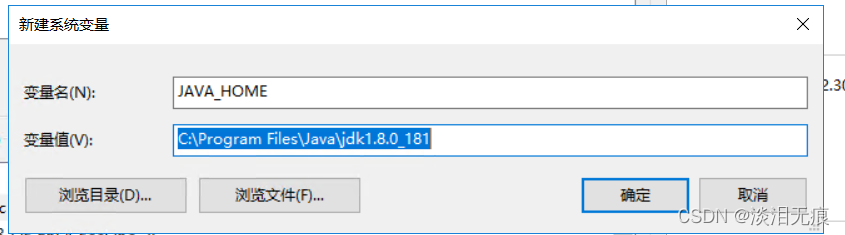
Select new system variable
Input java Installation directory , Set as variable
 Variable name :JAVA_HOME
 A variable's value :C:\Program Files\Java\jdk1.8.0_181
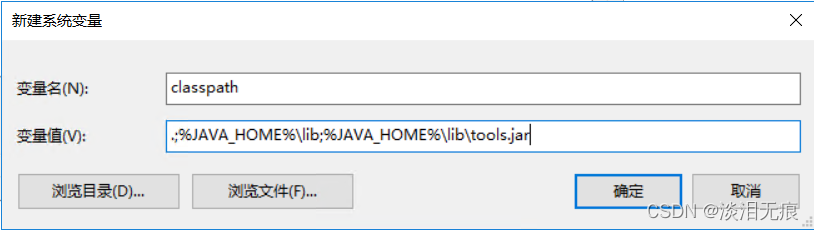
And then build a new one classpath Variable
classpath
.;%JAVA_HOME%\lib;%JAVA_HOME%\lib\tools.jar
Finally, find... In the system variable Path, Click edit , modify Path Variable
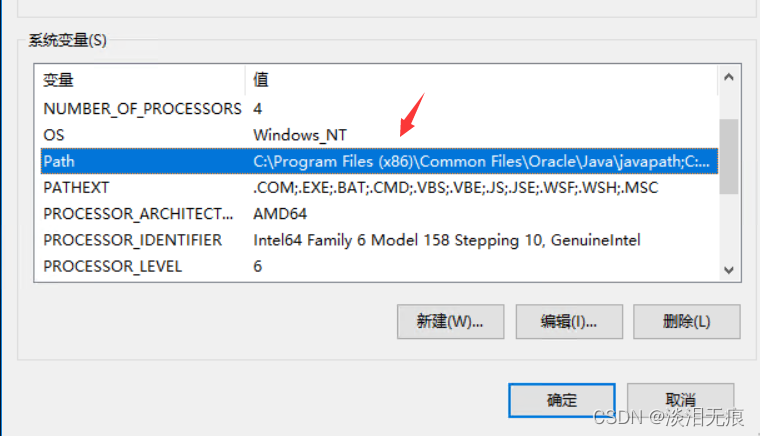
Create one more java route
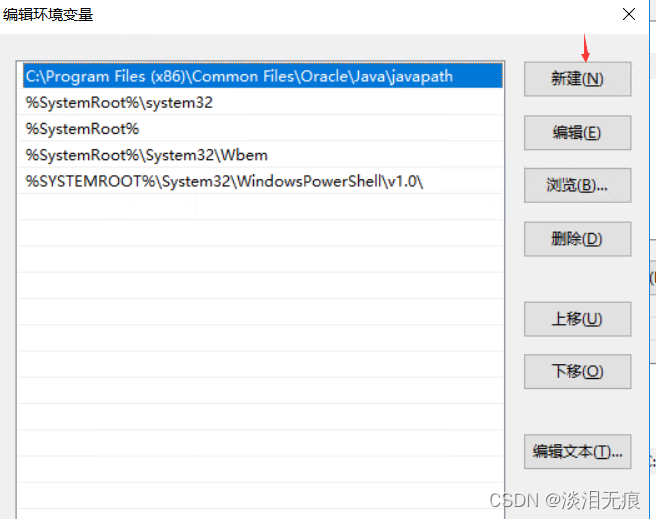
stay Path add to
%JAVA_HOME%\bin
%JAVA_HOME%\jre\bin
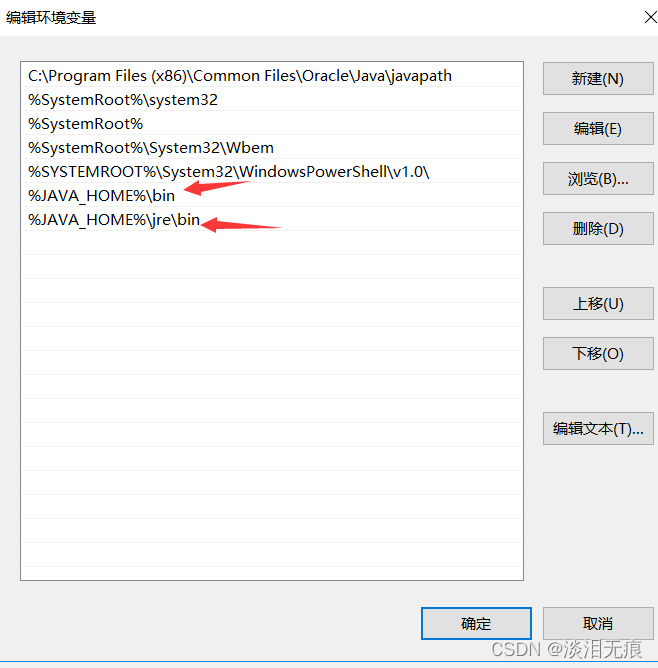
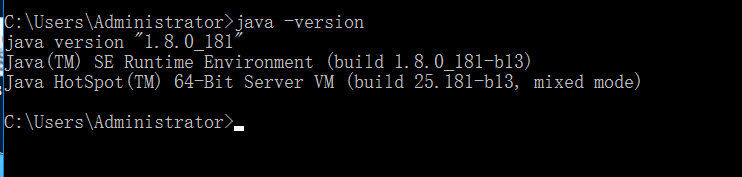
Finally, restart the system , Let variables take effect .
Open after restart CMD, See if you can recognize java

install Jmeter
Download the package :jmeter-5.2.1
Unzip the installation package and put it in C disc
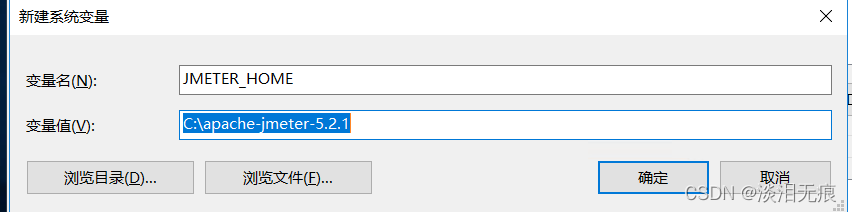
New system variable
establish jmeter The path variable of
JMETER_HOME
C:\apache-jmeter-5.2.1
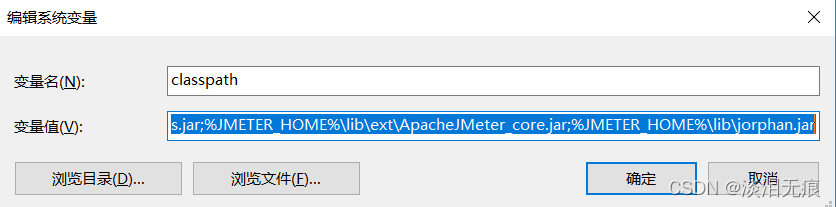
modify classpath A variable's value
 Change to the following
.;%JAVA_HOME%\lib;%JAVA_HOME%\lib\tools.jar;%JMETER_HOME%\lib\ext\ApacheJMeter_core.jar;%JMETER_HOME%\lib\jorphan.jar
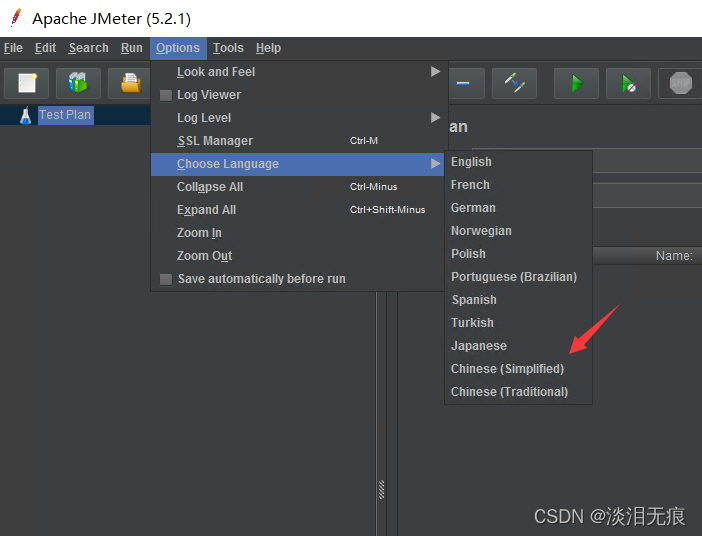
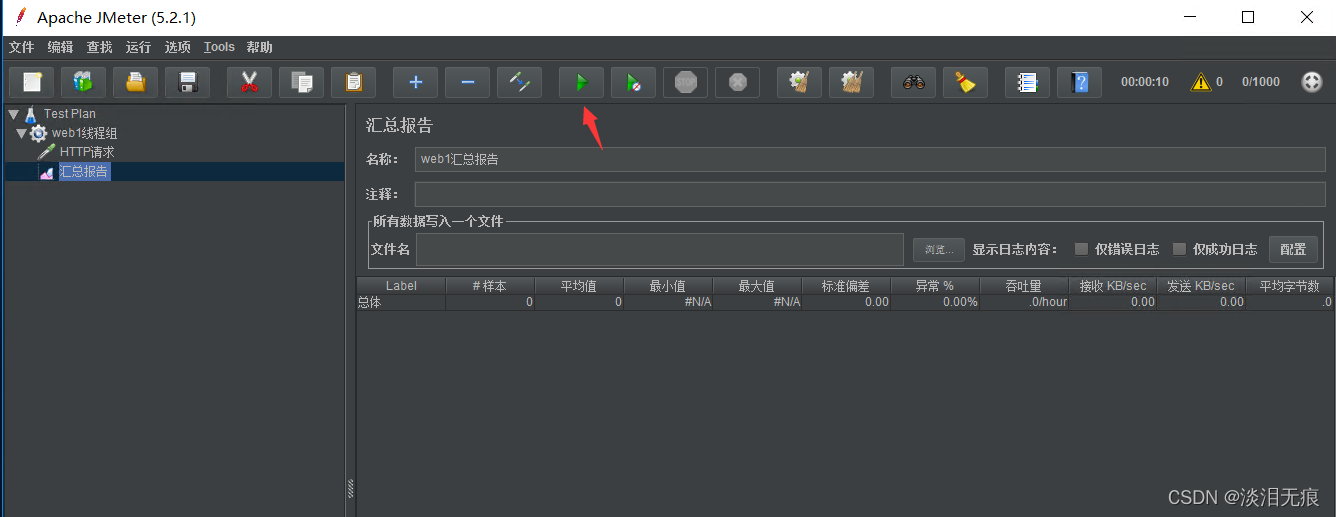
Double click the script to run jmeter
C:\apache-jmeter-5.2.1\bin\jmeter.bat
Change to Chinese
test web1
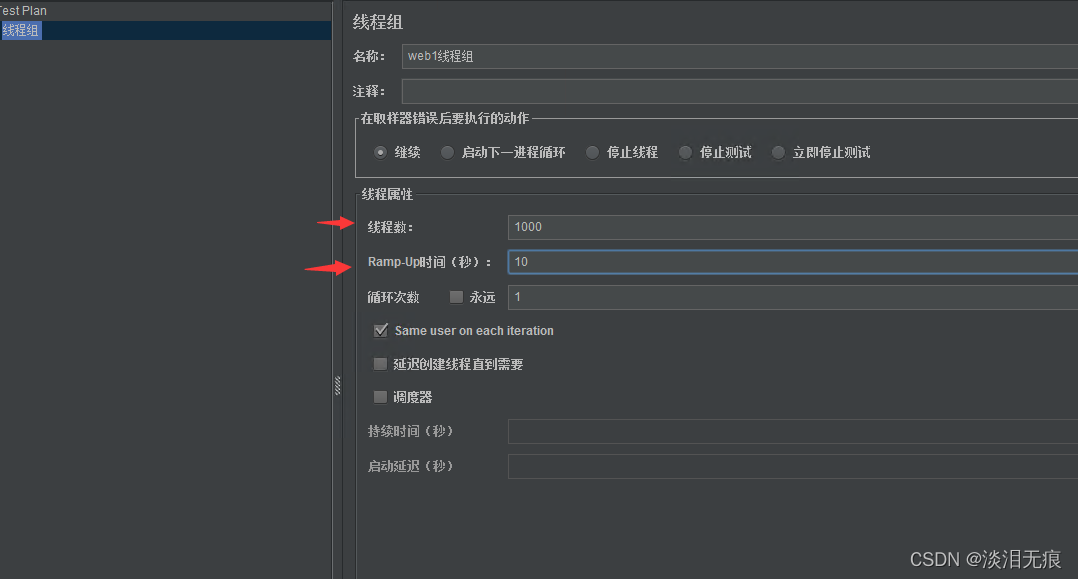
stay TestPlan Right click and select Add thread group
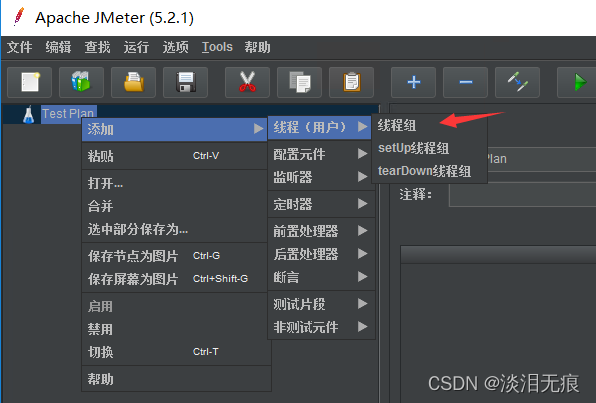
Set the number of threads ( Equivalent to the number of requests ),Ramp-Up( Total request time ), No need to save , Go straight to the next step
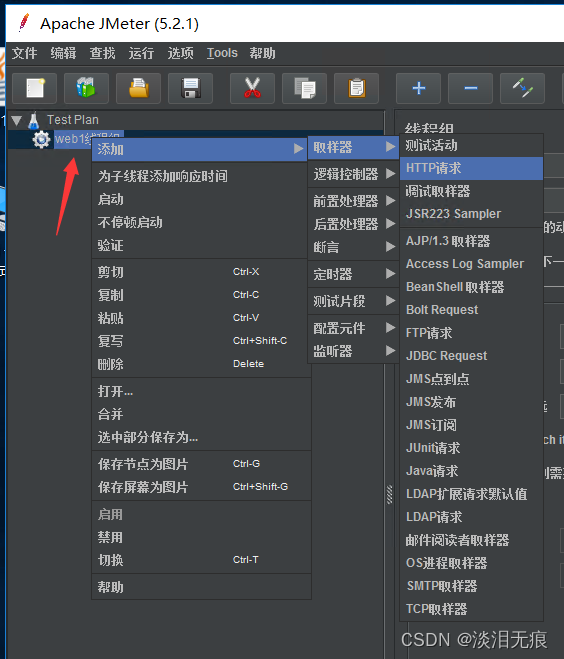
And then right-click web1 Thread group
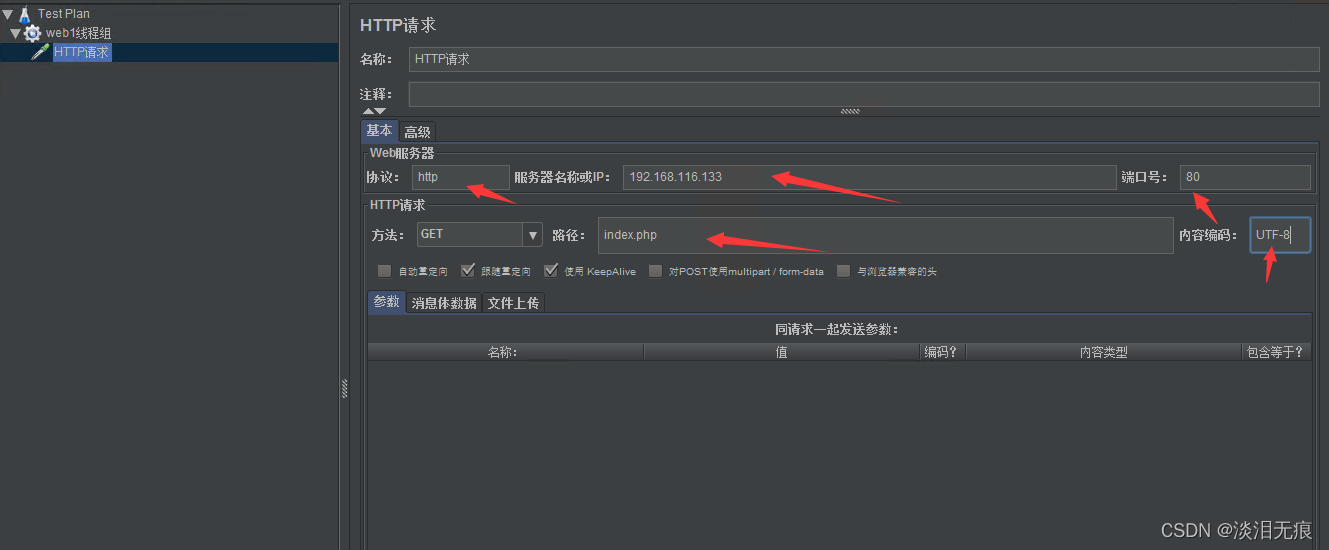
Enter the URL information
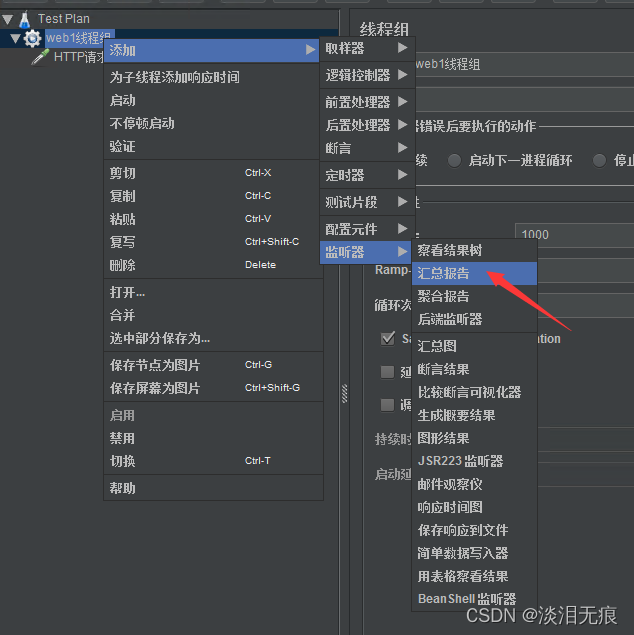
Right click again web1 Thread group , Add summary report
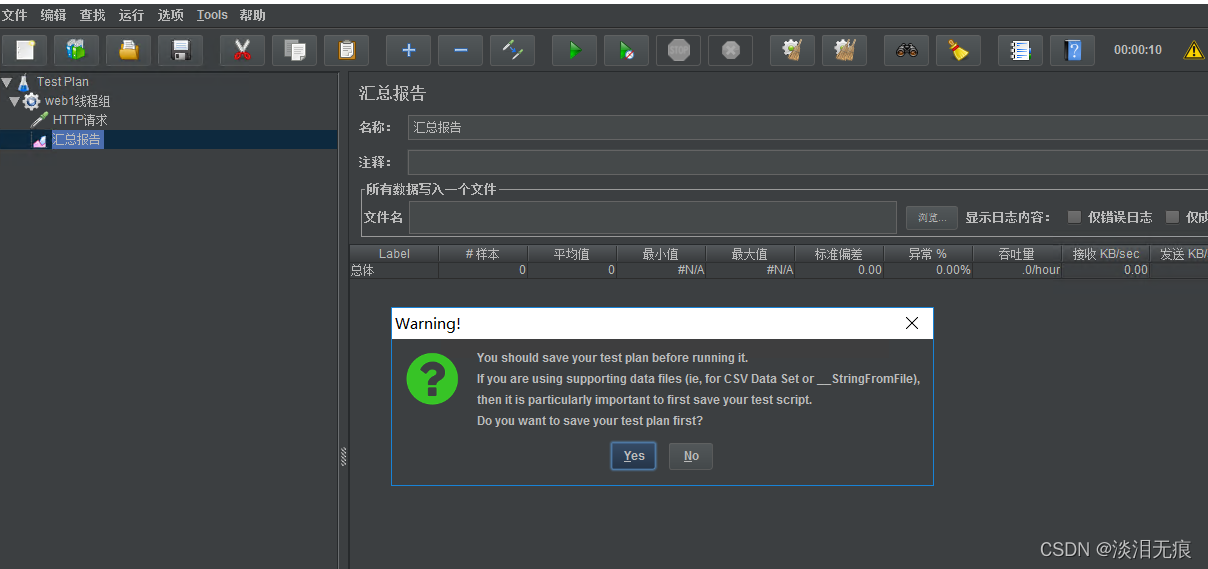
Click on the run
Prompt whether to save the operation plan , Direct selection no that will do
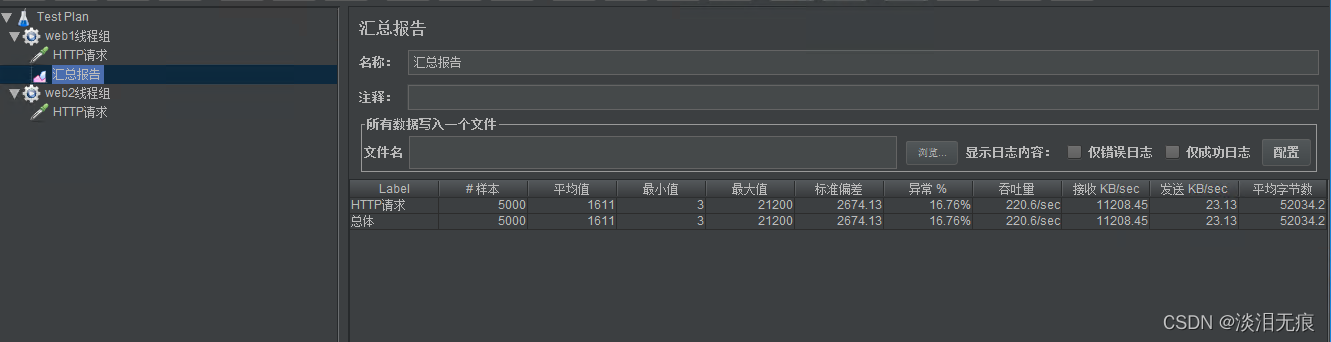
Wait a moment , You can see that web1 Website test results
You can see that the exception is 16.76%, Throughput for 220.6/sec
In general , The smaller the outlier, the better , The higher the throughput, the better , You can see web1 Performance ratio of web2 Bad
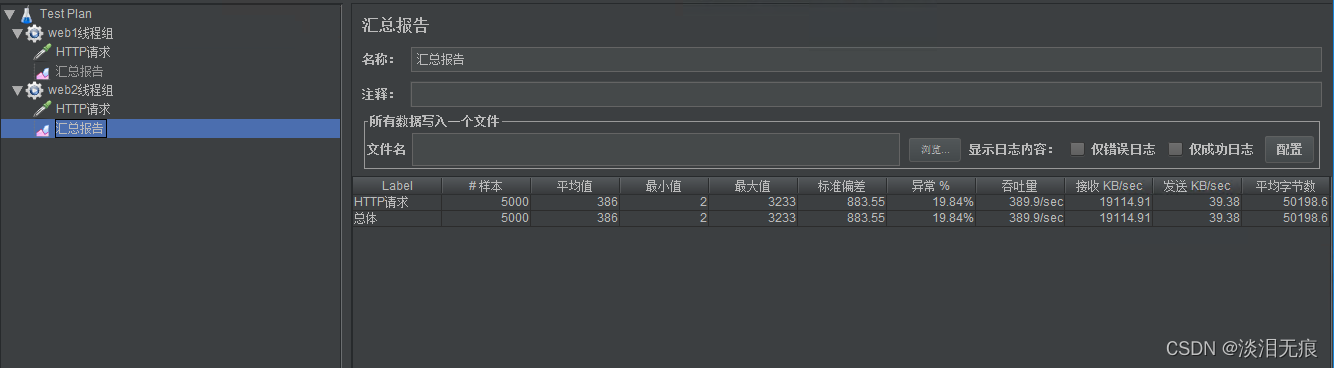
Follow the above steps to add web2 To test , View results
You can see that the exception is 19.84%, Throughput for 389.9/sec
In general , The smaller the outlier, the better , The higher the throughput, the better , You can see web2 Performance ratio of web1 good
版权声明
本文为[Light tears without trace]所创,转载请带上原文链接,感谢
https://yzsam.com/2022/04/202204231530058419.html
边栏推荐
- One brush 313 sword finger offer 06 Print linked list from end to end (E)
- TIA博图——基本操作
- [split of recursive number] n points K, split of limited range
- 运维流程有多重要,听说一年能省下200万?
- js正则判断域名或者IP的端口路径是否正确
- MySQL optimistic lock to solve concurrency conflict
- JS regular détermine si le nom de domaine ou le chemin de port IP est correct
- PHP operators
- c语言---字符串+内存函数
- R语言中实现作图对象排列的函数总结
猜你喜欢
Modèle de Cluster MySQL et scénario d'application
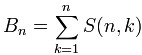
C#,贝尔数(Bell Number)的计算方法与源程序
5 minutes, turn your excel into an online database, the magic cube net table Excel database
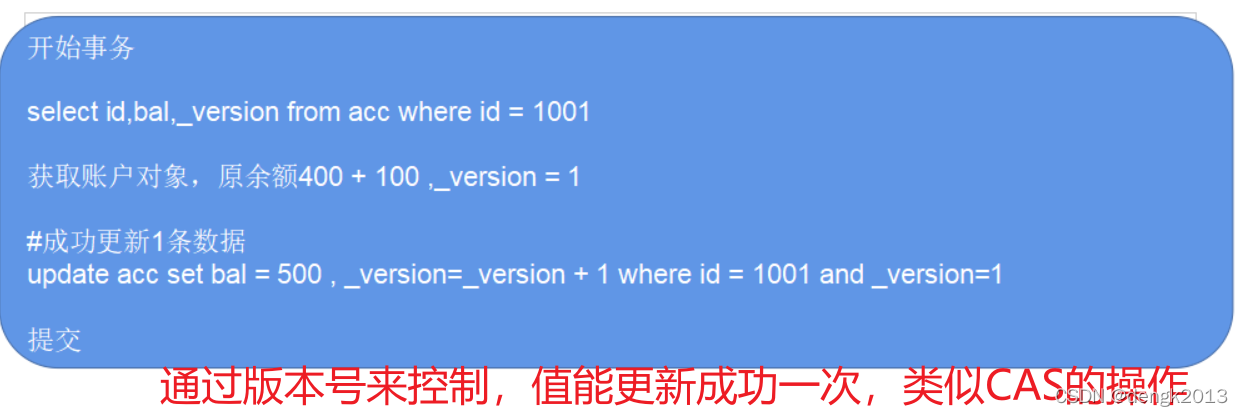
MySQL optimistic lock to solve concurrency conflict
![[AI weekly] NVIDIA designs chips with AI; The imperfect transformer needs to overcome the theoretical defect of self attention](/img/bf/2b4914276ec1083df697383fec8f22.png)
[AI weekly] NVIDIA designs chips with AI; The imperfect transformer needs to overcome the theoretical defect of self attention

WPS brand was upgraded to focus on China. The other two domestic software were banned from going abroad with a low profile
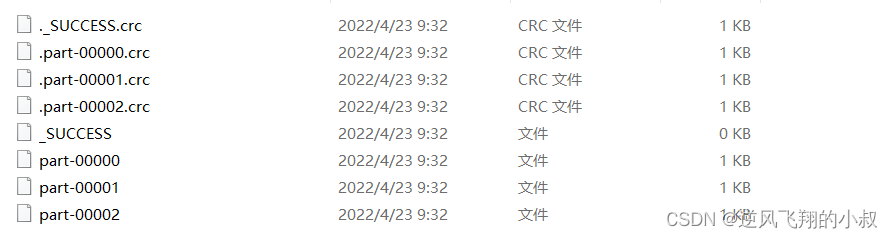
Spark 算子之coalesce与repartition
Single architecture system re architecture
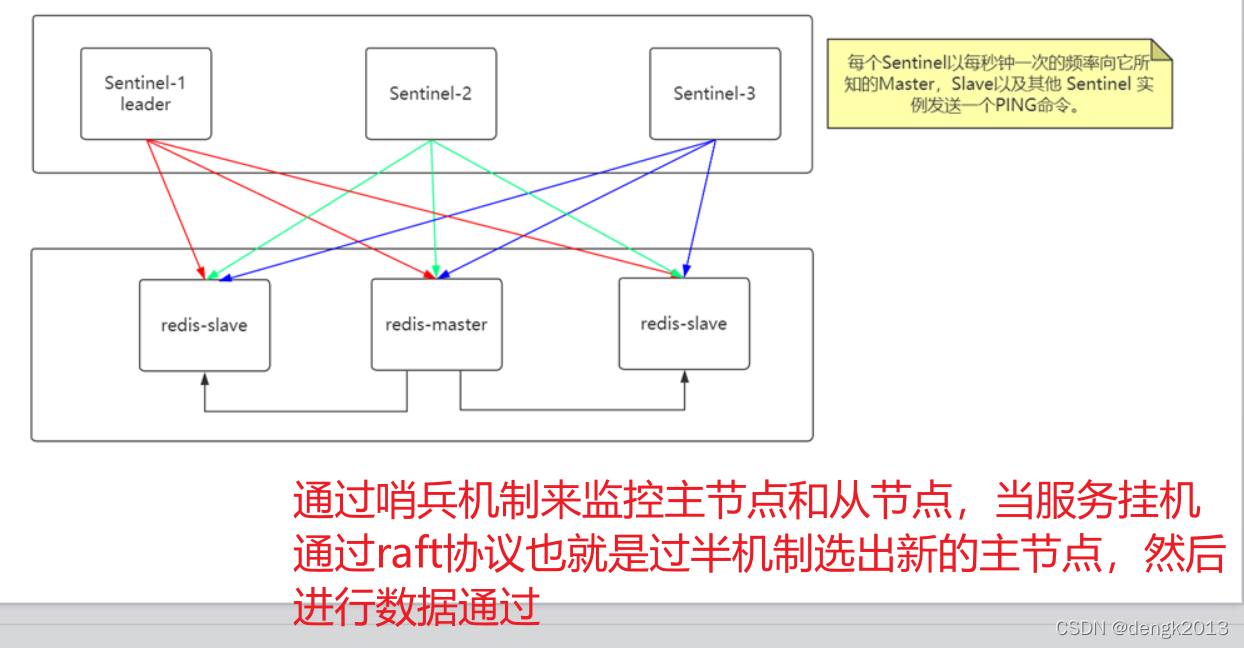
Redis主从复制过程
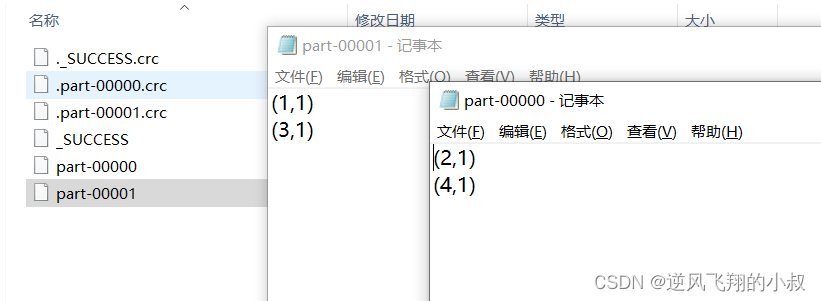
Partitionby of spark operator
随机推荐
Groupby use of spark operator
Neodynamic Barcode Professional for WPF V11. 0
API IX JWT auth plug-in has an error. Risk announcement of information disclosure in response (cve-2022-29266)
Large factory technology implementation | industry solution series tutorials
Go language, condition, loop, function
Application of Bloom filter in 100 million flow e-commerce system
大型互联网为什么禁止ip直连
Best practices of Apache APIs IX high availability configuration center based on tidb
Redis master-slave replication process
Metalife established a strategic partnership with ESTV and appointed its CEO Eric Yoon as a consultant
Config learning notes component
What if the server is poisoned? How does the server prevent virus intrusion?
Go language, array, pointer, structure
PHP classes and objects
Spark 算子之sortBy使用
Import address table analysis (calculated according to the library file name: number of imported functions, function serial number and function name)
One brush 312 - simple repetition set - Sword finger offer 03 Duplicate number in array (E)
The length of the last word of the string
Calculate the number of occurrences of a character
Partitionby of spark operator